Báo cáo khoa học: "A comparison of admission and worst 24-hour Acute Physiology and Chronic Health Evaluation II scores in predicting hospital mortality: a retrospective cohort study" ppsx
Bạn đang xem bản rút gọn của tài liệu. Xem và tải ngay bản đầy đủ của tài liệu tại đây (315.37 KB, 8 trang )
Open Access
Available online />Page 1 of 8
(page number not for citation purposes)
Vol 10 No 1
Research
A comparison of admission and worst 24-hour Acute Physiology
and Chronic Health Evaluation II scores in predicting hospital
mortality: a retrospective cohort study
Kwok M Ho
1,2,3
, Geoffrey J Dobb
4,5
, Matthew Knuiman
6
, Judith Finn
7
, Kok Y Lee
8
and
Steven AR Webb
8,9
1
Consultant Intensivist Department of Intensive Care, Royal Perth Hospital, Wellington street, Perth, WA 6000, Australia
2
PhD candidate, School of Population Health, University of Western Australia, Crawley, Perth, WA 6009, Australia
3
PhD candidate, School of Medicine and Pharmacology, University of Western Australia, Crawley, Perth, WA 6009, Australia
4
Acting Head of the Department, Department of Intensive Care, Royal Perth Hospital, Wellington street, Perth, WA 6000, Australia
5
Associate Professor, School of Medicine and Pharmacology, University of Western Australia, Crawley, Perth, WA 6009, Australia
6
Professor, School of Population Health, University of Western Australia, Crawley, Perth, WA 6009, Australia
7
Senior Lecturer, School of Population Health, University of Western Australia, Crawley, Perth, WA 6009, Australia
8
Consultant Intensivist, Department of Intensive Care, Royal Perth Hospital, Wellington street, Perth, WA 6000, Australia
9
Senior Lecturer, School of Medicine and Pharmacology, University of Western Australia, Crawley, Perth, WA 6009, Australia
Corresponding author: Kwok M Ho,
Received: 17 Aug 2005 Revisions requested: 26 Sep 2005 Revisions received: 6 Oct 2005 Accepted: 26 Oct 2005 Published: 25 Nov 2005
Critical Care 2006, 10:R4 (doi:10.1186/cc3913)
This article is online at: />© 2005 Ho et al.; licensee BioMed Central Ltd.
This is an open access article distributed under the terms of the Creative Commons Attribution License ( />),
which permits unrestricted use, distribution, and reproduction in any medium, provided the original work is properly cited.
Abstract
Introduction The Acute Physiology and Chronic Health
Evaluation (APACHE) II score is widely used in the intensive
care unit (ICU) as a scoring system for research and clinical
audit purposes. Physiological data for calculation of the
APACHE II score are derived from the worst values in the first
24 hours after admission to the ICU. The collection of
physiological data on admission only is probably logistically
easier, and this approach is used by some ICUs. This study
compares the performance of APACHE II scores calculated
using admission data with those obtained from the worst values
in the first 24 hours.
Materials and Methods This was a retrospective cohort study
using prospectively collected data from a tertiary ICU. There
were no missing physiological data and follow-up for mortality
was available for all patients in the database. The admission and
the worst 24-hour physiological variables were used to generate
the admission APACHE II score and the worst 24-hour
APACHE II score, and the corresponding predicted mortality,
respectively.
Results There were 11,107 noncardiac surgery ICU admissions
during 11 years from 1 January 1993 to 31 December 2003.
The mean admission and the worst 24-hour APACHE II score
were 12.7 and 15.4, and the derived predicted mortality
estimates were 15.5% and 19.3%, respectively. The actual
hospital mortality was 16.3%. The overall discrimination ability,
as measured by the area under the receiver operating
characteristic curve, of the admission APACHE II model
(83.8%, 95% confidence interval = 82.9–84.7) and the worst
24-hour APACHE II model (84.6%, 95% confidence interval =
83.7–85.5) was not significantly different (P = 1.00).
Conclusion Substitution of the worst 24-hour physiological
variables with the admission physiological variables to calculate
the admission APACHE II score maintains the overall
discrimination ability of the traditional APACHE II model. The
admission APACHE II model represents a potential alternative
model to the worst 24-hour APACHE II model in critically ill
nontrauma patients.
Introduction
Scoring systems such as Acute Physiology and Chronic
Health Evaluation (APACHE), the Therapeutic Intervention
Scoring System, and Mortality Probability Models (MPM) have
been developed and used as quality assurance tools and for
risk stratification in research involving critically ill patients [1,2].
APACHE = Acute Physiology and Chronic Health Evaluation; CI = confidence interval; ICU = intensive care unit; MPM = Mortality Probability Models;
SAPS = Simplified Acute Physiology Score.
Critical Care Vol 10 No 1 Ho et al.
Page 2 of 8
(page number not for citation purposes)
Each scoring system has its own strengths and weaknesses,
and the choice depends on the system's ease of use and
goodness of fit for that particular intensive care unit (ICU) or
patient group.
The traditional APACHE II model utilises the worst values of
12 physiological variables during the first 24 hours following
ICU admission, along with an evaluation of the patient's
chronic health and admission diagnosis to calculate the
APACHE II predicted mortality [3]. The APACHE II model has
been widely validated and used by many ICUs to classify the
severity of illness and to predict hospital mortality [2,4-7].
APACHE II has now been modified to APACHE III; however,
some studies have shown that APACHE III may underestimate
the number of deaths [8,9]. Although the APACHE II model is
quite old, and other scoring systems have been developed
using more recent cohorts, APACHE II is still widely used for
research and clinical audit purposes. APACHE II is easier to
use than APACHE III and has been in use for a long period,
which allows consistency [2,10].
A potential problem with these methods is that the worst 24-
hour physiological data used to derive APACHE II scores and
APACHE III scores can be treatment-dependent and therefore
it may reflect poor clinical management rather than sicker
patients [11-13]. Collection of the admission physiological
variables rather than the worst 24-hour physiological variables
is a standard practice in some ICUs to calculate the APACHE
II predicted mortality, and may theoretically overcome this
potential problem [14,15]. The use of only admission physio-
logical variables may make data collection easier as the data
collector does not need to peruse all the blood tests and phys-
iological variables over 24 hours to work out the worst score.
However, the performance of APACHE II scores using admis-
sion data has not been thoroughly assessed [3,16].
When the APACHE III scoring system was developed, the
effect of using admission physiological variables rather than
the worst 24-hour physiological variables was assessed. The
absolute difference between the mean scores, derived from
the admission and worst 24-hour physiological data, was not
statistically significantly different from zero [16]. However, the
proportion of missing values favoured the worst 24-hour val-
ues over the admission values, as did the maximum explana-
tory power. Some other scoring systems use only admission
data (MPM II
0
and Simplified Acute Physiology Score [SAPS]
III), and it is therefore established that scoring systems using
physiological data from the time of admission to the ICU can
provide valid assessment of the severity of illness and out-
come prediction [17,18].
In the present study we evaluated the performance of the
APACHE II model using physiological data at the time of ICU
admission with the model using data obtained from the worst
values in the first 24 hours.
Materials and methods
This was a retrospective cohort study that utilised prospec-
tively collected data. The study was conducted in the medical–
surgical ICU at Royal Perth Hospital, an 800-bed university
teaching hospital. The 22-bed ICU is a 'closed' ICU that
admits critically ill adult patients of all specialties and is staffed
by fully trained intensivists. The unit database contains de-
identified information for components of the APACHE II score
for physiological data collected at admission and for the worst
values in the first 24 hours – admission diagnosis and source,
age, ethnicity, ICU mortality and hospital mortality. The admis-
sion and the worst 24-hour physiological data were used to
generate the admission APACHE II score and the worst 24-
hour APACHE II score, respectively. The admission APACHE
II score and the worst 24-hour APACHE II score were then
used to calculate the admission APACHE II predicted mortal-
ity (admission APACHE II model) and the worst 24-hour pre-
dicted mortality (worst 24-hour APACHE II model), using the
published APACHE II mortality prediction equation coeffi-
cients [3].
The data were collected by the duty ICU consultant on paper
sheets and updated on a daily basis by the duty consultant
while the patient remained in the ICU. After the patient was
discharged from the ICU, the data were checked for transcrip-
tion errors and completeness by a designated trained clerical
staff member using data from the computerised laboratory
database, going through the ICU vital signs flow chart again
before the data were transferred to the computer. A total of 12
consultants were involved in collecting data, of which seven
were involved throughout the study period, using a standard-
ised data dictionary. The worst 24-hour APACHE II score was
determined precisely as described by Knaus and colleagues
[3].
Measurement of all 12 physiological variables on admission
and over the first 24 hours in the ICU was mandatory in the
APACHE data recording form. If the patient was anaesthe-
tised before ICU admission, the Glasgow coma score was
assessed using the available clinical information prior to
anaesthesia. Acute renal failure was defined as oliguria with
urine output less than 135 ml over a consecutive 8-hour period
with abnormal serum creatinine concentrations over 133
µmol/l. Other than the Glasgow coma score and urinary out-
put, pre-ICU physiological data were not used in the calcula-
tion of APACHE II scores. Arterial blood gas measurements
were judged to be inappropriate in some patients, and in these
patients the serum bicarbonate concentration was used to cal-
culate the physiological score [3]. One data custodian was
responsible for ensuring data quality throughout the study
period. The data were reviewed for internal consistency before
annual lockdown, and there were no patients with missing
physiological data or who were lost to mortality follow-up. The
study utilised de-identified data only and was deemed to be a
Available online />Page 3 of 8
(page number not for citation purposes)
'Clinical Audit' by the Hospital Ethics Committee and as such
the need for formal ethics committee approval was waived.
The performance of the admission APACHE II model in pre-
dicting hospital mortality was compared with the performance
of the worst 24-hour APACHE II model with respect to their
discrimination ability and calibration. Because the original
APACHE II prediction model did not include cardiac surgical
patients, we have included only the data from noncardiac sur-
gery ICU admissions. All patients in the database in the study
period were considered, including those patients who died
within 24 hours of ICU admission.
The discrimination ability of each of the scoring systems was
assessed by the area under the receiver operating character-
istic curve: above 90% was regarded as excellent, above 80%
was regarded as good, and below 80% was regarded as poor
in this study. Calibration was assessed by comparing absolute
observed mortality with predicted mortality in fixed risk strata
(for example 0–0.099, 0.1–0.199, and so on) using the Hos-
mer-Lemeshow chi-square H statistic. P < 0.05 in the Hos-
mer-Lemeshow chi-square H statistical test infers a significant
departure from the null hypothesis of good calibration. The
relationship between the admission APACHE II predicted hos-
pital mortality risk and the worst 24-hour APACHE II predicted
hospital mortality risk was assessed by the two-tailed Pearson
correlation coefficient. The ratio of total observed to predicted
mortality is the standardised mortality ratio (SMR).
The discrimination ability was further analysed for different
diagnostic and patient subgroups to test the uniformity of fit of
both models. The diagnostic subgroups analysed included
Table 1
Characteristics of the cohort
Variables Mean (SD)
Age (years) 53.5 (19.5)
Male/female (%) 6,871/4,236 (61.9/38.1)
Admission source (%)
Operating room 4,885 (44.0)
Recovery room 638 (5.7)
Emergency department 2,976 (26.8)
Ward 1,481 (13.3)
Another hospital 1,127 (10.1)
Primary organ failure (%)
Cardiovascular 3,693 (33.2)
Neurological 3,893 (35.0)
Respiratory 2,682 (24.1)
Gastrointestinal 401 (3.6)
Renal 167 (1.5)
Metabolic 217 (2.0)
Haematological 49 (0.4)
ICU stay (days) 5.1 (7.8)
Hospital stay (days) 21.1 (29.3)
Admission APACHE II score 12.7 (7.3)
Worst 24-hour APACHE II score 15.4 (7.9)
Admission APACHE predicted mortality (%) 15.5 (19.1)
Worst 24-hour APACHE predicted mortality (%) 19.3 (22.1)
Actual ICU mortality (%) 12.0
Actual hospital mortality (%) 16.3
All data in parentheses are standard deviations unless stated otherwise. APACHE, Acute Physiology and Chronic Health Evaluation; ICU,
intensive care unit; SD, standard deviation.
Critical Care Vol 10 No 1 Ho et al.
Page 4 of 8
(page number not for citation purposes)
patients with different major diagnoses such as sepsis, pneu-
monia, and gastrointestinal perforation or obstruction, intracra-
nial haemorrhage, multiple trauma, cardiac arrest, and elective
surgery. The patient subgroups analysed included aboriginal
patients, patients transferred from another hospital, patients
admitted to the ICU before or after early 1999, patients who
stayed in the ICU longer than 24 hours, and patients who sur-
vived longer than 24 hours of hospitalisation. P < 0.05 was
regarded as significant in all analyses and no adjustment was
made for multiple comparisons in the subgroup analyses. All
statistical analyses were performed by SPSS statistical soft-
ware (version 11.0 for Windows; SPSS Inc., Chicago, IL,
USA] and confidence intervals were generated by Confidence
Interval Analysis (version 2.0.0; BMJ 2000, UK).
Results
The time for collecting and checking the admission physiolog-
ical data manually required an average of 5 minutes per patient
(range, 3–7 minutes), and the average for the worst 24-hour
physiological data was 20 minutes per patient (range, 10–40
minutes). The time required to work out the worst 24-hour
APACHE II score was longer when more blood tests had been
performed for the patient.
There were 11,107 noncardiac surgery ICU admissions in the
11-year period from 1 January 1993 to 31 December 2003.
The characteristics of the ICU cohort are presented in Table 1.
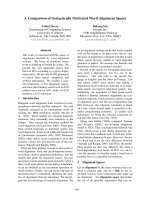
The difference in the admission APACHE II score and the
worst 24-hour APACHE II score was small in most patients
(Figure 1). The mean admission APACHE II score and the
worst 24-hour APACHE II scores were 12.7 and 15.4, and the
derived predicted hospital mortality estimates were 15.5%
and 19.3%, respectively. The admission APACHE II predicted
mortality and the worst 24-hour APACHE II predicted mortality
were closely correlated (Pearson correlation coefficient =
0.955, P = 0.0001). The actual hospital mortality was 16.3%.
The overall standardised mortality ratio was 1.05 (95% confi-
dence interval [CI] = 1.00–1.10) and was 0.84 (95% CI =
0.80–0.88) using the admission APACHE II predicted mortal-
ity and the worst 24-hour APACHE II predicted mortality as the
denominator, respectively.
The overall discrimination abilities, as measured by the area
under the receiver operating characteristic curve, of the admis-
sion APACHE II model (83.8%, 95% CI = 82.9–84.7) and the
worst 24-hour APACHE II model (84.6%, 95% CI = 83.7–
85.5) with the entire cohort were not significantly different (P
Table 2
The discriminating ability of the admission Acute Physiology and Chronic Health Evaluation (APACHE) II model and the worst 24-
hour APACHE II model to predict inhospital mortality in different diagnostic and patient subgroups
Different diagnostic and
patient subgroups
Number of
patients
Mean area under the ROC curve (%)
(95% confidence interval)
a
Standardised mortality ratio
(95% confidence interval)
Admission model Worst 24-hour model Admission model Worst 24-hour model
Sepsis, pneumonia,
gastrointestinal perforation
or obstruction
1,474 68.3 (65.4–71.3) 68.5 (65.6–71.4) 0.94 (0.90–0.98) 0.77 (0.75–0.80)
Intracranial, subdural or
subarachnoid haemorrhage
851 79.5 (76.3–82.7) 80.4 (77.2–83.5) 1.29 (1.22–1.36) 1.03 (0.98–1.08)
Multiple trauma 1,299 87.0 (84.1–89.9) 87.3 (84.4–90.1) 1.73 (1.63–1.84) 1.24 (1.17–1.31)
Cardiac arrest (nonoperative
or intraoperative)
395 73.9 (69.1–78.8) 73.9 (69.0–78.8) 0.92 (0.88–0.96) 0.82 (0.79–0.85)
Elective surgery (excluding
cardiac surgery)
3,012 78.6 (74.8–82.4) 80.8 (77.3–84.4) 1.04 (1.00–1.09) 0.79 (0.76–0.83)
Aboriginal patients 863 77.8 (74.2–81.4) 78.8 (75.2–82.3) 1.02 (0.95–1.09) 0.82 (0.77–0.87)
Patients transferred from
another hospital
1,127 79.4 (76.3–82.4) 80.4 (77.4–83.5) 0.87 (0.82–0.92) 0.71 (0.67–0.75)
Patients admitted between
1993 and early 1999
5,553 85.4 (84.0–86.7) 86.1 (84.8–87.4) 1.05 (1.01–1.09) 0.85 (0.82–0.88)
Patients admitted between
early 1999 and 2003
5,554 83.3 (82.0–84.5) 84.1 (82.8–85.3) 1.09 (1.06–1.13) 0.88 (0.86–0.91)
Patients stayed in the ICU
longer than 24 hours
8,461 80.4 (79.2–81.5) 81.2 (80.1–82.3) 0.99 (0.97–1.02) 0.79 (0.77–0.81)
Patients survived longer than
24 hours of hospitalisation
10,733 82.2 (81.1–83.2) 83.0 (82.0–84.0) 0.93 (0.91–0.95) 0.74 (0.73–0.76)
a
There was no significant difference in the areas under the receiver operating characteristic (ROC) curves between the admission APACHE II
model and the worst 24-hour APACHE II model (P = 1.00).
Available online />Page 5 of 8
(page number not for citation purposes)
= 1.00) (Figure 2). The discrimination abilities of the admission
APACHE II model and the worst 24-hour APACHE II model
were also not significantly different within all subgroups ana-
lysed (Table 2).
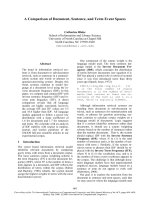
The Hosmer and Lemeshow goodness of fit chi-square H sta-
tistic was 66.7 for the admission APACHE II model and was
189.3 for the worst 24-hour APACHE II model indicating a
better fit for the admission APACHE II model but both P values
were very small (P < 0.0001). The calibration curve of the two
APACHE II models is displayed in Figure 3 and shows the bet-
ter fit of the admission APACHE II model especially in the high
risk strata. The overall correct classification rate (based on
classifying a patient to die if his/her predicted mortality risk
exceeded 50%) for the admission APACHE II model and the
worst 24-hour APACHE II model were both 85.4% (Table 3).
Discussion
The advantages of the admission APACHE II model
Our results showed that the performance of the admission
APACHE II model is no worse than the traditional worst 24-
hour APACHE II model when there are no significant missing
data. These results were consistent with the results of other
studies that assessed or utilised the admission APACHE II
score to calculate the APACHE II predicted mortality [15-17].
The use of the admission APACHE II score to calculate the
APACHE II predicted mortality (admission APACHE II model)
has a few potential advantages and may represent a viable
alternative to the traditional APACHE II model. First, it can
assess the risk of hospital death at ICU admission, as in the
MPM II
0
and SAPS III scoring systems that assess the risk of
hospital death at ICU admission [17,18]. The admission
APACHE II model also shares these systems' advantages of
ease of use, and, since they are independent of ICU treatment,
may be more applicable for risk stratification in clinical
research and triage decisions [19]. The ability of a scoring sys-
tem to stratify patient risk on admission to the ICU may
facilitate stratification of patients into trials that assess early
interventions in critically ill patients.
Second, the data collection for the admission APACHE II
model is less laborious than the worst 24-hour APACHE II
model, as demonstrated in our data. It may also reduce errors
because it does not require perusal of a series of values to
obtain the worst score. Nevertheless, this potential advantage
is important only when a computerised information system is
not available and the data are collected manually.
Third, the admission APACHE II model may be a better reflec-
tion of quality of care in the ICU because risk assessment
occurs before any ICU therapy is instituted [12-14].
Finally, poor calibration with the worst 24-hour APACHE II
model has been reported in many studies [20-22]. Our results
confirmed this problem of the worst 24-hour APACHE II
model, with the predicted mortality being much higher than the
actual mortality in the high-risk strata. The admission APACHE
II model appeared to have reduced the overestimation of mor-
tality in the high-risk strata and improved the calibration of the
APACHE II model in the present study. However, data on
calibration of the admission APACHE II model from other
studies are lacking [15-17] and further studies in other set-
tings will be needed to confirm this finding.
Figure 1
The difference in APACHE II scores using the admission and worst 24-hour physiological dataThe difference in APACHE II scores using the admission and worst 24-
hour physiological data. AP, Acute Physiology and Chronic Health
Evaluation.
Figure 2
The receiver operating characteristic (ROC) curves for the admission Acute Physiology and Chronic Health Evaluation (APACHE) II model and the worst 24-hour APACHE II model in predicting hospital mortalityThe receiver operating characteristic (ROC) curves for the admission
Acute Physiology and Chronic Health Evaluation (APACHE) II model
and the worst 24-hour APACHE II model in predicting hospital mortal-
ity. Area under ROC curves: worst 24-hour APACHE II model, 84.6%
(95% CI = 83.7–85.5); admission APACHE II model, 83.8% (95% CI
= 82.9–84.7). No significant difference between the two areas under
the ROC curves (P = 1.00).
Critical Care Vol 10 No 1 Ho et al.
Page 6 of 8
(page number not for citation purposes)
Limitations of the admission APACHE II model
The admission APACHE II model is a minor modification of the
worst 24-hour APACHE II model and retains many intrinsic
weaknesses and problems of the worst 24-hour APACHE II
model. These weaknesses include errors arising from impre-
cise principal diagnosis, lead time bias, and poor uniformity of
fit of the model. The admission APACHE II model, as with
other ICU scoring systems such as the APACHE III model,
needs an accurate diagnosis to accurately predict the hospital
mortality. The admission APACHE II model does not eliminate
this requirement.
The performance of the worst 24-hour APACHE II model is
affected by the source and timing of patient referral to the ICU,
and it tends to underestimate the mortality of the patients
referred from other ICUs or hospitals [23,24]. Our results were
different from these reports. This may be because many
patients were transferred from remote Western Australia and
were not fully resuscitated when they were admitted to the
ICU. The standardised mortality ratio of the patients trans-
ferred from other hospitals, based on the admission APACHE
II model in this study, was closer to unity than that of the worst
24-hour APACHE II model (Table 2). The admission APACHE
II model was associated with a lower lead time bias in this
study. The uniformity of fit in the discrimination ability of the
admission APACHE II model and the worst 24-hour APACHE
II model was similarly poor in patients with sepsis, pneumonia,
gastrointestinal perforation, and cardiac arrest, and also in the
aboriginal patients. Both the worst 24-hour APACHE II model
and the APACHE III model were not well calibrated in predict-
ing mortality in trauma patients [23,25,26]. Our results con-
firmed this problem of the worst 24-hour APACHE II model,
and the admission APACHE II model did not improve the per-
formance of the worst 24-hour APACHE II model in this sub-
group of patients.
Limitations of the study
This was a single-centre study and these results may not be
generalisable to other ICUs [23]. Our observation that the
standardised mortality ratio calculated with the admission
physiological variables was closer to unity than that calculated
with the worst 24-hour values may be different in other units.
Further evaluation of the admission APACHE II model in other
ICUs is essential.
Also, this study did not directly compare the admission
APACHE II model with other scoring systems that assess the
risk of hospital mortality at ICU admission such as the MPM II
0
Table 3
Classification table for the admission Acute Physiology and Chronic Health Evaluation (APACHE) II model and the worst 24-hour
APACHE II model to predict hospital mortality
Observed hospital mortality Predicted hospital mortality
No (n)Yes (n) % correct
Using the worst 24-hour APACHE II model
No 8,899 394 95.8
Yes 1,229 585 32.2
Overall percentage 85.4
Using the admission APACHE II model
No 8,966 327 96.5
Yes 1,293 521 28.7
Overall percentage 85.4
The cutoff value is 0.50.
Figure 3
Calibration curves for the admission Acute Physiology and Chronic Health Evaluation (APACHE) II score and the worst 24-hour APACHE II score in predicting hospital mortality across different risk strataCalibration curves for the admission Acute Physiology and Chronic
Health Evaluation (APACHE) II score and the worst 24-hour APACHE II
score in predicting hospital mortality across different risk strata. The
Hosmer-Lemeshow goodness of fit chi-square H statistic for the admis-
sion APACHE II predicted mortality and for the worst 24-hour APACHE
II predicted mortality were 66.9 and 189.3, respectively (both P <
0.0001).
Available online />Page 7 of 8
(page number not for citation purposes)
and SAPS III models [17,18]. Whether the performance of the
admission APACHE II model is comparable with these scoring
systems remains uncertain and will be further investigated.
Critical illness is a dynamic process and therefore outcome
prediction based on a single time point such as ICU admis-
sion, as in the admission APACHE II model, does not consider
changes in patients' clinical status over time and their
response to treatment. Serial predictions over a period of time,
as in the APACHE III model, may improve prediction accuracy
and clinical utilities, although acquiring these data continu-
ously will be difficult in practice [27,28].
Finally, the admission APACHE II model, as with most other
outcome prediction models, does not consider functional out-
comes beyond survival [9].
Conclusion
In conclusion, substituting the worst 24-hour physiological
variables with the admission physiological variables to calcu-
late the admission APACHE II score and the APACHE II pre-
dicted mortality does not result in significantly worse
calibration or discrimination compared with the traditional
APACHE II model. The admission APACHE II model
represents a potential alternative model to the worst 24-hour
APACHE II model in critically ill nontrauma patients.
Competing interests
The authors declare that they have no competing interests.
Authors' contributions
KMH performed the statistical analysis and drafted the manu-
script. GJD initiated the original idea of the study and helped
to draft the manuscript. MK, JF, and SARW helped analyse the
data and draft the manuscript. KYL was the data-collection
quality controller and helped to draft the manuscript. All
authors read and approved the final manuscript.
Acknowledgements
The authors would like to thank Dr Geoffrey Clarke and Dr John Weekes
for their part in initiating the Royal Perth Hospital ICU database, and
thank all ICU consultants who have been recording APACHE II data for
every admission to the ICU. This study was solely funded by the Depart-
ment of Intensive Care, Royal Perth Hospital.
References
1. Knaus WA: APACHE 1978–2001: the development of a quality
assurance system based on prognosis: milestones and per-
sonal reflections. Arch Surg 2002, 137:37-41.
2. Gunning K, Rowan K: ABC of intensive care: outcome data and
scoring systems. BMJ 1999, 319:241-244.
3. Knaus WA, Draper EA, Wagner DP, Zimmerman JE: APACHE II: a
severity of disease classification system. Crit Care Med 1985,
13:818-829.
4. Oh TE, Hutchinson R, Short S, Buckley T, Lin E, Leung D: Verifi-
cation of the Acute Physiology and Chronic Health Evaluation
scoring system in a Hong Kong intensive care unit. Crit Care
Med 1993, 21:698-705.
5. Livingston BM, MacKirdy FN, Howie JC, Jones R, Norrie JD:
Assessment of the performance of five intensive care scoring
models within a large Scottish database. Crit Care Med 2000,
28:1820-1827.
6. Breen D, Churches T, Hawker F, Torzillo PJ: Acute respiratory
failure secondary to chronic obstructive pulmonary disease
treated in the intensive care unit: a long term follow up study.
Thorax 2002, 57:29-33.
7. Rowan KM, Kerr JH, Major E, McPherson K, Short A, Vessey MP:
Intensive Care Society's Acute Physiology and Chronic Health
Evaluation (APACHE II) study in Britain and Ireland: a prospec-
tive, multicenter, cohort study comparing two methods for pre-
dicting outcome for adult intensive care patients. Crit Care
Med 1994, 22:1392-1401.
8. Buist M, Gould T, Hagley S, Webb R: An analysis of excess mor-
tality not predicted to occur by APACHE III in an Australian
level III intensive care unit. Anaesth Intensive Care 2000,
28:171-177.
9. Angus DC: Scoring system fatigue and the search for a way
forward. Crit Care Med 2000, 28:2145-2146.
10. Konarzewski W: Continuing to use APACHE II scores ensures
consistency. BMJ 2000, 321:383-384.
11. Shann F: Mortality prediction model is preferable to APACHE.
BMJ 2000, 320:714.
12. Boyd O, Grounds RM: Physiological scoring systems and audit.
Lancet 1993, 341:1573-1574.
13. Knaus W, Draper E, Wagner D: APACHE III study design: ana-
lytic plan for evaluation of severity and outcome in intensive
care unit patients. Introduction. Crit Care Med 1989,
17:S176-S180.
14. Khilnani G, Banga A, Sharma S: Predictors of mortality of
patients with acute respiratory failure secondary to chronic
obstructive pulmonary disease admitted to an intensive care
unit: a one year study. BMC Pulm Med 2004, 4:12. it is a full arti-
cle but no page span because it does not have printed version,
only Internet version
15. Goel A, Pinckney RG, Littenberg B: APACHE II predicts long-
term survival in COPD patients admitted to a general medical
ward. J Gen Intern Med 2003, 18:824-830.
16. Knaus WA, Wagner DP, Draper EA, Zimmerman JE, Bergner M,
Bastos PG, Sirio CA, Murphy DJ, Lotring T, Damiano A, et al.:
APACHE III prognostic system. Risk prediction of hospital
mortality for critically ill hospitalized adults. Chest 1991,
100:1619-1636.
17. Metnitz PG, Moreno RP, Almeida E, Jordan B, Bauer P, Campos
RA, Iapichino G, Edbrooke D, Capuzzo M, Le Gall JR, on behalf of
the SAPS 3 Investigators: SAPS 3-From evaluation of the
patient to evaluation of the intensive care unit. Part 1: Objec-
tives, methods and cohort description. Intensive Care Med
2005, 31:1336-1344.
18. Lemeshow S, Teres D, Klar J, Avrunin JS, Gehlbach SH, Rapoport
J: Mortality Probability Models (MPM II) based on an interna-
tional cohort of intensive care unit patients. JAMA 1993,
270:2478-2486.
19. Joynt GM, Gomersall CD, Tan P, Lee A, Cheng CA, Wong EL: Pro-
spective evaluation of patients refused admission to an inten-
sive care unit: triage, futility and outcome. Intensive Care Med
2001, 27:1459-1465.
20. Carson SS, Bach PB: Predicting mortality in patients suffering
from prolonged critical illness: an assessment of four severity-
of-illness measures. Chest 2001, 120:928-933.
Key messages
• Modifying the APACHE II model using admission physi-
ological variables instead of worst 24-hour physiological
variables to calculate the APACHE II score and pre-
dicted mortality (admission APACHE II model) does not
result in significantly worse calibration and discrimina-
tion compared with the traditional APACHE II model in
critically ill nontrauma patients.
Critical Care Vol 10 No 1 Ho et al.
Page 8 of 8
(page number not for citation purposes)
21. Tan IK: APACHE II and SAPS II are poorly calibrated in a Hong
Kong intensive care unit. Ann Acad Med Singapore 1998,
27:318-322.
22. Arabi Y, Al Shirawi N, Memish Z, Venkatesh S, Al-Shimemeri A:
Assessment of six mortality prediction models in patients
admitted with severe sepsis and septic shock to the intensive
care unit: a prospective cohort study. Crit Care 2003,
7:R116-R122.
23. Cowen JS, Kelly MA: Errors and bias in using predictive scoring
systems. Crit Care Clin 1994, 10:53-72.
24. Combes A, Luyt CE, Trouillet JL, Chastre J, Gibert C: Adverse
effect on a referral intensive care unit's performance of
accepting patients transferred from another intensive care
unit. Crit Care Med 2005, 33:705-710.
25. Zimmerman JE, Wagner DP, Draper EA, Wright L, Alzola C, Knaus
WA: Evaluation of acute physiology and chronic health evalu-
ation III predictions of hospital mortality in an independent
database. Crit Care Med 1998, 26:1317-1326.
26. Chawda MN, Hildebrand F, Pape HC, Giannoudis PV: Predicting
outcome after multiple trauma: which scoring system? Injury
2004, 35:347-358.
27. Afessa B, Keegan MT, Mohammad Z, Finkielman JD, Peters SG:
Identifying potentially ineffective care in the sickest critically ill
patients on the third ICU day. Chest 2004, 126:1905-1909.
28. Wagner DP, Knaus WA, Harrell FE, Zimmerman JE, Watts C: Daily
prognostic estimates for critically ill adults in intensive care
units: results from a prospective, multicenter, inception cohort
analysis. Crit Care Med 1994, 22:1359-1372.