Báo cáo khoa học: " A Process monitoring in intensive care with the use of cumulative expected minus observed mortality and risk-adjusted p charts" ppt
Bạn đang xem bản rút gọn của tài liệu. Xem và tải ngay bản đầy đủ của tài liệu tại đây (358.76 KB, 9 trang )
Open Access
Available online />Page 1 of 9
(page number not for citation purposes)
Vol 10 No 1
Research
Process monitoring in intensive care with the use of cumulative
expected minus observed mortality and risk-adjusted p charts
Jerome GL Cockings
1
, David A Cook
2
and Rehana K Iqbal
3
1
Department of Intensive Care Medicine, Royal Berkshire Hospital, Reading, Berkshire RG1 5AN, UK
2
Intensive Care Unit, Princess Alexandra Hospital, Brisbane, Queensland, Australia Ipswich Road, Wooloongabba, Brisbane QLD, 4000, Australia
3
Department of Intensive Care Medicine, Royal Berkshire Hospital, Reading, Berkshire RG1 5AN, UK
Corresponding author: Jerome GL Cockings,
Received: 30 Aug 2005 Revisions requested: 13 Oct 2005 Revisions received: 7 Dec 2005 Accepted: 18 Jan 2006 Published: 14 Feb 2006
Critical Care 2006, 10:R28 (doi:10.1186/cc3996)
This article is online at: />© 2006 Cockings et al.; licensee BioMed Central Ltd.
This is an open access article distributed under the terms of the Creative Commons Attribution License ( />),
which permits unrestricted use, distribution, and reproduction in any medium, provided the original work is properly cited.
Abstract
Introduction A health care system is a complex adaptive
system. The effect of a single intervention, incorporated into a
complex clinical environment, may be different from that
expected. A national database such as the Intensive Care
National Audit & Research Centre (ICNARC) Case Mix
Programme in the UK represents a centralised monitoring,
surveillance and reporting system for retrospective quality and
comparative audit. This can be supplemented with real-time
process monitoring at a local level for continuous process
improvement, allowing early detection of the impact of both
unplanned and deliberately imposed changes in the clinical
environment.
Methods Demographic and UK Acute Physiology and Chronic
Health Evaluation II (APACHE II) data were prospectively
collected on all patients admitted to a UK regional hospital
between 1 January 2003 and 30 June 2004 in accordance with
the ICNARC Case Mix Programme. We present a cumulative
expected minus observed (E-O) plot and the risk-adjusted p
chart as methods of continuous process monitoring. We
describe the construction and interpretation of these charts and
show how they can be used to detect planned or unplanned
organisational process changes affecting mortality outcomes.
Results Five hundred and eighty-nine adult patients were
included. The overall death rate was 0.78 of predicted.
Calibration showed excess survival in ranges above 30% risk of
death. The E-O plot confirmed a survival above that predicted.
Small transient variations were seen in the slope that could
represent random effects, or real but transient changes in the
quality of care. The risk-adjusted p chart showed several
observations below the 2 SD control limits of the expected
mortality rate. These plots provide rapid analysis of risk-adjusted
performance suitable for local application and interpretation.
The E-O chart provided rapid easily visible feedback of changes
in risk-adjusted mortality, while the risk-adjusted p chart allowed
statistical evaluation.
Conclusion Local analysis of risk-adjusted mortality data with an
E-O plot and a risk-adjusted p chart is feasible and allows the
rapid detection of changes in risk-adjusted outcome of intensive
care patients. This complements the centralised national
database, which is more archival and comparative in nature.
Introduction
A contemporary model of a health care system is that of a com-
plex adaptive system [1] with multiple nested interconnected
parts that evolve, interact and adapt over time. During an epi-
sode of care, the quality of care delivered by the system results
from an interaction between the patient and all interrelated
parts of the system. All changes made within the system will
affect all patients, to a greater or lesser extent. Isolated analy-
ses may not be informative, as changes planned for beneficial,
direct consequences may trigger indirect, adaptive effects that
can be detrimental overall. Constraints of rationing and redis-
tribution of scarce resources, the paucity of rigorous examina-
tion of critical care practice and the adaptive and emergent
features of a complex interactive system undermines the logic
of expecting the application of pockets of experimental evi-
dence to lead naturally to improved outcomes for all patients.
It is therefore not enough to incorporate the best empirical
practice conscientiously into each step in the patient encoun-
APACHE II = Acute Physiology and Chronic Health Evaluation version II; CMP = Case Mix Programme; CUSUM = cumulative sum; E-O = expected
minus observed; ICNARC = Intensive Care National Audit & Research Centre; ICU = intensive care unit; RBH = Royal Berkshire Hospital; SMR =
standardised mortality ratio.
Critical Care Vol 10 No 1 Cockings et al.
Page 2 of 9
(page number not for citation purposes)
ter. It is important that evidence-based practice must incorpo-
rate evidence of benefit in the context of the particular health
care environment of interest, and that a global measure of effi-
cacy be employed.
It is difficult to measure the quality of an intensive care service.
Death statistics are potentially misleading and are not indica-
tive of just the quality of the system: there are influences of
patient numbers, severity of illness and diagnosis. It is desira-
ble to control for confounding factors, and several domains
have consistent and reproducible associations with risk of
death [2]. In critical illness, these domains are the patient's
severity of acute disturbance (captured by physiological
observations and laboratory investigations), physiological
reserve (captured by age and co-morbidities), the diagnosis or
procedure, and also less influential variables such as lead-
time, emergency status and referral source. This relationship is
not purely deterministic because random effects and unmeas-
ured factors, such as the effect of the quality of the process of
care, contribute to outcome for an individual patient [3].
A validated model that accurately estimates the probability of
patient death such as the UK Acute Physiology and Chronic
Health Evaluation II (APACHE) II system can be used to con-
trol for severity of illness and case mix [4,5]. Such systems will
be familiar to critical care clinicians. Potentially, the effects on
mortality of both random effects and unmeasured factors
(such as the quality of care) can be teased out. By continuous
real-time comparison of the predicted and observed out-
comes, the process of care can be monitored with regard to
whether the risk-adjusted mortality equals, exceeds or falls
below the expectation of the model. The validated external
model is analogous to 'in-control' specifications of an industrial
process. In the UK a centralised national database, the Inten-
sive Care National Audit & Research Centre (ICNARC) Case
Mix Programme (CMP), operates from a central hub that
issues reports based on pooled and collected data. There are
delays inherent in data collation from multiple other sites, and
centrally generated reports can return months after the collec-
tion period, making them of archival, rather than formative,
value.
Grigg and Farewell [6] have reviewed risk-adjusted charts.
Plots of the cumulative difference between expected and
observed outcomes (E-O plots) provide a qualitative and intu-
itive representation of accumulating patient data, and methods
of incorporating control limits have been described [7,8]. Risk-
adjusted p charts lack the power to detect small changes in
performance, do not accumulate evidence over time, are vul-
nerable to the effects of multiple testing, and have an obligate
delay to finalise a sample period (that is, a month of data)
before an alert can be recognised, irrespective of the magni-
tude of the difference between observed and predicted out-
comes. However, risk-adjusted p charts complement the
expected minus observed (E-O) plot and are simple to con-
struct and explain. With relatively common event rates and
adequate patient numbers, they may have a performance that
approaches the risk-adjusted sequential techniques. Risk-
adjusted CUSUM (cumulative sum) charts, such as the charts
by Steiner and colleagues. [9] and the resetting probability
ratio test charts [10] and the Sets method [11], can be more
sensitive for detecting differences in performance. Arguably,
these can be more difficult to design for the optimal detection
of changes with an acceptable false alarm rate, and they can
be difficult to explain to managers, clinicians and non-statisti-
cians.
The purpose of this paper is to evaluate a simple method of
local outcome analysis to supplement the ongoing central
reporting system. We have selected the E-O chart and the
risk-adjusted p chart mortality as techniques that are easy to
apply and that track differences between predicted and
observed outcomes. These combine a rapidly responsive,
qualitative evaluation with a robust statistical evaluation. We
use these alongside the familiar standardised mortality ratio
(SMR) chart and comment on how this local approach com-
plements the central collation and reporting paradigm of out-
come monitoring from a national, centralised database.
Materials and methods
All patient episodes at a regional intensive care unit (Royal
Berkshire Hospital (RBH), Reading, UK) from 1 January 2003
and 30 June 2004 were studied under local ethics committee
approval. Data were collected prospectively in accordance
with the ICNARC CMP [4,5,12-14]. Clinical, demographical
and physiological data were collected on admission and dur-
ing the first 24 hours in intensive care. The probability of mor-
tality was calculated with the APACHE II system [15] but
using a model optimised for the UK population, the UK
APACHE II [4,13,14]. Data were collected in accordance with
the ICNARC CMP, a national comparative audit of intensive
care outcome. More details of the CMP have been described
elsewhere [5,12] and can be found on the ICNARC website
[16]. The endpoint was survival status at discharge from RBH.
In accordance with the national ICNARC CMP dataset
(ICMPDS version 2) [5], episodes were excluded for patients
less than 16 years old, for intensive care unit (ICU) admissions
lasting less than eight hours, admissions for primary burns,
admissions after coronary artery bypass grafting, transfers in
from another ICU, readmissions within the same hospital stay
or admissions lacking all 12 physiological variables. Data were
collected with a Clinical Information System (Eclipsys Tech-
nologies Corporation, Boca Raton, FL, USA). The ICNARC
data subset was then extracted from this with a specially
developed database program (Wardwatcher; Critical Audit,
London, UK). All data were verified by a trained data collection
nurse and diagnoses were checked by two doctors, one of
whom was an intensive care physician. A random sample of
5% of patients' physiological and clinical data were extracted
Available online />Page 3 of 9
(page number not for citation purposes)
and independently verified. All patients were followed up until
death or hospital discharge.
Model fit was assessed with a calibration curve, and model
discrimination was measured by the area under the receiver
operating characteristic curve, approximated by the trapezoi-
dal method and estimation of 95% confidence intervals
[17,18].
The cumulative E-O mortality chart uses patients indexed by
order of admission to the ICU. A mathematical description is
provided in Additional file 1. It has been described previously
as a variable life adjusted display (VLAD) [19] and a cumula-
tive risk adjusted mortality (CRAM) chart [7]. For each patient
the probability of in-hospital death was estimated, and in-hos-
pital outcome (0 for a hospital survivor, 1 for an in-hospital
death) was recorded. The estimates of probability of death
minus the observed outcomes were then accumulated for
sequential admissions. The cumulative difference between the
expected and observed number of deaths is displayed on the
y-axis, for the sequence of patients. The x-axis displays
sequential patient admissions, although the date of ICU admis-
sion is used on the label for ease of interpretation.
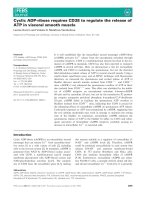
The risk-adjusted p chart [20] is a control chart plotting the
observed mortality rate and expected mortality rate in groups
of patients. It is presented in detail in Additional file 1. In this
case we have chosen 2 units of the estimated SD above and
below the expected mortality rate as the upper and lower con-
trol limits. A single, independent, observation outside the con-
trol limits will occur by chance about 5% of the time. Figure 1
shows the risk-adjusted p chart of blocks of 30 consecutive
Figure 1
Risk-adjusted p chart by blocks of 30 patientsRisk-adjusted p chart by blocks of 30 patients. Probability of death estimated with UK APACHE, Royal Berkshire Hospital, 1 January 2003 to 30
June 2004.
Figure 2
Risk-adjusted p Chart by monthRisk-adjusted p Chart by month. Probability of death estimated with UK APACHE, Royal Berkshire Hospital, 1 January 2003 to 30 June 2004.
Critical Care Vol 10 No 1 Cockings et al.
Page 4 of 9
(page number not for citation purposes)
patients. Figure 2 presents the same data but with the patients
grouped into monthly blocks of variable sizes, as caseload var-
ies from month to month.
SMRs were calculated with 95% confidence intervals [21]
from samples of three months of cases, using observed mor-
tality rate divided by the mean expected risk of death.
Results
Patients excluded from scoring in accordance with the UK
APACHE II system rules are given in Table 1, comparing RBH
ICU and the ICNARC CMP data for 2003. Characteristics of
the patient sample are given in Table 2, with the ICNARC data
for 2003 for comparison. The RBH mean APACHE II score
was 20.8; the observed hospital mortality rate during the study
period was 28.9% overall, and 26% for those included for
severity scoring. The predicted mortality rate was 33.5%
(SMR 0.78).
The calibration curve is displayed in Figure 3, showing an over-
estimate of risk of death in patient risk ranges above 30%. A
histogram of patient numbers in each of the risk of death
ranges (Figure 4) shows that most of the patients were in the
lower ranges, below 30% predicted mortality. The area under
the receiver operating characteristic curve for our data is 0.78
(95% confidence interval 0.74 to 0.82). Although the case mix
is similar to that of the ICNARC dataset, the UK APACHE II
model overestimates patient risk of death for the RBH patient
population, notably in patients with a higher risk of death.
Figure 5 is the cumulative E-O plot for the series of admis-
sions. Generally, there is a positive gradient, supporting the
observation that the UK APACHE II predictions consistently
overestimate the risk of death, although some variations in the
slope are observed. These variations represent either random
fluctuations in the charting process or real but transient
changes in the quality of care.
The risk-adjusted p charts (Figures 1 and 2) show that for
some periods the observed mortality rate was below the lower
2 SD control limit. The mortality rates observed in the blocks
of 30 patients numbered 3, 4, 8, 10 and 15 were all below the
lower control limits. Figure 2, presenting monthly data, shows
that in March 2003, October 2003 and February 2004 the
observed mortality rate was below the 2 SD control limits.
Even accounting for multiple testing this is very likely to repre-
sent a patient mortality rate below that predicted.
Figure 6 shows SMRs for each quarter, with 95% confidence
intervals. In all quarters, the value of the SMR fell below 1, and
Table 1
Comparison of patients excluded from scoring between patients in CMP UK database and those admitted to the RBH
Parameter CMP database, Jan to Dec 2003 RBH, Jan 2003 to Jun 2004
Number % Number %
Total number of admissions 55,936 100.00 731 100.00
Age at admission <16 years 978 1.75 17 2.33
Length of stay in unit <8 hours 3,636 6.50 39 5.34
Admission for primary burns 121 0.22 0 0.00
Admission after coronary artery bypass grafting 36 0.06 0 0.00
Readmission within the same hospital stay 2,911 5.20 34 4.65
Transferred in from another critical care unit 1,836 3.28 27 3.69
Missing all 12 physiological variables 1,488 2.66 26 3.56
Total number included for scoring 44,930 80.32 588 80.44
CMP, Case Mix Programme; RBH, Royal Berkshire Hospital.
Figure 3
Calibration curve of the UK APACHE II Model at the Royal Berkshire Hospital, 1 January 2003 to 30 June 2004Calibration curve of the UK APACHE II Model at the Royal Berkshire
Hospital, 1 January 2003 to 30 June 2004.
Available online />Page 5 of 9
(page number not for citation purposes)
in three of the six quarters the upper 95% confidence interval
did not extend to 1.
Discussion
This report presents an example of a monitoring paradigm in
which local performance is compared with an ICU cohort with
the use of a validated risk adjustment model. The UK APACHE
II model has been validated across the UK population
[13,14,22]. This represents an external performance bench-
mark and is analogous to an 'in-control' performance specifi-
cation.
The number of deaths observed was less than that predicted
by the UK APACHE II model. Nationally, in ICUs participating
in the ICNARC CMP, the UK APACHE II model underesti-
mates mortality (SMR 1.11 for 2003), while overestimating it
in our institution over a similar period and with a similar case
mix (SMR 0.78) (Tables 1 and 2). Differences in ICU model
performance between sites have been attributed to imperfect
model generalisation and to differences in model performance
arising from different interpretations of the model rules, varying
data collection methods [23,24], variations in case mix [25-
29] and organisational factors [30]. The overall difference
between the predicted and observed mortality is likely to be
due to a combination of several factors.
Risk-adjusted control charts are not new to health care, but
they are not used widely in intensive care medicine. Lovegrove
and colleagues. [19] and Poloniecki and colleagues. [7]
described the monitoring of outcome from cardiac surgery
with the use of risk-adjusted control charting, and subsequent
publications have provided further examples in cardiac surgery
[9,10,31-33], heart and lung transplantation [34] and myocar-
dial infarction [8,35].
In the critical care literature there have been few examples of
control charts. Chamberlin and colleagues. [36] reported
tracking the severity of illness rather than the outcomes of ICU
care. Cook and colleagues. [20] described the risk-adjusted p
charts and an application of the risk-adjusted CUSUM in an
Australian ICU, using the APACHE III model as a risk adjust-
ment tool. Improvement in performance was temporally related
Table 2
Comparison between CMP UK database and admissions to RBH ICU
Parameter CMP database, Jan to Dec 2003 RBH, Jan 2003 to Jun 2004
n Value n Value
Case mix
Age, years (mean ± SD) 55,936 60 ± 19.3 731 57 ± 20.4
Median age, years 55,936 64 731 62
Gender male, % 32,035 57.3 731 54.7
APACHE II
APACHE II score (mean ± SD) 45,099 16.7 ± 7.4 589 20.8 ± 8.3
UK mortality probability, % (mean ± SD) 45,099 26.3 ± 22.2 589 33.5 ± 26.1
Median UK mortality probability 45,099 19.1 589 25.8
Surgical status, % 55,936 100 731 100
Nonsurgical, % 30,545 54.6 450 61.6
Elective/scheduled surgery, % 13,825 24.7 168 23
Emergency/urgent surgery, % 11,494 20.5 113 15.5
'Surgery, unknown classification', % 72 0.1 0 0
Outcome
Mortality, all patients, % 45,099 27.7 731 28.9
Mortality, included for scoring
a
, % 53,464 29.3 589 26.0
Standardised mortality ratio 1.11 0.78
Activity
Median length of stay (days) 55,936 2.11 731 1.8
a
in accordance with the ICNARC Casemix programme
APACHE, Acute Physiology and Chronic Health Evaluation; CMP, Case Mix Programme; ICU, intensive care unit; RBH, Royal Berkshire Hospital.
Critical Care Vol 10 No 1 Cockings et al.
Page 6 of 9
(page number not for citation purposes)
to increased senior staffing levels and enhanced ongoing
interdisciplinary review of practice, quality improvement and
educational activities.
Risk-adjusted control charts can track differences between
expected and observed performance. In this illustration, the
UK APACHE II model overpredicted the risk of death to some
extent during the 18-month period of analysis. This is apparent
from the upward slope on the qualitative E-O chart. The risk-
adjusted p chart strongly suggests that the observed mortality
rates of blocks of 30 patients and the mortality rates for
months of variable case load were often significantly less than
the predicted mortality rate. This observation is supported by
the conventional quarterly SMR analysis.
Local prospective monitoring has recently been advocated in
medicine [37]. It is a fundamentally different view of quality
measurement from that which relies on a central assessment
and a retrospective reporting paradigm. There is little evidence
that a geographically distant and temporally isolated analysis
is an effective impetus to drive quality and positive change.
The advantage of this risk-adjusted chart analysis is that an
ICU such as the RBH ICU can continuously monitor perform-
ance locally. Although we demonstrated neither a lasting dete-
rioration nor an improvement, analysis did recognise variations
from a benchmark performance level. Where prospective mon-
itoring of risk-adjusted mortality shows a persistent and real
change, management and clinicians are well placed to
respond rapidly with suitable investigation and corrective strat-
egies if necessary. Delays in recognition are imposed by the
delays inherent in a system of central collation and may cause
a clinical opportunity for recognition to be lost. The use of
techniques such as the E-O chart and the risk-adjusted p chart
can minimise delays between data collection and formative
analysis.
Where the risk adjustment model consistently underestimates
or overestimates the risk of death, it can be difficult to make
any assumptions about changes over time. It is desirable
(where there are adequate patient data) to locally validate or
recalibrate the estimates of risk of death. Using a simple logis-
tic regression model, with the observed outcome as the inde-
pendent variable and the UK APACHE II estimate as the
dependent variable, we recalibrated the UK APACHE II model
for RBH. After we plotted the charts again, there was no evi-
dence of change in risk-adjusted outcome at RBH ICU over
the period of analysis.
Figure 4
Histogram of patients in risk of death ranges: UK APACHE, Royal Berk-shire Hospital, 1 January 2003 to 30 June 2004Histogram of patients in risk of death ranges: UK APACHE, Royal Berk-
shire Hospital, 1 January 2003 to 30 June 2004.
Figure 5
Cumulative expected minus observed mortality chartCumulative expected minus observed mortality chart. Probability of death estimated with UK APACHE, Royal Berkshire Hospital, 1 January 2003 to
30 June 2004.
Available online />Page 7 of 9
(page number not for citation purposes)
The E-O chart provides a simple, continuously updateable,
qualitative display of the effects on risk-adjusted mortality of
the whole health care process surrounding intensive care
admissions. However, care must be taken not to overinterpret
the E-O chart because fluctuations can represent random var-
iations, or real but transient and reversible changes in the qual-
ity of care. In either case, tampering could produce more
undesirable effects within the system. However, a persistent
change in the slope of the E-O chart should prompt a statisti-
cal evaluation of the significance of impressions gained. The
response time can be improved if 30-day survival is used
instead of in-hospital survival [2].
Where a deficiency has been recognised and corrected or an
initiative has improved patient outcomes, contemporaneous
monitoring would be able to provide additional evidence for
the effectiveness of the corrective strategy.
The E-O chart and the risk-adjusted p chart are presented in
preference to the more technically demanding formal sequen-
tial tests such as adaptations of the CUSUM [7,32,38], other
sequential probability ratio tests [10] and the Sets method
[11], which have also been proposed for analysis of risk-
adjusted data in a medical context. These sequential methods
are more sensitive to changes in patient outcome [6]. How-
ever, we perceive a barrier to their local adoption by hospitals
because of the complexity of analysis, unfamiliarity among cli-
nicians and managers and difficulty in translating to clinical
practice. The E-O chart offers a rapid and qualitative plot. The
risk-adjusted p chart offers an easy formal statistical test, com-
paring the observed and the predicted mortality rate for each
sample period.
We present a technique for real-time risk-adjusted analysis
that has proved useful in the analysis of local performance in a
large district hospital ICU. We have presented this as a prac-
tical response to the need to adopt a local responsibility for
our unit's process. This is in contrast to, but complements, a
centralised surveillance strategy. We have used the data col-
lected for central analysis, and analysed it in a way that pro-
vided local formative ICU assessment of mortality rate
performance. This approach poses little additional burden in
cost and infrastructure.
Conclusion
We present a simple risk-adjusted approach to outcome mon-
itoring to allow the rapid detection of unplanned systematic
changes affecting patient outcomes. We also offer this as a
method of tracking the effect of a deliberately imposed change
on patient survival, such as may be imposed by changing staff
pattern, resources, or the deliberate application of therapy
advocated by randomised trials from elsewhere. This comple-
ments a centralised national audit and reporting system that
provides valuable archival and comparative data but not the
contemporaneous analysis necessary for timely formative use.
We monitor the global quality of the service with respect to
hospital survival offered by this regional ICU, benchmarking
against national UK standards.
Competing interests
The authors declare that they have no competing interests.
Authors' contributions
JC was responsible for the conception of the study, data
acquisition and verification and drafting the manuscript. DC
Figure 6
Standardised mortality ratios by quarter, with 95% confidence intervalsStandardised mortality ratios by quarter, with 95% confidence intervals. Probability of death estimated with UK APACHE, Royal Berkshire Hospital,
1 January 2003 to 30 June 2004
Critical Care Vol 10 No 1 Cockings et al.
Page 8 of 9
(page number not for citation purposes)
preformed the statistical analysis and was responsible for the
conception of the study and the drafting of the manuscript. RI
was responsible for the conception of the study and for data
acquisition and verification of the data. All authors read and
approved the final manuscript.
Additional files
References
1. Marsland S, Buchan IM: Clinical quality needs complex adaptive
systems and machine learning. Medinfo 2004, 11(Part
1):644-647.
2. Graham P, Cook D: Risk prediction using 30 day outcome: a
practical endpoint for quality audit. Chest 2004,
125:1458-1466.
3. Iezzoni L: Dimensions of risk. In Risk Adjustment for Measuring
Health Care Outcomes Edited by: Iezzoni L Chicago. IL: Health
Administration Press; 1994:29-118.
4. Rowan K: Outcome comparisons of intensive care units in
Great Britain and Ireland using the APACHE II method. In Phd
thesis University of Oxford; 1992.
5. Harrison DA, Brady AR, Rowan K: Case mix, outcome and length
of stay for admissions to adult, general critical care units in
England, Wales and Northern Ireland: the Intensive Care
National Audit & Research Centre Case Mix Programme Data-
base. Crit Care 2004, 8:R99-R111.
6. Grigg OA, Farewell VT: An overview of risk adjusted charts. J R
Stat Soc A 2004, 167:523-539.
7. Poloniecki J, Valencia O, Littlejohns P: Cumulative risk adjusted
mortality chart for detecting changes in death rate: observa-
tional study of heart surgery. BMJ 1998, 316:1697-1700.
8. Sherlaw-Johnson C, Morton A, Robinson MB, Hall A: Real-time
monitoring of coronary care mortality: a comparison and com-
bination of two monitoring tools. Int J Cardiol 2005,
100:301-307.
9. Steiner S, Cook R, Farewell V, Treasure T: Monitoring surgical
performance using risk-adjusted cumulative sum charts.
Biostatistics 2000, 1:441-452.
10. Spiegelhalter D, Grigg O, Kinsman R, Treasure T: Risk adjusted
sequential probability ratio tests: applications to Bristol, Ship-
mann and adult cardiac surgery. Int J Qual Health Care 2003,
15:7-13.
11. Grigg OA, Farewell VT: A risk-adjusted Sets method for moni-
toring adverse outcomes. Stat Med 2004, 23:1593-1602.
12. Young D: Development and testing of a hierarchical method to
code the reason for admission to intensive care units: the ICN-
ARC Coding Method. Br J Anaesth 2001, 87:543-548.
13. Rowan K, Kerr J, Major E, McPherson K, Short A, Vessey M: Inten-
sive Care Society's APACHE II study in Britain and Ireland – I.
Variations in casemix of adult admissions to general ICUs and
impact on outcome. BMJ 1993, 307:972-977.
14. Rowan K, Kerr J, Major E, McPherson K, Short A, Vessey M: Inten-
sive Care Society's APACHE II study in Britain and Ireland – II.
Outcome comparisons of ICUs after adjustments for casemix
by the American APACHE II method. BMJ 1993, 307:977-981.
15. Knaus WA, Draper EA, Wagner DP, Zimmerman JE: APACHE II: a
severity of disease classification system. Crit Care Med 1985,
13:818-829.
16. ICNARC Case Mix Programme [ />cmp/]
17. Hanley JA, McNeil BJ: The meaning and use of a ROC curve.
Radiology 1982, 143:29-36.
18. Hanley JA, McNeil BJ: A method of comparing the areas under
the ROC curves derived from the same cases. Radiology 1983,
148:839-843.
19. Lovegrove J, Valencia O, Treasure T, Sherlaw-Johnson C, Gallivan
S: Monitoring the results of cardiac surgery by variable life-
adjusted display. Lancet 1997, 350:1128-1130.
20. Cook D, Steiner S, Cook R, Farewell V, Morton A: Monitoring the
evolutionary process of quality: Risk adjusted charting to track
outcomes in intensive care. Crit Care Med 2003,
31:1676-1682.
21. Sherlaw-Johnson C, Gallivan S: Approximating Prediction Inter-
vals for Use in Variable Life Adjusted Displays Technical Note:
Clinical Operational Research Unit, Department of Mathematics,
University College, London; 2000:563.
22. Rowan KM, Kerr JH, Major E, McPherson K, Short A, Vessey MP:
Intensive Care Society's APACHE II study in Britain and Ire-
land: a prospective, multi-center, cohort study comparing two
methods for predicting outcome for adult intensive care
patients. Crit Care Med 1994, 22:1392-1401.
23. Bosman RJ, Oudemans van Straaten HM, Zandstra DF: The use
of intensive care information systems alters outcome predic-
tion. Intensive Care Med 1998, 24:953-958.
24. Chen LM, Martin CM, Morrison TL, Sibbald WJ: Interobserver
variability in data collection of the APACHE II score in teaching
and community hospitals. Crit Care Med 1999, 27:1999-2004.
25. Beck DH, Smith GB, Taylor BL: The impact of low-risk ICU
admissions on mortality probabilities by SAPS II, APACHE II
and APACHE III. Anaesthesia 2002, 57:21-26.
26. Glance LG, Osler T, Shinozaki T: Effect of varying the casemix
on the SMR and W statistic. Chest 2000, 117:1112-1116.
27. Glance LG, Osler TM, Papadakos P: Effect of mortality rate on
the performance of the APACHE II: a simulation study. Crit
Care Med 2000, 28:3424-3428.
28. Murphy-Filkins R, Teres D, Lemeshow S, Hosmer DW: Effect of
changing patient mix on the performance of an ICU severity-
of-illness model: how to distinguish a general from a specialty
intensive care unit. Crit Care Med 1996, 24:1968-1973.
29. Zhu HP, Lemeshow S, Hosmer DW, Klar J, Avrunin J, Teres D: Fac-
tors affecting the performance of the models in the Mortality
Probability Model II system and strategies of customization: a
simulation study. Crit Care Med 1996, 24:57-63.
Key messages
• Health care is a complex adaptive system. Any change
in such a clinical environment will have both predictable
and unpredictable effects.
• Patient survival from intensive care is influenced by both
clinical and organisational factors.
• There should be a greater emphasis on continuously
monitoring the effect of an entire clinical environment on
patient survival, rather than just isolated pockets of
applied evidence.
• The cumulative risk adjusted mortality chart and the risk
adjusted p chart are simple techniques to provide near
real-time monitoring of the effect of the whole process
on survival of patients in intensive care.
• This real-time monitoring supplements rather than com-
petes with larger centralised databases, which provide
powerful retrospective comparative audit and archival
data.
The following Additional files are available online:
Additional File 1
A Microsoft Word file containing a description of the
construction of risk adjusted control charts.
See />supplementary/cc3996-S1.doc
Available online />Page 9 of 9
(page number not for citation purposes)
30. Rowan K, Carmel S: Variations in intensive care unit outcomes:
a search for the evidence on organisational factors. Curr Opin
Crit Care 2001, 7:284-296.
31. Caputo M, Reeves B, Rogers C, Ascioni M, Angelini G: Monitor-
ing the performance of residents during training in off-pump
coronary surgery. J Thorac Cardiovasc Surg 2004,
128:907-915.
32. Sherlaw-Johnson C, Lovegrove J, Treasure T, Gallivan S: Likely
variations in perioperative mortality associated with cardiac
surgery: when does high mortality reflect bad practice? Heart
2000, 84:79-82.
33. Steiner S, Cook R, Farewell V: Risk adjusted monitoring of sur-
gical outcomes. Med Decis Making 2001, 21:163-169.
34. Rogers C, Ganesh S, Banner NR, Bonser RS: Cumulative risk
adjusted monitoring of 30-day mortality after cardiothoracic
transplantation: UK experience. Eur J Cardiothorac Surg 2005,
27:1022-1029.
35. Lawrance R, Dorsch M, Sapsford R, Mackintosh A: Use of cumu-
lative mortality data in patients with acute myocardial infarc-
tion for early detection of variance in clinical practice:
observational study. BMJ 2001, 323:324-327.
36. Chamberlin WH, Lane KA, Kennedy JN, Bradley SD, Rice CL:
Monitoring intensive care unit performance using statistical
quality control charts. Int J Clin Monit Comput 1993,
10:155-161.
37. Poloniecki J, Sismandis C, Bland M, Jones P: Retrospective
cohort study of false alarm rates associated with a series of
heart operations: the case for hospital mortality monitoring
groups. BMJ 2004, 328:375.
38. Steiner SH, Cook RJ, Farewell VT: Monitoring paired binary sur-
gical outcomes using cumulative sum charts. Stat Med 1999,
18:69-86.