Báo cáo y học: "The value of monitoring outcomes should be measured by the appropriateness of the respons" ppt
Bạn đang xem bản rút gọn của tài liệu. Xem và tải ngay bản đầy đủ của tài liệu tại đây (347.98 KB, 2 trang )
Page 1 of 2
(page number not for citation purposes)
E-O = expected-observed; ICU = intensive care unit.
Available online />Abstract
Real-time monitoring of outcomes is becoming increasingly
feasible in health care, and with it the hope of early detection of
problems and the ability to tell whether interventions are having
their desired effect. The next step should be to try to demonstrate
that the reports of such monitoring systems lead to reasonable
responses and valid inferences about causality, and that we are not
chasing red herrings.
A high-profile patient managed by a high-profile doctor has a
bad outcome. Within the same month, but at different
geographical locations within a medical center, two surgical
procedures are conducted at the wrong anatomical site. In a
monitoring programme it is noted that an intensive care unit
(ICU) has ‘more deaths than expected’ for the second quarter
in a row. How should an organization react to such findings?
At what point should leaders convene special meetings to
evaluate organizational performance. How does one decide
whether and when to make sweeping changes to established
operating procedures, which almost invariably increase the
number of steps involved in caring for patients? Although we
have all experienced how the first example can galvanize an
institution into possibly ill considered responses, there is
hope that feedback from careful analyses of large databases
will improve patient care.
The report by Cockings and coworkers in the previous issue
of Critical Care [1] describes a method that allows individual
ICUs to monitor mortality outcomes graphically, and more
easily and rapidly than is possible using the quarterly
standardized mortality ratios received from an ICU national
audit programme, as already exists in England. The goal is to
minimize delays in recognizing significant deterioration in
performance and to provide this expedited feedback locally to
‘management and clinicians [who] are well placed to respond
rapidly with suitable investigation and corrective strategies if
necessary.’
The real allure of these methods is that we may be able to
achieve a new level of insight by linking trends in outcomes to
specific calendar dates and sequences of patients. It is
believed that this will allow local personnel to utilize their
knowledge of what is going on day-to-day in a particular
organizational unit as an additional explanatory factor for the
observed temporal variations in outcomes. It is acknowledged
by some of these same authors elsewhere [2] that, given the
small numbers of patients with any particular clinical
diagnosis in an ICU patient population, these methods are
necessarily ‘more suited to monitoring changes that affect all
patients or the entire clinical process.’
The use of real-time process monitoring is of course not new.
Statistical process control achieved widespread acceptance
after it was described in practical operational terms in
Western Electric’s Statistical Quality Control Handbook in
1958 [3], and it remains an essential tool in highly structured
manufacturing systems today. These methods have also been
applied across a variety of the much less structured settings
found in medicine, as summarized in the report by Cockings
and coworkers [1]. Their contribution in that article is to
illustrate, through a practical example in one ICU, two of the
simpler forms of process control charts: a ‘CRAM chart’ or a
plot of the cumlative difference between expected and
observed number of deaths, along with a ‘p-chart’ that uses
control limits based on statistical testing at monthly intervals
to look for mortality that exceeds expected levels. While both
of these methods have some disadvantages relative to more
complex methods, Cockings and coworkers argue that their
ease of use and accessibility to a nonstatistical audience
outweigh potential disadvantages.
Commentary
The value of monitoring outcomes should be measured by the
appropriateness of the response
Timothy P Hofer
VA Health Services Research & Development Center of Excellence, and Department of Internal Medicine, University of Michigan, Ann Arbor, MI, USA
Corresponding author: Tim Hofer,
Published: 29 March 2006 Critical Care 2006, 10:133 (doi:10.1186/cc4872)
This article is online at />© 2006 BioMed Central Ltd
See related research by Cockings et al. in issue 10.1 [ />Page 2 of 2
(page number not for citation purposes)
Critical Care Vol 10 No 2 Hofer
For those who are interested in the relative advantages and
disadvantages of different methods of real-time process
monitoring methods, the cited report by Grigg and coworkers
[4] provides additional discussion. However, there is perhaps
another important point to be made. Statistical process
control as practiced in industrial settings is conceived of as
having three parts [5], monitoring the process, identifying the
reasons for deviations in the process and taking corrective
action. However much we manage to improve the monitoring
step, the success of the undertaking still depends on how
well the causes of the problems are identified and remedied.
These latter two steps have received much less attention. It is
still an open question as to whether the widespread use of
these monitoring methods will lead to valid inferences about
cause and effect relationships that affect mortality in ICUs.
Even if valid causal relationships are correctly inferred, then
determining the appropriate response can be an enormous
challenge and one that is sometimes better suited to
multicentre trials than local improvization.
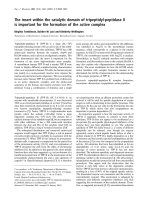
As correctly noted by Cockings and coworkers, ‘care must be
taken not to over interpret the E-O [expected-observed] chart
as fluctuations may represent random variations, or real but
transient and reversible changes in the quality of care.’
Figure 1 shows a simulated series of E-O tracings that could
be produced simply by random variation (given the
relationships between and distributions of mortality rates,
numbers of admissions and severity seen in a large cohort of
ICU patients in the USA [6]). One could imagine that in this
sample of identically performing ICUs, ICU A might feel quite
smug whereas ICU B would be instituting all kinds of new
procedures in an effort to remedy their apparently disastrous
trend. Even if the P charts revealed no statistically significant
monthly difference, an institution might be hard pressed to
ignore such a trend. Furthermore, apart from false alarms due
to random variation, Cook and coworkers [2] pointed out that
all types of control charts, ‘are as much a form of continuous
assessment of [a risk adjustment] tool calibration as of the
clinical process of care. Where a change is signaled, either
the model fit or the clinical milieu may have changed.’
Real-time monitoring of outcomes is becoming increasingly
feasible in health care, and with it the hope of early detection
of problems and the ability to tell whether interventions are
having their desired effect. What are really needed at this
point are some concrete examples of how ICUs use this more
timely signalling of outcome trends to identify and rectify
changes in performance, and some assurance that ICUs will
not end up spending too much time chasing red herrings as a
consequence of random variation in outcomes.
Competing interests
The author declares that they have no competing interests.
References
1. Cockings JGL, Cook DA, Iqbal RK: Process monitoring in inten-
sive care using cumulative expected minus observed mortal-
ity and risk-adjusted p charts. Crit Care 2006, 10:R28.
2. Cook DA, Steiner SH, Cook RJ, Farewell VT, Morton AP: Monitor-
ing the evolutionary process of quality: risk-adjusted charting
to track outcomes in intensive care. Crit Care Med 2003, 31:
1676-1682.
3. Western Electric. Statistical Quality Control Handbook. New
York, NY: Western Electric Company; 1958.
4. Grigg OA, Farewell VT, Spiegelhalter DJ: Use of risk-adjusted
CUSUM and RSPRT charts for monitoring in medical contexts.
Stat Methods Med Res 2003, 12:147-170.
5. Guh RS: Integrating artificial intelligence into on-line statisti-
cal process control. Qual Reliabil Eng Int 2003, 19:1-20.
6. Render ML, Kim HM, Deddens J, Sivaganesin S, Welsh DE,
Bickel K, Freyberg R, Timmons S, Johnston J, Connors AF Jr, et
al.: Variation in outcomes in Veterans Affairs intensive care
units with a computerized severity measure. Crit Care Med
2005, 33:930-939.
Figure 1
Simulated expected-observed tracings. OE, observed-expected; ICU,
intensive care unit.