Environmental Soil Chemistry - Chapter 6 docx
Bạn đang xem bản rút gọn của tài liệu. Xem và tải ngay bản đầy đủ của tài liệu tại đây (245.37 KB, 20 trang )
187
6
Ion Exchange
Processes
Introduction
I
on exchange, the interchange between an ion in solution and another
ion in the boundary layer between the solution and a charged surface
(Glossary of Soil Science Terms, 1997), truly has been one of the hall-
marks in soil chemistry. Since the pioneering studies of J. Thomas Way in the
middle of the 19th century (Way, 1850), many important studies have occurred
on various aspects of both cation and anion exchange in soils. The sources of
cation exchange in soils are clay minerals, organic matter, and amorphous
minerals. The sources of anion exchange in soils are clay minerals, primarily
1:1 clays such as kaolinite, and metal oxides and amorphous materials.
The ion exchange capacity is the maximum adsorption of readily exchange-
able ions (diffuse ion swarm and outer-sphere complexes) on soil particle
surfaces (Sposito, 2000). From a practical point of view, the ion exchange
capacity (the sum of the CEC (defined earlier; see Box 6.1 for description of
CEC measurement) and the AEC (anion exchange capacity, which is the sum
of total exchangeable anions that a soil can adsorb, expressed as cmol
c
kg
–1
,
where c is the charge; Glossary of Soil Science Terms, 1997)) of a soil is
important since it determines the capacity of a soil to retain ions in a form
such that they are available for plant uptake and not susceptible to leaching
in the soil profile. This feature has important environmental and plant nutrient
implications. As an example, NO
–
3
is important for plant growth, but if it
leaches, as it often does, it can move below the plant root zone and leach into
groundwater where it is deleterious to human health (see Chapter 1). If a soil
has a significant AEC, nitrate can be held, albeit weakly. Sulfate can be
significantly held in soils that have AEC and be available for plant uptake
(sulfate accumulations are sometimes observed in subsoils where oxides as
discrete particles or as coatings on clays impart positive charge or an AEC to
the soil). However, in soils lacking the ability to retain anions, sulfate can
leach readily and is no longer available to support plant growth.
188 6 Ion Exchange Processes
BOX 6.1. Measurement of CEC
The CEC of a soil is usually measured by saturating a soil or soil component with an index
cation such as Ca
2+
, removing excess salts of the index cation with a dilute electrolyte
solution, and then displacing the Ca
2+
with another cation such as Mg
2+
. The amount of
Ca
2+
displaced is then measured and the CEC is calculated. For example, let us assume that
200 mg of Ca
2+
were displaced from 100 g of soil. The CEC would then be calculated as
CEC =
200 mg Ca
2+
20 mg Ca
2+
= 10 meq/100 g = 10 cmol
c
kg
–1
(
100 g
)(
meq
)
The CEC values of various soil minerals were provided in Chapter 2. The CEC of a
soil generally increases with soil pH due to the greater negative charge that develops on
organic matter and clay minerals such as kaolinite due to deprotonation of functional
groups as pH increases. Thus, in measuring the CEC of variable charge soils and minerals,
if the index cation saturating solution is at a pH greater than the pH of the soil or mineral,
the CEC can be overestimated (Sumner and Miller, 1996). The anion exchange capacity
increases with decreasing pH as the variable charge surfaces become more positively
charged due to protonation of functional groups.
The magnitude of the CEC in soils is usually greater than the AEC. However, in soils
that are highly weathered and acidic, e.g., some tropical soils, copious quantities of variable
charge surfaces such as oxides and kaolinite may be present and the positive charge on the
soil surface may be significant. These soils can exhibit a substantial AEC.
Characteristics of Ion Exchange
Ion exchange involves electrostatic interactions between a counterion in the
boundary layer between the solution and a charged particle surface and
counterions in a diffuse cloud around the charged particle. It is usually rapid,
diffusion-controlled, reversible, and stoichiometric, and in most cases there
is some selectivity of one ion over another by the exchanging surface. Exchange
reversibility is indicated when the exchange isotherms for the forward and
backward exchange reactions coincide (see the later section Experimental
Interpretations for discussion of exchange isotherms). Exchange irreversibility
or hysteresis is sometimes observed and has been attributed to colloidal aggre-
gation and the formation of quasi-crystals (Van Bladel and Laudelout, 1967).
Quasi-crystals are packets of clay platelets with a thickness of a single layer in
stacked parallel alignment (Verburg and Baveye, 1994). The quasi-crystals
could make exchange sites inaccessible.
Stoichiometry means that any ions that leave the colloidal surface are
replaced by an equivalent (in terms of ion charge) amount of other ions. This
is due to the electroneutrality requirement. When an ion is displaced from
the surface, the exchanger has a deficit in counterion charge that must be
balanced by counterions in the diffuse ion cloud around the exchanger. The
total counterion content in equivalents remains constant. For example, to
maintain stoichiometry, two K
+
ions are necessary to replace one Ca
2+
ion.
Since electrostatic forces are involved in ion exchange, Coulomb’s law
can be invoked to explain the selectivity or preference of the ion exchanger
for one ion over another. This was discussed in Chapter 5. However, in review,
one can say that for a given group of elements from the periodic table with
the same valence, ions with the smallest hydrated radius will be preferred,
since ions are hydrated in the soil environment. Thus, for the group 1 elements
the general order of selectivity would be Cs
+
> Rb
+
> K
+
> Na
+
> Li
+
> H
+
. If
one is dealing with ions of different valence, generally the higher charged ion
will be preferred. For example, Al
3+
> Ca
2+
> Mg
2+
> K
+
= NH
4
+
> Na
+
. In
examining the effect of valence on selectivity polarization must be considered.
Polarization is the distortion of the electron cloud about an anion by a cation.
The smaller the hydrated radius of the cation, the greater the polarization,
and the greater its valence, the greater its polarizing power. With anions, the
larger they are, the more easily they can be polarized. The counterion with
the greater polarization is usually preferred, and it is also least apt to form a
complex with its coion. Helfferich (1962b) has given the following selectivity
sequence, or lyotropic series, for some of the common cations: Ba
2+
> Pb
2+
Sr
2+
> Ca
2+
> Ni
2+
> Cd
2+
> Cu
2+
> Co
2+
> Zn
2+
> Mg
2+
> Ag
+
> Cs
+
> Rb
+
> K
+
> NH
4
+
> Na
+
> Li
+
.
The rate of ion exchange in soils is dependent on the type and quantity
of inorganic and organic components and the charge and radius of the ion
being considered (Sparks, 1989). With clay minerals like kaolinite, where
only external exchange sites are present, the rate of ion exchange is rapid.
With 2:1 clay minerals that contain both external and internal exchange sites,
particularly with vermiculite and micas where partially collapsed interlayer
space sites exist, the kinetics are slower. In these types of clays, ions such as
K
+
slowly diffuse into the partially collapsed interlayer spaces and the exchange
can be slow and tortuous. The charge of the ion also affects the kinetics of
ion exchange. Generally, the rate of exchange decreases as the charge of the
exchanging species increases (Helfferich, 1962a). More details on the kinetics
of ion exchange reactions can be found in Chapter 7.
Characteristics of Ion Exchange 189
Cation Exchange Equilibrium Constants and
Selectivity Coefficients
Many attempts to define an equilibrium exchange constant have been made
since such a parameter would be useful for determining the state of ionic
equilibrium at different ion concentrations. Some of the better known
equations attempting to do this are the Kerr (1928), Vanselow (1932), and
Gapon (1933) expressions. In many studies it has been shown that the
equilibrium exchange constants derived from these equations are not
constant as the composition of the exchanger phase (solid surface) changes.
Thus, it is often better to refer to them as selectivity coefficients rather than
exchange constants.
Kerr Equation
In 1928 Kerr proposed an “equilibrium constant,” given below, and correctly
pointed out that the soil was a solid solution (a macroscopically homogeneous
mixture with a variable composition; Lewis and Randall (1961)). For a binary
reaction (a reaction involving two ions),
vACl
u
(aq) + uBX
v
(s) uBCl
v
(aq) + vAX
u
(s), (6.1)
where A
u+
and B
v+
are exchanging cations and X represents the exchanger, (aq)
represents the solution or aqueous phase, and (s) represents the solid or
exchanger phase.
Kerr (1928) expressed the “equilibrium constant,” or more correctly, a
selectivity coefficient for the reaction in Eq. (6.1), as
K
K
=
[BCl
v
]
u
{AX
u
}
v
,
(6.2)
[ACl
u
]
v
{BX
v
}
u
where brackets ([ ]) indicate the concentration in the aqueous phase in mol
liter
–1
and braces ({ }) indicate the concentration in the solid or exchanger
phase in mol kg
–1
.
Kerr (1928) studied Ca–Mg exchange and found that the K
K
value
remained relatively constant as exchanger composition changed. This indicated
that the system behaved ideally; i.e., the exchanger phase activity coefficients
for the two cations were each equal to 1 (Lewis and Randall, 1961). These
results were fortuitous since Ca–Mg exchange is one of the few binary exchange
systems where ideality is observed.
Vanselow Equation
Albert Vanselow was a student of Lewis and was the first person to give ion
exchange a truly thermodynamical context. Considering the binary cation
exchange reaction in Eq. (6.1), Vanselow (1932) described the thermodynamic
equilibrium constant as
190 6 Ion Exchange Processes
K
eq
=
(BCl
v
)
u
(AX
u
)
v
, (6.3)
(ACl
u
)
v
(BX
v
)
u
where parentheses indicate the thermodynamic activity. It is not difficult to
determine the activity of solution components, since the activity would equal
the product of the equilibrium molar concentration of the cation multiplied
by the solution activity coefficients of the cation, i.e., (ACl
u
) = (C
A
) (γ
A
) and
(BCl
v
) = (C
B
) (γ
B
). C
A
and C
B
are the equilibrium concentrations of cations
A and B, respectively, and γ
A
and γ
B
are the solution activity coefficients of
the two cations, respectively.
The activity coefficients of the electrolytes can be determined using
Eq. (4.15).
However, calculating the activity of the exchanger phase is not as simple.
Vanselow defined the exchanger phase activity in terms of mole fractions, N
–
A
and N
–
B
for ions A and B, respectively. Thus, according to Vanselow (1932)
Eq. (6.3) could be rewritten as
K
V
=
γ
u
B
C
u
B
N
–
v
A
, (6.4)
γ
v
A
C
v
A
N
–
u
B
where
N
–
A
=
{AX
u
}
{AX
u
} + {BX
v
}
and
N
–
B
=
{BX
v
}
. (6.5)
{AX
u
} + {BX
v
}
Vanselow (1932) assumed that K
V
was equal to K
eq
. However, he failed to
realize one very important point. The activity of a “component of a homo-
geneous mixture is equal to its mole fraction only if the mixture is ideal”
(Guggenheim, 1967), i.e., ƒ
A
= ƒ
B
= 1, where ƒ
A
and ƒ
B
are the exchanger
phase activity coefficients for cations A and B, respectively. If the mixture is
not ideal, then the activity is a product of N
–
and ƒ. Thus, K
eq
is correctly
written as
K
eq
=
γ
u
B
C
u
B
N
–
v
A
ƒ
v
A
= K
V
ƒ
v
A
, (6.6)
(
γ
v
A
C
v
A
N
–
u
B
ƒ
u
B
)(
ƒ
u
B
)
where
ƒ
A
≡ (AX
u
)/N
–
A
and ƒ
B
≡ (BX
v
)/N
–
B
. (6.7)
Thus,
K
V
= K
eq
(ƒ
u
B
/ƒ
v
A
) (6.8)
and K
V
is an apparent equilibrium exchange constant or a cation exchange
selectivity coefficient.
Cation Exchange Equilibrium Constants and Selectivity Coefficients 191
Other Empirical Exchange Equations
A number of other cation exchange selectivity coefficients have also been
employed in environmental soil chemistry. Krishnamoorthy and Overstreet
(1949) used a statistical mechanics approach and included a factor for valence
of the ions, 1 for monovalent ions, 1.5 for divalent ions, and 2 for trivalent
ions, to obtain a selectivity coefficient K
KO
. Gaines and Thomas (1953) and
Gapon (1933) also introduced exchange equations that yielded selectivity
coefficients (K
GT
and K
G
, respectively). For K–Ca exchange on a soil, the
Gapon Convention would be written as
Ca
1/2
-soil + K
+
K-soil +
1
/
2
Ca
2+
, (6.9)
where there are chemically equivalent quantities of the exchanger phases and
the exchangeable cations. The Gapon selectivity coefficient for K–Ca exchange
would be expressed as
K
G
=
{K-soil}[Ca
2+
]
1/2
, (6.10)
{Ca
1/2
-soil}[K
+
]
where brackets represent the concentration in the aqueous phase, expressed
as mol liter
–1
, and braces represent the concentration in the exchanger phase,
expressed as mol kg
–1
. The selectivity coefficient obtained from the Gapon
equation has been the most widely used in soil chemistry and appears to vary
the least as exchanger phase composition changes. The various cation exchange
selectivity coefficients for homovalent and heterovalent exchange are given
in Table 6.1.
Thermodynamics of Ion Exchange
Theoretical Background
Thermodynamic equations that provide a relationship between exchanger
phase activity coefficients and the exchanger phase composition were inde-
pendently derived by Argersinger et al. (1950) and Hogfeldt (Ekedahl et al.,
1950; Hogfeldt et al., 1950). These equations, as shown later, demonstrated
that the calculation of an exchanger phase activity coefficient, ƒ, and the
thermodynamic equilibrium constant, K
eq
, were reduced to the measurement
of the Vanselow selectivity coefficient, K
V
, as a function of the exchanger
phase composition (Sposito, 1981a). Argersinger et al. (1950) defined ƒ as ƒ
= a/N
–
, where a is the activity of the exchanger phase.
Before thermodynamic parameters for exchange equilibria can be calcu-
lated, standard states for each phase must be defined. The choice of standard
state affects the value of the thermodynamic parameters and their physical
interpretation (Goulding, 1983a). Table 6.2 shows the different standard states
and the effects of using them. Normally, the standard state for the adsorbed
phase is the homoionic exchanger in equilibrium with a solution of the satu-
rating cation at constant ionic strength.
192 6 Ion Exchange Processes
Argersinger et al. (1950), based on Eq. (6.8), assumed that any change
in K
V
with regard to exchanger phase composition occurred because of a
variation in exchanger phase activity coefficients. This is expressed as
v ln ƒ
A
– u ln ƒ
B
= ln K
eq
– ln K
V
. (6.11)
Taking differentials of both sides, realizing that K
eq
is a constant, results in
vd ln ƒ
A
– ud ln ƒ
B
= – d ln K
V
. (6.12)
Any change in the activity of BX
v
(s) must be accounted for by a change in
the activity of AX
u
(s), such that the mass in the exchanger is conserved. This
necessity, an application of the Gibbs–Duhem equation (Guggenheim,
1967), results in
N
–
A
d ln ƒ
A
+ N
–
B
d ln ƒ
B
= 0. (6.13)
Thermodynamics of Ion Exchange 193
TABLE 6.1. Cation Exchange Selectivity Coefficients for Homovalent (K–Na) and Heterovalent
(K–Ca) Exchange
Selectivity coefficient Homovalent exchange
a
Heterovalent exchange
b
Kerr K
K
=
{K-soil}[Na
+
]
c
K
K
=
{K-soil}
2
[Ca
2+
]
{Na-soil}[K
+
] {Ca-soil}[K
+
]
2
Vanselow
d
K
V
=
{K-soil}[Na
+
]
, K
V
=
{K-soil}
2
[Ca
2+
]
{Na-soil}[K
+
]
[
{Ca-soil}[K
+
]
2
]
or K
V
= K
K
1
[
{K-soil} + [Ca-soil]
]
or
K
K
1
[
{K-soil} + [Ca-soil]
]
Krishnamoorthy– K
KO
=
{K-soil}[Na
+
]
, K
KO
=
{K-soil}
2
[Ca
2+
]
Overstreet
{Na-soil}[K
+
]
[
{Ca-soil}[K
+
]
2
]
or K
KO
= K
K
1
[
{K-soil} + 1.5 {Ca-soil}
]
Gaines–Thomas
d
K
GT
=
{K-soil}[Na
+
]
, K
GT
=
{K-soil}
2
[Ca
2+
]
{Na-soil}[K
+
]
[
{Ca-soil}[K
+
]
2
]
or K
GT
= K
K
1
[
2[2{Ca soil} + {K soil}]
]
Gapon K
G
=
{K-soil}[Na
+
]
, K
G
=
{K soil}[Ca
2+
]
1/2
{Na-soil}[K
+
] {Ca
1/2
soil}[K
+
]
or K
G
= K
K
a
The homovalent exchange reaction (K–Na exchange) is Na-soil + K
+
K-soil + Na
+
.
b
The heterovalent exchange reaction (K–Ca exchange) is Ca-soil + 2K
+
2K-soil + Ca
2+
, except for the Gapon convention where the
exchange reaction would be Ca
1/2
-soil + K
+
K-soil +
1
/
2
Ca
2+
.
c
Brackets represent the concentration in the aqueous phase, which is expressed in mol liter
–1
; braces represent the concentration in the exchanger
phase, which is expressed in mol kg
–1
.
d
Vanselow (1932) and Gaines and Thomas (1953) originally expressed both aqueous and exchanger phases in terms of activity. For simplicity,
they are expressed here as concentrations.
Equations (6.12) and (6.13) can be solved, resulting in
vd ln ƒ
A
=
–vN
–
B
d ln K
V
(6.14)
(
uN
–
A
+ vN
–
B
)
ud ln ƒ
B
=
–vN
–
A
d ln K
V
, (6.15)
(
uN
–
A
+ vN
–
B
)
where (uN
–
A
/(uN
–
A
+ vN
–
B
)) is equal to E
–
A
or the equivalent fraction of AX
u
(s) and E
–
B
is (vN
–
B
/(uN
–
A
+ vN
–
B
)) or the equivalent fraction of BX
v
(s) and the
identity N
–
A
and N
–
B
= 1.
194 6 Ion Exchange Processes
TABLE 6.2. Some of the Standard States Used in Calculating the Thermodynamic Parameters of
Cation-Exchange Equilibria
a
Standard state
Adsorbed phase Solution phase Implications Reference
Activity = mole fraction Activity = molarity as Can calculate ƒ, K
V
, etc., but Argersinger et al.
when the latter = 1 concentration → 0 all depend on ionic strength (1950)
Homoionic exchanger Activity = molarity as ΔG
o
ex
expresses relative affinity Gaines and
in equilibrium with an concentration → 0 of exchanger for cations Thomas (1953)
infinitely dilute solution
of the ion
Activity = mole fraction Activity = molarity as ΔG
o
ex
expresses relative affinity Babcock (1963)
when the latter = 0.5. concentration → 0 of exchanger for cations
Components not in when mole fraction = 0.5
equilibrium
a
From Goulding (1983b), with permission.
In terms of E
–
A
, Eqs. (6.14) and (6.15) become
vd ln ƒ
A
= –(1 – E
–
A
) d ln K
V
(6.16)
ud ln ƒ
B
= E
–
A
d ln K
V
. (6.17)
Integrating Eqs. (6.16) and (6.17) by parts, noting that ln ƒ
A
= 0 at N
–
A
= 1, or E
–
A
= 1, and similarly ln ƒ
B
= 0 at N
–
A
= 0, or E
–
A
= 0,
–v ln ƒ
A
= + (1 – E
–
A
) ln K
V
–
∫
1
E
–
A
ln K
V
dE
–
A
, (6.18)
–u ln ƒ
B
= –E
–
A
ln K
V
+
∫
E
–
A
0
ln K
V
dE
–
A
. (6.19)
Substituting these into Eq. (6.11) leads to
ln K
eq
=
∫
1
0
ln K
V
dE
–
A
, (6.20)
which provides for calculation of the thermodynamic equilibrium exchange
constant. Thus, by plotting ln K
V
vs E
–
A
and integrating under the curve,
from E
–
A
= 0 to E
–
A
= 1, one can calculate K
eq
, or in ion exchange studies,
Thermodynamics of Ion Exchange 195
K
ex
, the equilibrium exchange constant. Other thermodynamic parameters
can then be determined as given below,
ΔG
0
ex
= –RT ln K
ex
, (6.21)
where ΔG
0
ex
is the standard Gibbs free energy of exchange. Examples of how
exchanger phase activity coefficients and K
ex
and ΔG
0
ex
values can be calcu-
lated for binary exchange processes are provided in Boxes 6.2 and 6.3,
respectively.
Using the van’t Hoff equation one can calculate the standard enthalpy of
exchange, ΔH
0
ex
, as
ln
K
ex
T
2
=
– ΔH
0
ex
1
–
1
, (6.22)
K
ex
T
1
(
R
)(
T
2
T
1
)
where subscripts 1 and 2 denote temperatures 1 and 2. From this relationship,
ΔG
0
ex
= ΔH
0
ex
– TΔS
0
ex
. (6.23)
The standard entropy of exchange, ΔS
0
ex
, can be calculated, using
ΔS
0
ex
= (ΔH
0
ex
– ΔG
0
ex
)/T. (6.24)
BOX 6.2. Calculation of Exchanger Phase Activity Coefficients
It would be instructive at this point to illustrate how exchanger phase activity
coefficients would be calculated for the homovalent and heterovalent exchange
reactions in Table 6.1. For the homovalent reaction, K–Na exchange, the
ƒ
K
and ƒ
Na
values would be calculated as (Argersinger et al., 1950)
–ln ƒ
K
= (1 – E
–
K
) ln K
V
–
∫
1
E
K
–
ln K
V
dE
K
–
, (6.2a)
–ln ƒ
Na
= –E
–
K
ln K
V
+
∫
E
–
0
–
K
ln K
V
dE
–
K
, (6.2b)
and
ln K
ex
=
∫
1
0
ln K
V
dE
K
–
. (6.2c)
For the heterovalent exchange reaction, K–Ca exchange, the ƒ
K
and ƒ
Ca
values would be calculated as (Ogwada and Sparks, 1986a)
2 ln ƒ
K
= –(1 – E
–
K
) ln K
V
+
∫
1
E
–
K
ln K
V
dE
–
K
, (6.2d)
ln ƒ
Ca
= E
–
K
ln K
V
–
∫
E
–
K
0
ln K
V
dE
–
K
, (6.2e)
and
ln K
ex
=
∫
1
0
ln K
V
dE
–
K
. (6.2f)
196 6 Ion Exchange Processes
BOX 6.3. Calculation of Thermodynamic Parameters for K–Ca Exchange on a Soil
Consider the general binary exchange reaction in Eq. (6.1).
vACl
u
(aq) + uBX
v
(s) uBCl
v
(aq) + vAX
u
(s). (6.3a)
If one is studying K–Ca exchange where A is K
+
, B is Ca
2+
, v is 2, and u is 1, then
Eq. (6.3a) can be rewritten as
2KCl + Ca-soil CaCl
2
+ 2K-soil. (6.3b)
Using the experimental methodology given in the text, one can calculate K
v
, K
ex
, and
ΔG
0
ex
parameters for the K–Ca exchange reaction in Eq. (6.3b) as shown in the calculations
below. Assume the ionic strength (I) was 0.01 and the temperature at which the experiment
was conducted is 298 K.
Solution (aq.) Exchanger
Exchanger phase concentration phase concentration Mole
test (mol liter
–1
) (mol kg
–1
) fractions
a
K
+
Ca
2+
K
+
Ca
2+
N
–
K
N
–
Ca
K
V
b
ln K
V
E
–
K
c
1 0 3.32×10
–3
0 1.68×10
–2
0 1.000 — 5.11
d
0
21×10
–3
2.99×10
–3
2.95×10
–3
1.12×10
–2
0.2086 0.7914 134.20 4.90 0.116
3 2.5×10
–3
2.50×10
–3
7.88×10
–3
1.07×10
–2
0.4232 0.5768 101.36 4.62 0.268
4 4.0×10
–3
1.99×10
–3
8.06×10
–3
5.31×10
–3
0.6030 0.3970 92.95 4.53 0.432
5 7.0×10
–3
9.90×10
–4
8.63×10
–3
2.21×10
–3
0.7959 0.2041 51.16 3.93 0.661
6 8.5×10
–3
4.99×10
–4
1.17×10
–2
1.34×10
–3
0.8971 0.1029 44.07 3.79 0.813
7 9.0×10
–3
3.29×10
–4
1.43×10
–2
1.03×10
–3
0.9331 0.0669 43.13 3.76 0.875
8 1.0×10
–2
0 1.45×10
–2
0 1.000 0.0000 — 3.70
d
1
a
N
–
K
=
{K
+
}
; N
–
Ca
=
{Ca
2+
}
,
{K
+
} + {Ca
2+
}{K
+
} + {Ca
2+
}
where braces indicate the exchanger phase composition, in mol kg
–1
; e.g., for exchanger test 2,
N
–
K
=
(2.95×10
–3
)
= 0.2086.
(2.95×10
–3
) + (1.12×10
–2
)
b
K
V
=
γ
Ca
2+
C
Ca
2+
(N
–
K
)
2
,
(γ
K
+
)
2
(C
K
+
)
2
(N
–
Ca
)
where γ is the solution phase activity coefficient calculated according to Eq. (4.15) and C is the solution concen-
tration; e.g., for exchanger test 2,
K
V
=
(0.6653)(2.99×10
–3
mol liter
–1
)(0.2086)
2
= 134.20.
(0.9030)
2
(1×10
–3
mol liter
–1
)
2
(0.7914)
c
E
–
K
is the equivalent fraction of K
+
on the exchanger,
E
–
K
=
uN
–
K
=
N
–
K
;
uN
–
K
+ vN
–
Ca
N
–
K
+ 2N
–
Ca
e.g., for exchanger test 2,
0.2086
=
0.2086
= 0.116.
0.2086 + (0.7914)(2) 1.7914
d
Extrapolated ln K
V
values.
Using Eq. (6.20),
ln K
ex
=
∫
1
0
ln K
V
dE
–
K
,
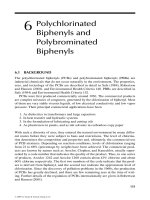
FIGURE 6.B1.
one can determine ln K
ex
by plotting ln K
V
vs E
–
K
(Fig. 6.B1) and integrating under the
curve by summing the areas of the trapezoids using the relationship
1
2
∑
8
i=1
(E
–
i+1
K
– E
–
i
K
) (y
i
+ y
i+1
) ,
(6.3c)
where E
–
1
K
. . . E
–
8
K
are the experimental values of E
–
K
, (E
–
i+1
K
– E
–
i
K
) gives the width of the ith
trapezoid, and y
1
. . . y
8
represent the corresponding ln K
V
values.
Accordingly, ln K
ex
for the exchange reaction in Eq. (6.3b) would be
ln K
ex
=
1
[(0.116 – 0) (5.11 + 4.90) + (0.268 – 0.116)
2
× (4.90 + 4.62) + (0.432 – 0.268) (4.62 + 4.53)
+ (0.661 – 0.432) (4.53 + 3.93) + (0.813 – 0.661)
× (3.93 + 3.79) + (0.875 – 0.813) (3.79 + 3.76)
+ (1 – 0.875) (3.76 + 3.70)],
where ln K
ex
= 4.31 and K
ex
= 74.45. From this value one can then calculate ΔG
0
ex
using
Eq. (6.21):
ΔG
0
ex
= –RT ln K
ex
.
Substituting 8.314 J mol
–1
K
–1
for R and assuming T = 298 K, ΔG
0
ex
= –(8.314 J mol
–1
K
–1
) (298 K) (4.31) = –10,678 J mol
–1
= –10.68 kJ mol
–1
.
Since ΔG
0
ex
is negative, this would indicate that K
+
is preferred over Ca
2+
on the soil.
Thermodynamics of Ion Exchange 197
Gaines and Thomas (1953) also described the thermodynamics of cation
exchange and made two contributions. They included a term in the
Gibbs–Duhem equation for the activity of water that may be adsorbed on
the exchanger. This activity may change as the exchanger phase composition
changes. Some workers later showed that changes in water activity with
exchanger composition variations had little effect on K
ex
calculations (Laudelout
6
5
4
3
2
1
0 0.1 0.2 0.3
E
K
In K
V
0
0.4 0.5 0.6 0.7 0.8 0.9 1
198 6 Ion Exchange Processes
and Thomas, 1965) but can affect calculation of ƒ values for zeolites (Barrer
and Klinowski, 1974). Gaines and Thomas (1953) also defined the reference
state of a component of the exchanger as the homoionic exchanger made up
of the component in equilibrium with an infinitely dilute aqueous solution
containing the components. Gaines and Thomas (1953) defined the exchange
equilibrium constant of Eq. (6.1) as
K
ex
= (BCl
v
)
u
g
v
A
E
–
v
A
/(ACl
u
)
v
g
u
B
E
–
u
B
, (6.25)
where g
A
and g
B
are the exchanger phase activity coefficients and are defined as
g
A
≡ (AX
u
)/E
–
A
and g
B
≡ (BX
v
)/E
–
B
. (6.26)
Thus, the Gaines and Thomas selectivity coefficient, K
GT
, would be
defined as
K
GT
= (BCl
v
)
u
E
–
v
A
/(ACl
u
)
v
E
–
u
B
. (6.27)
Hogfeldt et al. (1950) also defined the exchanger phase activity coefficients
in terms of the equivalent fraction rather than the Vanselow (1932) convention
of mole fraction. Of course, for homovalent exchange, mole and equivalent
fractions are equal.
There has been some controversy as to whether the Argersinger et al.
(1950) or the Gaines and Thomas (1953) approach should be used to calculate
thermodynamic parameters, particularly exchanger phase activity coefficients.
Sposito and Mattigod (1979) and Babcock and Doner (1981) have questioned
the use of the Gaines and Thomas (1953) approach. They note that except for
homovalent exchange, the g values are not true activity coefficients, since the
activity coefficient is the ratio of the actual activity to the value of the activity
under those limiting conditions when Raoult’s law applies (Sposito and
Mattigod, 1979). Thus, for exchanger phases, an activity coefficient is the ratio
of an actual activity to a mole fraction. Equivalents are formal quantities not
associated with actual chemical species except for univalent ions.
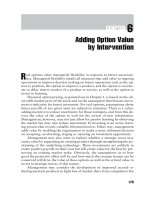
Goulding (1983b) and Ogwada and Sparks (1986a) compared the two
approaches for several exchange processes and concluded that while there
were differences in the magnitude of the selectivity coefficients and adsorbed
phase activity coefficients, the overall trends and conclusions concerning ion
preferences were the same. Ogwada and Sparks (1986a) studied K–Ca exchange
on soils at several temperatures and compared the Argersinger et al. (1950)
and Gaines and Thomas (1953) approaches. The difference in the exchanger
phase activity coefficients with the two approaches was small at low fractional
K
+
saturation values but increased as fractional K
+
saturation increased
(Fig. 6.1). However, as seen in Fig. 6.1 the minima, maxima, and inflexions
occurred at the same fractional K
+
saturations with both approaches.
Experimental Interpretations
In conducting an exchange study to measure selectivity coefficients, exchanger
phase activity coefficients, equilibrium exchange constants, and standard free
energies of exchange, the exchanger is first saturated to make it homoionic
(one ion predominates on the exchanger). For example, if one wanted to
study K–Ca exchange, i.e., the conversion of the soil from Ca
2+
to K
+
, one
would equilibrate the soil several times with 1 M CaCl
2
or Ca(ClO
4
)
2
and
then remove excess salts with water and perhaps an organic solvent such as
methanol. After the soil is in a homoionic form, i.e., Ca-soil, one would
equilibrate the soil with a series of salt solutions containing a range of Ca
2+
and K
+
concentrations (Box 6.3). For example, in the K–Ca exchange experi-
ment described in Box 6.3 the Ca-soil would be reacted by shaking with or
leaching with the varying solutions until equilibrium had been obtained; i.e.,
the concentrations of K
+
and Ca
2+
in the equilibrium (final) solutions were
equal to the initial solution concentrations of K
+
and Ca
2+
. To calculate the
quantity of ions adsorbed on the exchanger (exchanger phase concentration
in Box 6.3) at equilibrium, one would exchange the ions from the soil using
a different electrolyte solution, e.g., ammonium acetate, and measure the
exchanged ions using inductively coupled plasma (ICP) spectrometry or
some other analytical technique. Based on such an exchange experiment, one
could then calculate the mole fractions of the adsorbed ions, the selectivity
coefficients, and K
ex
and ΔG
0
ex
as shown in Box 6.3.
From the data collected in an exchange experiment, exchange isotherms
that show the relationship between the equivalent fraction of an ion on the
exchanger phase (E
–
i
) versus the equivalent fraction of that ion in solution (E
i
)
are often presented. In homovalent exchange, where the equivalent fraction
in the exchanger phase is not affected by the ionic strength and exchange
equilibria are also not affected by valence effects, a diagonal line through
the exchange isotherm can be used as a nonpreference exchange isotherm
(ΔG
0
ex
= 0; E
i
= E
–
i
where i refers to ion i (Jensen and Babcock, 1973)). That
Thermodynamics of Ion Exchange 199
FIGURE 6.1. Exchanger phase activity
coefficients for K
+
and Ca
2+
calculated according to
the Argersinger et al. (1950) approach (ƒ
K
and ƒ
Ca
,
respectively) and according to the Gaines and
Thomas (1953) approach (g
K
and g
Ca
, respectively)
versus fractional K
+
saturation (percentage of
exchanger phase saturated with K
+
).
From Ogwada and Sparks (1986a), with permission.
is, if the experimental data lie on the diagonal, there is no preference for one
ion over the other. If the experimental data lie above the nonpreference
isotherm, the final ion or product is preferred, whereas if the experimental
data lie below the diagonal, the reactant is preferred. In heterovalent
exchange, however, ionic strength affects the course of the isotherm and the
diagonal cannot be used (Jensen and Babcock, 1973). By using Eq. (6.28)
below, which illustrates divalent–univalent exchange, e.g., Ca–K exchange,
nonpreference exchange isotherms can be calculated (Sposito, 2000),
E
–
Ca
= 1 – 1 +
21
–
1
–1/2
, (6.28)
{
ΓI
[
(1 – E
Ca
)
2
(1 – E
Ca
)
]}
where I = ionic strength of the solution, E
–
Ca
= equivalent fraction of Ca
2+
on
the exchanger phase, E
Ca
= equivalent fraction of Ca
2+
in the solution phase,
and Γ = γ
K
2
/γ
Ca
. If the experimental data lie above the curvilinear non-
preference isotherm calculated using Eq. (6.28), then K
V
>1 and the final ion
or product is preferred (in this case, Ca
2+
). If the data lie below the non-
preference isotherm, the initial ion or reactant is preferred (in this case, K
+
).
Thus, from Fig. 6.2 (Jensen and Babcock, 1973) one sees that K
+
is preferred
over Na
+
and Mg
2+
and Ca
2+
is preferred over Mg
2+
.
Table 6.3, from Jensen and Babcock (1973), shows the effect of ionic
strength on thermodynamic parameters for several binary exchange systems
of a Yolo soil from California. The K
ex
and ΔG
0
ex
values are not affected
by ionic strength. Although not shown in Table 6.3, the K
V
was dependent
on ionic strength with the K exchange systems (K–Na, K–Mg, K–Ca),
and there was a selectivity of K
+
over Na
+
, Mg
2+
, and Ca
2+
which decreased
with increasing K
+
saturation. For Mg–Ca exchange, the K
V
values were
independent of ionic strength and exchanger composition. This system
behaved ideally.
It is often observed, particularly with K
+
, that K
V
values decrease as the
equivalent fraction of cation on the exchanger phase or fractional cation
saturation increases (Fig. 6.3). Ogwada and Sparks (1986a) ascribed the
decrease in the K
V
with increasing equivalent fractions to the heterogeneous
200 6 Ion Exchange Processes
FIGURE 6.2. Cation exchange isotherms for several cation exchange systems. E = equivalent fraction in
the solution phase, E
–
= equivalent fraction on the exchanger phase. The broken lines represent nonpreference
exchange isotherms. From Jensen and Babcock (1973), with permission.
exchange sites and a decreasing specificity of the surface for K
+
ions. Jardine
and Sparks (1984a,b) had shown earlier that there were different sites for K
+
exchange on soils.
One also observes with K
+
as well as other ions that the exchanger phase
activity coefficients do not remain constant as exchanger phase composition
changes (Fig. 6.1). This indicates nonideality since if ideality existed ƒ
Ca
and
ƒ
K
would both be equal to 1 over the entire range of exchanger phase com-
position. A lack of ideality is probably related to the heterogeneous sites and
the heterovalent exchange. Exchanger phase activity coefficients correct the
equivalent or mole fraction terms for departures from ideality. They thus
reflect the change in the status, or fugacity, of the ion held at exchange sites
and the heterogeneity of the exchange process. Fugacity is the degree of
freedom an ion has to leave the adsorbed state, relative to a standard state of
maximum freedom of unity. Plots of exchanger phase activity coefficients
versus equivalent fraction of an ion on the exchanger phase show how this
freedom changes during the exchange process, which tells something about
the exchange heterogeneity. Selectivity changes during the exchange process
can also be gleaned (Ogwada and Sparks, 1986a).
Thermodynamics of Ion Exchange 201
TABLE 6.3. Effect of Ionic Strength on Thermodynamic Parameters for Several Cation-Exchange
Systems
a
Standards Gibbs free
energy of exchange (ΔG
0
ex
) Equilibrium exchange constant
Ionic
(kJ mol
–1
)(K
ex
)
strength K–Na Mg–Ca K–Mg K–Ca K–Na Mg–Ca K–Mg K–Ca
(I) exchange exchange exchange exchange exchange exchange exchange exchange
0.001 — 1.22 –7.78 — — 0.61 22.93 —
0.010 –4.06 1.22 –7.77 –6.18 5.12 0.61 22.85 12.04
0.100 –4.03 — — — 5.08 — — —
a
From Jensen and Babcock (1973), with permission. The exchange studies were conducted on a Yolo loam soil.
FIGURE 6.3. Natural logarithm of Vanselow
selectivity coefficients (K
V
,•) and Gaines
and Thomas selectivity coefficients (K
GT
, O)
as a function of fractional K
+
saturation
(percentage of exchanger phase saturated with K
+
)
on Chester loam soil at 298 K. From Ogwada and
Sparks (1986a), with permission.
The ΔG
0
ex
values indicate the overall selectivity of an exchanger at
constant temperature and pressure, and independently of ionic strength. For
K–Ca exchange a negative ΔG
0
ex
would indicate that the product or K
+
is
preferred. A positive ΔG
0
ex
would indicate that the reactant, i.e., Ca
2+
is
preferred. Some ΔG
0
ex
values as well as ΔH
0
ex
parameters for exchange on soils
and soil components are shown in Table 6.4.
202 6 Ion Exchange Processes
TABLE 6.4. Standard Gibbs Free Energy of Exchange (ΔG
0
ex
) and Standard Enthalpy of Exchange
(ΔH
0
ex
) Values for Binary Exchange Processes on Soils and Soil Components
a
Exchange Exchanger ΔG
0
ex
ΔH
0
ex
Reference
process (kJ mol
–1
) (kJ mol
–1
)
Ca–Na Soils 2.15 to 7.77 Mehta et al. (1983)
Ca–Na Calcareous soils 2.38 to 6.08 Van Bladel and Gheyi
(1980)
Ca–Na World vermiculite 0.06 39.98 Wild and Keay (1964)
Ca–Na Camp Berteau 0.82
montmorillonite
Ca–Mg Calcareous soils 0.27 to 0.70 Van Bladel and Gheyi
(1980)
Ca–Mg Camp Berteau 0.13 Van Bladel and Gheyi
montmorillonite (1980)
Ca–K Chambers 7.67 16.22 Hutcheon (1966)
montmorillonite
Ca–NH
4
Camp Berteau 8.34 23.38 Laudelout et al. (1967)
montmorillonite
Ca–Cu Wyoming bentonite 0.11 –18.02 El-Sayed et al. (1970)
Na–Ca Soils (304 K) 0.49 to 4.53 Gupta et al. (1984)
Na–Li World vermiculite –6.04 –23.15 Gast and Klobe (1971)
Na–Li Wyoming bentonite –0.20 –0.63 Gast and Klobe (1971)
Na–Li Chambers –0.34 –0.47 Gast and Klobe (1971)
montmorillonite
Mg–Ca Soil 1.22 Jensen and Babcock
(1973)
Mg–Ca Kaolinitic soil clay 1.07 6.96 Udo (1978)
(303 K)
Mg–Na Soils 0.72 to 7.27 Mehta et al. (1983)
Mg–Na World vermiculite –1.36 40.22 Wild and Keay (1964)
Mg–NH
4
Camp Berteau 8.58 23.38 Laudelout et al. (1967)
montmorillonite
K–Ca Soils –4.40 to –14.33 Deist and Talibudeen
(1967a)
K–Ca Soil –6.18 Jensen and Babcock
(1973)
K–Ca Soils –7.42 to –14.33 –3.25 to –5.40 Deist and Talibudeen
(1967b)
K–Ca Soil 1.93 –15.90 Jardine and Sparks
(1984b)
Relationship Between Thermodynamics and Kinetics of Ion Exchange 203
Binding strengths of an ion on a soil or soil component exchanger can
be determined from ΔH
0
ex
values. Enthalpy expresses the gain or loss of heat
during the reaction. If the reaction is exothermic, the enthalpy is negative
and heat is lost to the surroundings. If it is endothermic, the enthalpy change
is positive and heat is gained from the surroundings. A negative enthalpy
change implies stronger bonds in the reactants. Enthalpies can be measured
using the van’t Hoff equation (Eq. (6.22)) or one can use calorimetry.
Relationship Between Thermodynamics and
Kinetics of Ion Exchange
Another way that one can obtain thermodynamic exchange parameters is to
employ a kinetic approach (Ogwada and Sparks, 1986b; Sparks, 1989). We
know that if a reaction is reversible, then k
1
/k
–1
= K
ex
, where k
1
is the forward
reaction rate constant and k
–1
is the backward reaction rate constant. However,
this relationship is valid only if mass transfer or diffusion processes are not
rate-limiting; i.e., one must measure the actual chemical exchange reaction
(CR) process (see Chapter 7 for discussion of mass transfer and CR processes).
TABLE 6.4. Standard Gibbs Free Energy of Exchange (ΔG
0
ex
) and Standard Enthalpy of Exchange
(ΔH
0
ex
) Values for Binary Exchange Processes on Soils and Soil Components (contd)
Exchange Exchanger ΔG
0
ex
ΔH
0
ex
Reference
process (kJ mol
–1
) (kJ mol
–1
)
K–Ca Soils 1.10 to –4.70 –3.25 to –5.40 Goulding and
Talibudeen (1984)
K–Ca Soils –4.61 to –4.74 –16.28 Ogwada and Sparks
(1986b)
K–Ca Soil silt 0.36 Jardine and Sparks
(1984b)
K–Ca Soil clay –2.84 Jardine and Sparks
(1984b)
K–Ca Kaolinitic soil clay –6.90 –54.48 Udo (1978)
(303 K)
K–Ca Clarsol –6.26 Jensen (1972)
montmorillonite
K–Ca Danish kaolinite –8.63 Jensen (1972)
K–Mg Soil –4.06 Jensen and Babcock
(1973)
K–Na Soils –3.72 to –4.54 Deist and Talibudeen
(1967a)
K–Na Wyoming bentonite –1.28 –2.53 Gast (1972)
K–Na Chambers –3.04 –4.86 Gast (1972)
montmorillonite
a
Unless specifically noted, the exchange studies were conducted at 298 K.
Ogwada and Sparks (1986b) found that this assumption is not valid for most
kinetic techniques. Only if mixing is very rapid does diffusion become
insignificant, and at such mixing rates one must be careful not to alter the
surface area of the adsorbent. Calculation of energies of activation for the
forward and backward reactions, E
1
and E
–1
, respectively, using a kinetics
approach, are given below:
d ln k
1
/ dT = E
1
/ RT
2
(6.29)
d ln k
–1
/ dT = E
–1
/ RT
2
. (6.30)
Substituting,
d ln k
1
/ dT – d ln k
–1
/ dT = d ln K
ex
/ dT . (6.31)
From the van’t Hoff equation, ΔH
o
ex
can be calculated,
d ln K
ex
/ dT = ΔH
o
ex
/ RT
2
, (6.32)
or
E
1
– E
–1
= ΔH
o
ex
, (6.33)
and ΔG
o
ex
and ΔS
o
ex
can be determined as given in Eqs. (6.21) and (6.24),
respectively.
Suggested Reading
Argersinger, W. J., Jr., Davidson, A. W., and Bonner, O. D. (1950).
Thermodynamics and ion exchange phenomena. Trans. Kans. Acad. Sci.
53, 404–410.
Babcock, K. L. (1963). Theory of the chemical properties of soil colloidal
systems at equilibrium. Hilgardia 34, 417–452.
Gaines, G. L., and Thomas, H. C. (1953). Adsorption studies on clay minerals.
II. A formulation of the thermodynamics of exchange adsorption. J. Chem.
Phys. 21, 714–718.
Goulding, K. W. T. (1983). Thermodynamics and potassium exchange in
soils and clay minerals. Adv. Agron. 36, 215–261.
Jensen, H. E., and Babcock, K. L. (1973). Cation exchange equilibria on a
Yolo loam. Hilgardia 41, 475–487.
Sposito, G. (1981). Cation exchange in soils: An historical and theoretical
perspective. In “Chemistry in the Soil Environment” (R. H. Dowdy,
J. A. Ryan, V. V. Volk, and D. E. Baker, Eds.), Spec. Publ. 40, pp. 13–30.
Am. Soc. Agron./Soil Sci. Soc. Am., Madison, WI.
Sposito, G. (1981). “The Thermodynamics of the Soil Solution.” Oxford
Univ. Press (Clarendon), Oxford.
Sposito, G. (2000). Ion exchange phenomena. In “Handbook of Soil Science”
(M. E. Sumner, Ed.), pp. 241–263. CRC Press, Boca Raton, FL.
204 6 Ion Exchange Processes
Relationship Between Thermodynamics and Kinetics of Ion Exchange 205
Sumner, M. E., and Miller, W. P. (1996). Cation exchange capacity and
exchange coefficients. In “Methods of Soil Analysis, Part 3. Chemical
Methods” (D. L. Sparks, Ed.), Soil Sci. Soc. Am. Book Ser. 5,
pp. 1201–1229. Soil Sci. Soc. Am., Madison, WI.
This Page Intentionally Left Blank