Báo cáo khoa học: "Effects of descending positive end-expiratory pressure on lung mechanics and aeration in healthy anaesthetized piglets" docx
Bạn đang xem bản rút gọn của tài liệu. Xem và tải ngay bản đầy đủ của tài liệu tại đây (613.01 KB, 8 trang )
Open Access
Available online />Page 1 of 8
(page number not for citation purposes)
Vol 10 No 4
Research
Effects of descending positive end-expiratory pressure on lung
mechanics and aeration in healthy anaesthetized piglets
Alysson Roncally S Carvalho
1
, Frederico C Jandre
1
, Alexandre V Pino
2
, Fernando A Bozza
3
,
Jorge I Salluh
4
, Rosana S Rodrigues
5
, João HN Soares
6
and Antonio Giannella-Neto
1
1
Biomedical Engineering Program, COPPE, Federal University of Rio de Janeiro, P.O. Box 68510, 21945-970, Rio de Janeiro, RJ, Brazil
2
Electronic Engineering Department, Catholic University of Pelotas, Rua Félix da Cunha 412, 96010-000, Pelotas, RS, Brazil
3
Clementino Fraga Filho Hospital, ICU, Federal University of Rio de Janeiro, Av. Brigadeiro Trompowsky, s/n°, 21950-900, Rio de Janeiro, RJ, Brazil
4
National Institute of Cancer – 1, ICU, Praça Cruz Vermelha 23, 20230-130, Rio de Janeiro, RJ, Brazil
5
Clementino Fraga Filho Hospital, Radiodiagnostic Service, Federal University of Rio de Janeiro, Av. Brigadeiro Trompowsky, s/n°, 21950-900, Rio
de Janeiro, RJ, Brazil
6
UNIGRANRIO, School of Veterinary Medicine, Rua Professor José de Sousa Herdy 1160, 25071-200, Duque de Caxias, RJ, Brazil
Corresponding author: Antonio Giannella-Neto,
Received: 15 May 2006 Revisions requested: 13 Jun 2006 Revisions received: 11 Aug 2006 Accepted: 23 Aug 2006 Published: 23 Aug 2006
Critical Care 2006, 10:R122 (doi:10.1186/cc5030)
This article is online at: />© 2006 Carvalho et al.; licensee BioMed Central Ltd.
This is an open access article distributed under the terms of the Creative Commons Attribution License ( />),
which permits unrestricted use, distribution, and reproduction in any medium, provided the original work is properly cited.
Abstract
Introduction Atelectasis and distal airway closure are common
clinical entities of general anaesthesia. These two phenomena
are expected to reduce the ventilation of dependent lung
regions and represent major causes of arterial oxygenation
impairment in anaesthetic conditions. The behaviour of the
elastance of the respiratory system (E
rs
), as well as the lung
aeration assessed by computed tomography (CT) scan, was
evaluated during a descendent positive end-expiratory pressure
(PEEP) titration. This work sought to evaluate the potential
usefulness of E
rs
monitoring to set the PEEP in order to prevent
tidal recruitment and hyperinflation of healthy lungs under
general anaesthesia.
Methods PEEP titration (from 16 to 0 cmH
2
O, tidal volume of 8
ml/kg) was performed, and at each PEEP, CT scans were
obtained during end-expiratory and end-inspiratory pauses in six
healthy, anaesthetized and paralyzed piglets. The distribution of
lung aeration was determined and the tidal re-aeration was
calculated as the difference between end-expiratory and end-
inspiratory poorly aerated and normally aerated areas. Similarly,
tidal hyperinflation was obtained as the difference between end-
inspiratory and end-expiratory hyperinflated areas. E
rs
was
estimated from the equation of motion of the respiratory system
during all PEEP titration with the least-squares method.
Results Hyperinflated areas decreased from PEEP 16 to 0
cmH
2
O (ranges decreased from 24–62% to 1–7% at end-
expiratory pauses and from 44–73% to 4–17% at end-
inspiratory pauses) whereas normally aerated areas increased
(from 30–66% to 72–83% at end-expiratory pauses and from
19–48% to 73–77% at end-inspiratory pauses). From 16 to 8
cmH
2
O, E
rs
decreased with a corresponding reduction in tidal
hyperinflation. A flat minimum of E
rs
was observed from 8 to 4
cmH
2
O. For PEEP below 4 cmH
2
O, E
rs
increased in association
with a rise in tidal re-aeration and a flat maximum of the normally
aerated areas.
Conclusion In healthy piglets under a descending PEEP
protocol, the PEEP at minimum E
rs
presented a compromise
between maximizing normally aerated areas and minimizing tidal
re-aeration and hyperinflation. High levels of PEEP, greater than
8 cmH
2
O, reduced tidal re-aeration but increased hyperinflation
with a concomitant decrease in normally aerated areas.
Introduction
It is well known that about 90% of the patients under general
anaesthesia develop atelectasis and airway closure, mainly in
dependent lung regions [1,2]. Muscle paralysis, which
reduces the displacement of the diaphragm in dependent
lung, results in atelectasis and airway closure in anaesthetized
patients [3,4]. This effect is enhanced when large inspiratory
fractions of oxygen are used during anaesthesia [2,5]. The
CT = computed tomography; EEP = end-expiratory pressure; E
rs
= elastance of the respiratory system; FiO
2
= inspiratory oxygen fraction; P
aw
= open-
ing airway pressure; PEEP = positive end-expiratory pressure; R
rs
= resistance of the respiratory system; V
T
= tidal volume; ZEEP = zero end-expiratory
pressure.
Critical Care Vol 10 No 4 Carvalho et al.
Page 2 of 8
(page number not for citation purposes)
anaesthesia-induced changes in pulmonary aeration are highly
correlated with shunt as well as the decrease in the arterial
oxygen tension, and also contribute to postoperative pulmo-
nary complications such as pulmonary infection [2].
The use of recruitment manoeuvres has been proposed, to re-
expand previously collapsed areas, with less deleterious
effects than the institution of a positive end-expiratory pres-
sure (PEEP) [2,6]. However, lung instability during general
anaesthesia may require several recruitment manoeuvres,
resulting in frequent derecruitment-recruitment episodes.
Given that the required pressure to keep an airway or an alve-
olus open is lower than that required to recruit previously col-
lapsed tissue, the administration of a PEEP subsequently to a
recruitment manoeuvre may prevent atelectasis more effec-
tively than just setting a PEEP without previous lung expan-
sion. Simply performing a descending PEEP titration may have
similar effects in healthy lungs, because lower pressures may
be needed to open ventilatory units than those in diseased
lungs.
Nonetheless, setting the PEEP is also difficult, because it
should prevent cyclic derecruitment of alveoli or airways while
keeping the lung open with less overdistension, thus avoiding
tissue stress and damage induced by mechanical ventilation
[7,8]. Focusing on respiratory system mechanical properties,
the best PEEP may be recognized as the pressure for which
the elastance of the respiratory system (E
rs
) is minimal during
a PEEP titration manoeuvre. This approach has been sug-
gested to be easily applicable to the clinical routine, especially
in intensive care units [9].
In the present study, both the behaviour of E
rs
and the lung aer-
ation assessed by computed tomography (CT) scan were
evaluated in healthy anaesthetized and paralyzed piglets, dur-
ing a descending PEEP titration manoeuvre, with a previous
full lung re-aeration. This study sought to evaluate the potential
usefulness of monitoring E
rs
to set the PEEP so as to prevent
tidal recruitment and overdistension of healthy lungs under
general anaesthesia. The correspondences and contrasts
between E
rs
and the distributions of lung aeration, and partic-
ularly the distribution of lung aeration at the PEEP of minimum
elastance, were examined.
Materials and methods
Ethical approval
The protocol was submitted to and approved by the local Eth-
ics Commission for Assessment of Animal Use in Research
(CEUA/FIOCRUZ).
Animal preparation
Six mixed-breed female Landrace/Large White piglets (17 to
20 kg) were medicated with midazolam (Dormire; Cristália,
São Paulo, Brazil) and subsequently intubated and connected
to a mechanical ventilator in the supine position in spontane-
ous mode with a PEEP of 5 cmH
2
O and an inspiratory oxygen
fraction (FiO
2
) of 1.0. A flexible catheter was introduced into
the left femoral artery for continuous pressure monitoring
(model 1290A; Hewlett-Packard, California, USA) and for
blood gas analyses (I-STAT Corp, New Jersey, USA with
EG7+ cartridges), to confirm the health status before the
tests. The right femoral vein was also catheterized for drug
administration. All animals were sedated with a continuous
infusion of ketamine (Ketamina; Cristália, São Paulo, Brazil)
delivered at a rate of 10 mg/kg per hour and paralysed with
pancuronium (Pavulon; Organon Teknika, São Paulo, Brazil) at
2 mg/kg per hour. Invasive arterial blood pressure, electrocar-
diogram and peripheral oxygen saturation (CO2SMO; Dixtal,
São Paulo, Brazil) were monitored continuously throughout
the experiment. Respiratory mechanics was monitored with a
purpose-built device. The opening airway pressure (P
aw
) was
measured by a pressure transducer (163PC01D48; Honey-
well Ltd, Illinois, USA) connected to the endotracheal tube,
and flow was measured with a variable-orifice pneumotachom-
eter (Hamilton Medical, Rhäzüns, Switzerland) connected to a
pressure transducer (176PC07HD2; Honeywell Ltd, Illinois,
USA). Both channels were amplified and filtered with fourth-
order 33 Hz low-pass Butterworth analogue filters. P
aw
, flow
and invasive arterial pressure were digitized into a personal
computer running a program written in LabVIEW (National
Instruments, Texas, USA). The sampling rate was 200 Hz per
channel. The respiratory volume was calculated by numerical
integration of the flow.
Mechanical ventilation settings and PEEP titration
procedure
All animals were ventilated with an Amadeus ventilator (Hamil-
ton Medical, Rhäzüns, Switzerland) in controlled mandatory
ventilation with a square flow waveform. The initial ventilator
settings were FiO
2
1.0, PEEP 5 cmH
2
O, tidal volume (V
T
) 8 ml/
kg, inspiratory:expiratory ratio 1:2 and respiratory rate
between 25 and 30 breaths per minute, to maintain normocap-
nia (arterial partial pressure of CO
2
range 35 to 45 mmHg). On
confirmation of the healthy lung status (arterial partial pressure
of oxygen more than 500 mmHg), a PEEP titration was per-
formed by decreasing PEEP from 16 cmH
2
O to 0 cmH
2
O in
steps of 4 cmH
2
O, except from 8 cmH
2
O to 4 cmH
2
O where
the steps were of 2 cmH
2
O. The time intervals between each
step were 3 minutes, except at a PEEP of 16 cmH
2
O and zero
end-expiratory pressure (ZEEP; 6 minutes each). All parame-
ters were kept constant during the entire PEEP titration. At the
end of the experiment the animals were killed with an intrave-
nous injection of potassium chloride in the presence of deep
sedation.
CT scan procedure and image analysis
Helical CT scans (Asteion, Toshiba, Tokyo, Japan) were
obtained at a fixed anatomic level in the lower lobes of the
lungs, caudal to the heart and cranial to the diaphragm in the
supine position, corresponding to the largest transverse lung
Available online />Page 3 of 8
(page number not for citation purposes)
area. Each scan comprised five to seven thin-section slices (1
mm). The scanning time, tube current and voltage were 1 s,
120 mA and 140 kV, respectively. The actual image matrix was
512 × 512 and the voxel dimensions ranged from 0.22 to 0.29
mm. The scans were obtained at the end of each PEEP step,
during end-expiratory and end-inspiratory pauses of 15 to 20
s (Figure 1).
The images were imported and analysed with a purpose-built
routine written in MatLab (Mathworks). The lung contours,
including the mediastinum, were traced manually to define the
region of interest. The presence of hyperinflation (-1,000 to -
900 Hounsfield units), normally aerated (-900 to -500 Houns-
field units), poorly aerated (-500 to -100 Hounsfield units) and
non-aerated areas (-100 to +100 Hounsfield units) was deter-
mined, in accordance with the classification proposed by Gat-
tinoni and colleagues [10] and Vieira and colleagues [11].
Furthermore, at each PEEP step the tidal re-aeration was cal-
culated as the difference between end-expiratory and end-
inspiratory poorly aerated and non-aerated areas [12]. Simi-
larly, the tidal hyperinflation was obtained by the difference
between end-inspiratory and end-expiratory hyperinflated
areas [10].
To evaluate the cephalo-caudal gradient of aeration [13], a
whole lung scan was performed during the PEEP titration
manoeuvre at ZEEP in end-expiratory pause (one animal) and
at a PEEP of 8 cmH
2
O in end-inspiratory pause (two animals).
The CT scan adjustments were the same as described previ-
ously but with slices 1 mm thick, 10 mm apart from each other.
Attenuation values outside the range -1,000 to +100, which
contributed less than 2% of all counts, were excluded.
Data analysis
The signals of P
aw
, flow and volume were used to obtain the
parameters of the equation of motion of the respiratory system
by least-squares linear regression, considering a linear single-
compartment model (Equation 1):
P
aw
= E
rs
× V(t) + R
rs
× dV(t)/dt + EEP (1)
where R
rs
is the resistance of the respiratory system, V(t) is the
volume, dV(t)/dt is the flow and EEP is the end-expiratory pres-
sure. The regression analysis was performed in MatLab.
Statistical analysis
Data are presented with median and range values, attributed
to the respective PEEP values. The mechanical parameters
(E
rs
, R
rs
and EEP) were calculated on a breath-by-breath basis
from the last minute of each PEEP step, and immediately
before the CT scans. The quality of fitting was assessed by the
coefficient of determination of the regression. The peak and
plateau pressures, as well as the applied PEEP values, were
measured at each PEEP level. A Wilcoxon signed-rank test for
paired samples was applied to compare changes in E
rs
for
each PEEP step as well as changes in lung aeration between
end-expiration and end-inspiration at each PEEP value. In all
tests, p < 0.05 was considered significant.
Results
The data on respiratory mechanics, the estimated elastance
and resistance of the respiratory system and the estimated
PEEP are presented in Table 1.
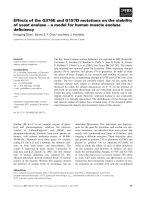
Figure 2 presents the dynamics of the distribution of lung aer-
ation during PEEP titration for all animals, and depicts the aver-
age histograms of tissue densities, during the entire PEEP
titration, at end-expiratory and end-inspiratory pauses. As can
be seen from the graphs, the histograms always presented a
unimodal distribution, and as PEEP decreased, the peak
shifted to the right. The dynamics of the respiratory cycle
resulted in a shift of the histogram from right to left for all levels
of PEEP. Note that only at ZEEP it is possible to observe some
poorly aerated areas that are re-aerated during inspiration.
CT-scan morphological analyses and respiratory
mechanics during PEEP titration
The reduction of PEEP from 16 cmH
2
O to ZEEP resulted in a
decrease in the hyperinflated areas (ranges decreased from
24–62% to 1–7% at end-expiratory pause and from 44–73%
to 4–17% at end-inspiratory pause) while an increase in nor-
mally aerated areas was observed (from 30–66% to 72–83%
at end-expiratory pause and from 19–48% to 73–77% at end-
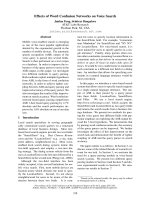
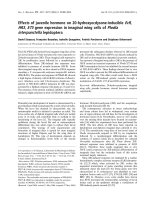
Figure 1
Time plot of airway pressure (P
aw
) during the positive end-expiratory pressure (PEEP) titration procedureTime plot of airway pressure (P
aw
) during the positive end-expiratory
pressure (PEEP) titration procedure. At the end of each PEEP step, a
computed tomography (CT) scan was performed during end-expiratory
and end-inspiratory pauses (CT scan images from a representative ani-
mal are shown).
Critical Care Vol 10 No 4 Carvalho et al.
Page 4 of 8
(page number not for citation purposes)
inspiratory pause). From 6 cmH
2
O to ZEEP, an increase in the
poorly aerated areas was observed (from 3–9% to 10–21% at
end-expiratory pause and from 3–7% to 5–13% at end-inspir-
atory pause) with no change in the non-aerated areas, which
remained below 4% throughout the PEEP titrations (Figure 3).
E
rs
and hyperinflated areas were highest at a PEEP of 16
cmH
2
O. As PEEP decreased, E
rs
reached a flat minimum
between 8 and 4 cmH
2
O (non-significant difference in E
rs
in
the range) and, at ZEEP, E
rs
had a value similar to that seen at
a PEEP of 12 cmH
2
O (not significant).
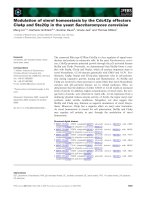
Figure 2
Median lung aeration distribution during positive end-expiratory pressure (PEEP) titrationMedian lung aeration distribution during positive end-expiratory pressure (PEEP) titration. Results are shown for all animals at end-expiratory (open
circles) and end-inspiratory pauses (filled circles) during all PEEP titrations.
Table 1
Respiratory mechanics data and regression parameters
Descending PEEP titration steps
PEEP
appl
(cmH
2
O) 16.4 (16.0–16.7) 12.5 (12.0–12.6) 8.3 (7.9–8.7) 6.3 (6–6.7) 4.1 (3.7–4.6) 0.8 (0.5–1.0)
P
peak
(cmH
2
O) 27.6 (24.4–31.3) 19.4 (18.8–20.6) 15.0 (13.5–17.8) 12.5 (11.4–13.1) 10.4 (9.6–11.2) 8.2 (6.9–10.4)
P
plateau
(cmH
2
O) 24.8 (22.5–28) 18.0 (17.4–19.4) 13.6 (12.3–15) 11.1 (10.3–11.8) 9.0 (8.4–9.8) 6.5 (5.6–7.5)
E
rs
(cm/l) 56.4 (41.7–71.9) 33.6 (30.5–36.8) 29.3 (26.2–32.0) 29.3 (25.0–34.6) 29.6 (27.2–31.6) 36.2 (30.4–42.6)
R
rs
(cmH
2
Ol
-1
s) 7.2 (5.3–8.4) 5.7 (4.9–6.9) 5.8 (5.3–7.0) 6.2 (5.4–7.7) 5.7 (5.3–8.1) 7.1 (6.3–10.1)
PEEP
est
(cmH
2
O) 16.3 (15.9–16.6) 12.3 (12–12.5) 8.1 (7.9–8.6) 6.2 (6.0–6.5) 4.0 (3.8–4) 0.7 (0.4–0.8)
R
2
0.979 (0.968–0.983) 0.978 (0.974–0.982) 0.976 (0.964–0.976) 0.977 (0.964–0.979) 0.977 (0.969–0.979) 0.978 (0.970–0.982)
PEEP
appl
, applied positive end-expiratory pressure; P
peak
, peak ventilator pressure; P
platea
, plateau ventilator pressure; E
rs
, elastance of the
respiratory system; R
rs
, resistance of the respiratory system; PEEP
est
, estimated positive end-expiratory pressure; R
2
, coefficient of determination
of the regression analysis. Data are shown as medians and ranges.
Available online />Page 5 of 8
(page number not for citation purposes)
Figure 4 depicts the dynamics of tidal hyperinflation and re-
aeration of E
rs
as a function of PEEP, during the PEEP titration
manoeuvre.
Figure 5 depicts the whole-lung distribution of lung aeration
assessed by CT scan in one of the studied animals during the
PEEP titration. Each CT scan slice was obtained at a PEEP of
8 cmH
2
O (end-inspiratory pause; Figure 5a) and at ZEEP
(end-expiratory pause; Figure 5b). Note that there are no
cephalo-caudal gradients for the hyperinflated and normally
aerated compartments. However, the poorly aerated areas are
more intense at the diaphragmatic level (marked with crosses).
Discussion
Analysis of CT scans and elastic properties
The main objective of the present study was to evaluate the
potential usefulness of E
rs
monitoring to set the PEEP so as to
prevent tidal recruitment and hyperinflation of healthy lungs
under general anaesthesia. It is clear that the descendent
PEEP titration (measured with a V
T
of 7 to 9 ml/kg) promoted
important changes in lung aeration distribution. In accordance
with previous studies in healthy humans, the histograms of
voxel distribution exhibited a unimodal pattern [14], and as
PEEP decreased, the peak of the histogram shifted to the
right, changing hyperinflated into normally aerated areas, and
part of the latter into poorly aerated areas (Figure 2). High lev-
els of PEEP (more than 8 cmH
2
O) resulted in a large hyperin-
flated area (greater than 30% on average). With a reduction in
PEEP, the hyperinflated areas decreased with a consequent
increase in normally aerated regions (Figure 3, top). Collapsed
areas were never greater than 4% for any level of PEEP, and
the poorly aerated areas increased only when PEEP fell below
6 cmH
2
O, becoming maximum at ZEEP (10 to 21%, during
the end-expiratory pause).
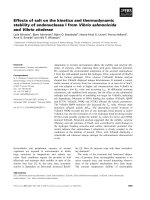
Figure 3
Comparative changes in E
rs
, and morphological analysis by computed tomography scan of the lung compartmentsComparative changes in E
rs
, and morphological analysis by computed tomography scan of the lung compartments. The open and filled circles indi-
cate lung aeration changes at end-expiration and end-inspiration, respectively, and the bars represent the SD. Asterisks indicate a significant differ-
ence between the elastance of the respiratory system (E
rs
) for each positive end-expiratory pressure (PEEP) step (p < 0.05). Daggers indicate
significant difference in lung aeration between end-expiration and end-inspiration at each PEEP (p < 0.05). Dagger and double dagger together indi-
cate a non-significant difference (p = 0.065). The elastance plot is presented twice to allow comparisons between the elastance and the corre-
sponding distribution of aeration.
Critical Care Vol 10 No 4 Carvalho et al.
Page 6 of 8
(page number not for citation purposes)
Interestingly, the hyperinflated areas still appear at ZEEP (0 to
7% at end-expiration and 4 to 17% at end-inspiration). Very
similar amounts of hyperinflated areas have been found by
David and colleagues [15] using a dynamic CT scan tech-
nique in healthy piglets (weight 23 to 27 kg) mechanically ven-
tilated with a PEEP ranging from 0 to 5 cmH
2
O and a V
T
of 12
ml/kg. Probably the supine position of the animals used in the
present study resulted in a dorsal chest wall restriction, reduc-
ing the displacement of dependent regions with a concomitant
hyperinflation in non-dependent lung areas. In fact, the
hyperinflated areas appeared in non-dependent lung regions
for PEEP values below 8 cmH
2
O.
Elastance behaved as expected with descending PEEP [16].
The E
rs
dynamics for all except one animal did not exhibit a
sharp minimum as PEEP decreased. Nevertheless, a region of
PEEP values (4 to 8 cmH
2
O; not significant) was found for
minimal E
rs
. At these and lower PEEP values, the normally aer-
ated areas became maximized and roughly flat, representing
about 80% of the total selected area.
As observed in Figure 4, outside the PEEP of minimal E
rs
, the
increased elastance seemed to correspond to changes in dis-
tinct ventilatory compartments. For PEEPvalues less than 4
cmH
2
O, E
rs
increased concomitantly with an increase in tidal
re-aeration (from 3.5% at a PEEP of 4 cmH
2
O to 6.8% at
ZEEP) and for PEEPvalues more than 8 cmH
2
O, E
rs
and tidal
hyperinflation varied similarly to one another (from 8.0% at a
PEEP of 8 cmH
2
O to 14.8% at 16 cmH
2
O). The physiological
interpretation of these correspondences is straightforward: at
low PEEP, E
rs
increases as a consequence of the derecruit-
ment (and consequent tidal recruitment) of small airways and
alveoli corresponding to the tidal re-aeration seen in the mor-
phological analysis [17]; at high PEEP, E
rs
increases as a
result of alveolar overdistension, reflected as alveolar tidal
hyperinflation [11]. In the region of minimal E
rs
, the tidal re-aer-
ation and hyperinflation areas possibly coexisted in balance,
and this could explain the steady elastance [18]. It has already
been reported elsewhere that normal lungs under general
anaesthesia exhibit coexisting tidal re-aeration and hyperinfla-
tion at a large range of PEEP values [17].
Also interestingly, at ZEEP E
rs
increased to values similar to
those observed at a PEEP of 12 cmH
2
O (Figure 3, left) and
the CT images showed an increase in poorly aerated areas
(reaching 15% of the region of interest); non-aerated areas
remained close to zero. Such findings suggest an alternative
interpretation of the areas classified as poorly aerated for nor-
mal lungs. It is known that each voxel contains hundreds of
alveoli and its image represents an overall behaviour of all
these units; consequently, a collective presence of non-aer-
ated and aerated alveoli in the same voxel may decrease the
gas:tissue ratio but not enough to indicate collapse [19]. In
addition it seems unlikely, as suggested by Malbouisson and
colleagues [12], that the tidal ventilation results in hyperdisten-
sion of normally aerated alveoli without the re-aeration of
closed structures. Note in Figure 3 that at ZEEP the amount of
normally aerated areas did not change during tidal inspiration,
whereas poorly aerated areas decreased with a concomitant
increase in hyperinflated areas. Possibly a part of poorly aer-
ated areas became normally aerated whereas a similar amount
of normally aerated areas became hyperinflated.
The contribution of chest wall elastance was not assessed in
the present study. De Robertis and colleagues [20] suggested
that the chest wall elastance of supine, anaesthetized and par-
alysed young piglets contributes significantly to E
rs
only at low
volume or distending pressures. In view of this, it is possible
that in the present study the increase in E
rs
at PEEP values less
than 4 cmH
2
O might be partly attributed to the chest wall
elastance. Nevertheless, during the six minute step at ZEEP,
all animals presented a slow E
rs
increase that cannot be
explained by changes in chest wall elastance and might be
attributed to the lung component corresponding to the
observed rise on tidal re-aeration (Figure 4). For high PEEP,
the increase in E
rs
is exclusively attributed to the lung compo-
nent [20] and seems to exhibit a particular correspondence to
the magnification of hyperinflated areas.
According to the results presented in this study, for healthy
lungs the institution of a PEEP based on E
rs
monitoring seems
to correspond to the distribution of lung aeration assessed by
CT scan. High levels of PEEP increase hyperinflated areas
with a proportional decrease in normally aerated areas, result-
ing in mechanical stress to the lung parenchyma, which is
probably reflected by the increase in E
rs
.
Figure 4
Elastance of the respiratory system, tidal re-aeration and tidal hyperin-flation as a function of PEEPElastance of the respiratory system, tidal re-aeration and tidal hyperin-
flation as a function of PEEP. Elastance of the respiratory system (E
rs
)
is shown by filled circles, tidal re-aeration by downward triangles, and
tidal hyperinflation by upward triangles. The dashed ellipses indicate
the association between E
rs
and tidal recruitment growth for a positive
end-expiratory pressure (PEEP) below 4 cmH
2
O. The dotted ellipses
indicate the association between E
rs
and tidal hyperinflation growth at a
PEEP of more than 8 cmH
2
O.
Available online />Page 7 of 8
(page number not for citation purposes)
In humans, anaesthesia and paralysis are sufficient to produce
non-aerated areas. These areas were negligible in the present
study, but our results showed, at low PEEP, a progressive
increase in poorly aerated areas and in E
rs
. The institution of
PEEP seemed to re-aerate the poorly aerated areas at the
expense of hyperinflating otherwise normally aerated areas, in
non-dependent lung regions, suggesting that the hidden
effect of PEEP is the overdistension of some alveoli. The bio-
logical cost of these procedures, tidal re-aeration at ZEEP or
hyperinflation caused by the institution of a PEEP, was not
assessed in the present study and remains an open question.
Study limitations
The major limitation of this study is that the lung morphological
analysis was based on a single slice of the CT scan taken at
the juxta-diaphragmatic level. Reber and colleagues [16] offer
data to support the choice of this slice level because the ven-
tral–dorsal gradient seems to be more important than the dia-
phragm–carina gradient in healthy humans mechanically
ventilated in the supine position during general anaesthesia. In
fact, the CT scan slice near the juxta-diaphragmatic level, cho-
sen in the present study as being representative of the whole
lung, is likely to present histograms of densities similar to those
of more apical portions of the lungs (Figure 5). Although the
more caudal histograms skew more towards poorly and non-
aerated areas than the others, they represent just a small
amount of the total lung volume and thus possibly cause minor
contributions to the overall ventilatory behaviour of the respira-
tory system.
The supine position is not physiological for the porcine model,
and this could result in enhanced atelectasis [21]. However, in
the present study the magnitude of non-aerated areas was
always lower than 4%. Possibly the short duration of the
protocol and the descendent PEEP strategy might explain
these results.
The use of the present PEEP titration method can easily be
applied under conditions of anaesthesia; however, as demon-
strated by Suter and colleagues [22], the pressure of minimal
E
rs
is dependent and increases with the magnitude of V
T
. A
fixed small V
T
(such as 7 to 9 ml/kg) during the titration proto-
col is essential to minimize this effect and to prevent the
adjustment of an inadequately low PEEP level.
The temporal effect on lung stability after a titration manoeuvre
was not assessed in the present study. E
rs
may present slow
dynamics until it converges to a stable value [16]. However, in
normal lungs this time may be small, and in the present study
it seemed to be achieved at the end of each PEEP step,
especially for PEEP values ranging from 8 to 4 cmH
2
O. The
need for recruitment manoeuvres after setting the PEEP at the
minimum of the E
rs
was not assessed here; this might merit fur-
ther study.
Pure oxygen was used in the present protocol, an atypical sit-
uation with regard to general anaesthesia. The fact that after 6
minutes of ventilation at ZEEP with pure oxygen the amount of
non-aerated tissue was close to zero could be related to the
limited time of exposure.
Conclusion
In healthy piglets in the supine position, in a protocol of
descendent PEEP, with a previous full lung re-aeration, the
minimum respiratory system elastance corresponded to the
greatest amount of normally aerated areas with approximately
minimal tidal re-aeration and hyperinflation, according to mor-
phologic analysis by CT scan. The E
rs
did not exhibit a sharp
Figure 5
Aeration distribution assessed by whole-lung computed tomography (CT) scan in one animalAeration distribution assessed by whole-lung computed tomography (CT) scan in one animal. The arrow indicates the caudal portion. The CT scan
slice level used in the present study is marked with crosses. Note that poorly aerated areas are more intense at zero end-expiratory pressure near the
diaphragm (CT slices above 30 at panel (b) as compared to panel (a)).
Critical Care Vol 10 No 4 Carvalho et al.
Page 8 of 8
(page number not for citation purposes)
minimum and a range of PEEP from 4 to 8 cmH
2
O was found
for minimal E
rs
. In comparison with ZEEP, the institution of this
range of PEEP seemed to be a compromise to decrease the
poorly aerated areas and tidal re-aeration as well as hyperinfla-
tion and tidal hyperinflation. Increased PEEP progressively
enlarged the hyperinflated areas and tidal hyperinflation.
These results could have implications for general anaesthesia
management in healthy subjects, as far as gas exchange and/
or potential ventilation-associated lung injury are concerned,
and also for post-surgical and critical care.
Competing interests
The authors declare that they have no competing interests.
Authors' contributions
ARSC, FCJ, FAB, JHNS and JS performed the experiments.
ARSC participated in the design of the study, performed the
statistical analysis and wrote the manuscript. FCJ participated
in the design of the study, discussed the results and revised
the manuscript. AVP designed the experimental setup. FAB
and JS participated in the design of the study and discussed
the results. RR established the CT protocol and analysis.
JHNS discussed the results. AG-N conceived and
coordinated the study and helped to write the manuscript. All
authors read and approved the final manuscript.
Acknowledgements
Fabio Ascoli MSc (FIOCRUZ, Rio de Janeiro, RJ, Brazil) helped during
the anaesthetic procedure. This work was partly supported by the Bra-
zilian Agencies CNPq and FAPERJ.
References
1. Brismar B, Hedenstierna G, Lundquist H, Strandberg A, Tokics L:
Pulmonary densities during anesthesia with muscular relaxa-
tion – a proposal of atelectasis. Anesthesiology 1985,
62:422-428.
2. Hedenstierna G, Edmark L: The effects of anesthesia and mus-
cle paralysis on the respiratory system. Intensive Care Med
2005, 31:1327-1335.
3. Froese AB, Bryan AC: Effects of anesthesia and paralysis on
diaphragmatic mechanics in man. Anesthesiology 1974,
41:242-255.
4. Reber A, Nylund U, Hedenstierna G: Position and shape of the
diaphragm: implications for atelectasis formation. Anesthesia
1998, 53:1054-1061.
5. Rothen HU, Sporre B, Engberg G, Wegenius G, Hedenstierna G:
Airway closure, atelectasis and gas exchange during general
anaesthesia. Br J Anaesth 1998, 81:681-686.
6. Hedenstierna G, Rothen HU: Atelectasis formation during
anesthesia: causes and measures to prevent it. J Clin Monit
Comput 2000, 16:329-335.
7. Rouby JJ, Lu Q, Goldstein I: Selecting the right level of positive
end-expiratory pressure in patients with acute respiratory dis-
tress syndrome. Am J Respir Crit Care Med 2002,
165:1182-1186.
8. Rouby JJ, Contantin JM, Girardi CRdA, Zhang M, Qin Lu: Mechan-
ical ventilation in patients with acute respiratory distress
syndrome. Anesthesiology 2004, 101:228-234.
9. Ward NS, Lin D, Nelson DL, Houtchens JM, Schwartz WA, Klinger
JR, Hill NS, Levy MM: Successful determination of lower inflec-
tion point and maximal compliance in a population of patients
with acute respiratory distress syndrome. Crit Care Med 2002,
30:963-968.
10. Gattinoni L, Caironi P, Pelosi P, Goodman LR: What has com-
puted tomography taught us about the acute respiratory dis-
tress syndrome? Am J Respir Crit Care Med 2001,
164:1701-1711.
11. Vieira SR, Puybasset L, Richecoeur J, Lu Q, Cluzel P, Gusman PB,
Coriat P, Rouby JJ: A lung computed tomographic assessment
of positive end-expiratory pressure-induced lung
overdistension. Am J Respir Crit Care Med 1998,
158:1571-1577.
12. Malbouisson LM, Muller JC, Constantin JM, Qin Lu, Puybasset L,
Rouby JJ, CT Scan ARDS Study Group: Computed tomography
assessment of positive end-expiratory pressure-induced alve-
olar recruitment in patients with acute respiratory distress
syndrome. Am J Respir Crit Care Med 2001, 163:1444-1450.
13. Puybasset L, Cluzel P, Chao N, Slutsky A, Coriat P, Rouby JJ, CT
Scan ARDS Study Group: A computed tomography scan
assessment of regional lung volume in acute lung injury. Am
J Respir Crit Care Med 1998, 158:1644-1655.
14. Puybasset L, Cluzel P, Gusman P, Grenier P, Preteux F, Rouby JJ:
Regional distribution of gas and tissue in acute respiratory
distress syndrome. I. Consequences for lung morphology. CT
Scan ARDS Study Group. Intensive Care Med 2000,
26:857-869.
15. David M, Karmrodt J, Bletz C, David S, Herweling A, Kauczor HU,
Markstaller K: Analysis of atelectasis, ventilated, and hyperin-
flated lung during mechanical ventilation by dynamic CT.
Chest 2005, 128:3757-3770.
16. Jandre FC, Pino AV, Lacorte I, Soares JHN, Giannella-Neto A: A
closed-loop mechanical ventilation controller with explicit
objective functions. IEEE Trans Biomed Eng 2004, 51:823-831.
17. Reber A, Engberg G, Sporre B, Kviele L, Rothen HU, Wegenius G,
Nylund U, Hedenstierna G: Volumetric analysis of aeration in
the lungs during general anaesthesia. Br J Anaesth 1996,
76:760-766.
18. Rouby JJ, Lu Q, Vieira S: Pressure/volume curves and lung
computed tomography in acute respiratory distress
syndrome. Eur Respir J Suppl 2003, 22:27s-36.
19. Vieira S, Nieszkowska A, Qin Lu, Elman M, Sartorius A, Rouby JJ:
Low spatial resolution computed tomography underestimates
lung overinflation resulting from positive pressure ventilation.
Crit Care Med 2005, 33:741-749.
20. De Robertis E, Liu JM, Blomquist S, Dahm PL, Thorne J, Jonson B:
Elastic properties of the lung and the chest wall in young and
adult healthy pigs. Eur Respir J 2001, 17:703-711.
21. Klingstedt C, Hedenstierna G, Baehrendtz S, Lundqvist H, Strand-
berg A, Tokics L, Brismar B: Ventilation-perfusion relationships
and atelectasis formation in the supine and lateral positions
during conventional mechanical and differential ventilation.
Acta Anaesthesiol Scand 1990, 34:421-429.
22. Suter PM, Fairley HB, Isenberg MD: Effect of tidal volume and
positive end-expiratory pressure on compliance during
mechanical ventilation. Chest 1978, 73:158-162.
Key messages
• Atelectasis and intermittent closure of distal airways are
common clinical occurrences during general anaesthe-
sia.
• The administration of a PEEP titrated in a descent
manoeuvre may prevent cyclic re-aeration.
• The PEEP at minimum E
rs
presented a compromise
between maximizing normally aerated areas and mini-
mizing tidal re-aeration and hyperinflation.
• High levels of PEEP, greater than 8 cmH
2
O, reduced
tidal re-aeration but enlarged hyperinflation with an
attendant decrease in normally aerated areas.

![Báo cáo khoa học: Epoxidation of benzo[a]pyrene-7,8-dihydrodiol by human CYP1A1 in reconstituted membranes Effects of charge and nonbilayer phase propensity of the membrane pot](https://media.store123doc.com/images/document/14/rc/ld/medium_ldo1394248806.jpg)