Báo cáo khoa học: "Comparison of uncalibrated arterial waveform analysis in cardiac surgery patients with thermodilution cardiac output measurements" doc
Bạn đang xem bản rút gọn của tài liệu. Xem và tải ngay bản đầy đủ của tài liệu tại đây (465.74 KB, 10 trang )
Open Access
Available online />Page 1 of 10
(page number not for citation purposes)
Vol 10 No 6
Research
Comparison of uncalibrated arterial waveform analysis in cardiac
surgery patients with thermodilution cardiac output
measurements
Michael Sander
1
, Claudia D Spies
1
, Herko Grubitzsch
2
, Achim Foer
1
, Marcus Müller
1
and
Christian von Heymann
1
1
Department of Anesthesiology and Intensive Care Medicine, Charité University Medicine Berlin, Charité Campus Mitte, Campus Virchow Klinikum,
Charitéplatz 1, 10117 Berlin, Germany
2
Department of Cardiovascular Surgery, Charité University Medicine Berlin, Campus Charité Mitte, Charitéplatz 1, 10117 Berlin, Germany
Corresponding author: Michael Sander,
Received: 7 Jun 2006 Revisions requested: 28 Jun 2006 Revisions received: 30 Aug 2006 Accepted: 21 Nov 2006 Published: 21 Nov 2006
Critical Care 2006, 10:R164 (doi:10.1186/cc5103)
This article is online at: />© 2006 Sander et al.; licensee BioMed Central Ltd.
This is an open access article distributed under the terms of the Creative Commons Attribution License ( />),
which permits unrestricted use, distribution, and reproduction in any medium, provided the original work is properly cited.
Abstract
Introduction Cardiac output (CO) monitoring is indicated only
in selected patients. In cardiac surgical patients, perioperative
haemodynamic management is often guided by CO
measurement by pulmonary artery catheterisation (CO
PAC
).
Alternative strategies of CO determination have become
increasingly accepted in clinical practice because the benefit of
guiding therapy by data derived from the PAC remains to be
proven and less invasive alternatives are available. Recently, a
device offering uncalibrated CO measurement by arterial
waveform analysis (CO
Wave
) was introduced. As far as this
approach is concerned, however, the validity of the CO
measurements obtained is utterly unclear. Therefore, the aim of
this study was to compare the bias and the limits of agreement
(LOAs) (two standard deviations) of CO
Wave
at four specified
time points prior, during, and after coronary artery bypass graft
(CABG) surgery with a simultaneous measurement of the gold
standard CO
PAC
and aortic transpulmonary thermodilution CO
(CO
Transpulm
).
Methods Data from 30 patients were analysed during this
prospective study. CO
PAC
, CO
Transpulm
, and CO
Wave
were
determined in all patients at four different time points prior,
during, and after CABG surgery. The CO
PAC
and the CO
Transpulm
were measured by triple injection of 10 ml of iced isotone
sodium chloride solution into the central venous line of the PAC.
Measurements of CO
Wave
were simultaneously taken at these
time points.
Results The overall correlation showed a Spearman correlation
coefficient between CO
PAC
and CO
Wave
of 0.53 (p < 0.01) and
0.84 (p < 0.01) for CO
PAC
and CO
Transpulm
. Bland-Altman
analysis showed a mean bias and LOAs of 0.6 litres per minute
and -2.2 to +3.4 litres per minute for CO
PAC
versus CO
Wave
and
-0.1 litres per minute and -1.8 to +1.6 litres per minute for
CO
PAC
versus CO
Transpulm
.
Conclusion Arterial waveform analysis with an uncalibrated
algorithm CO
Wave
underestimated CO
PAC
to a clinically relevant
extent. The wide range of LOAs requires further evaluation.
Better results might be achieved with an improved new
algorithm. In contrast to this, we observed a better correlation of
thermodilution CO
Transpulm
and thermodilution CO
PAC
measurements prior, during, and after CABG surgery.
Introduction
Advanced haemodynamic monitoring is indicated only in
selected patients. In cardiac surgical patients, perioperative
haemodynamic management is often guided by cardiac output
(CO) measurement using the pulmonary artery catheter
(PAC). The use of the PAC, however, has been decreasing
over the last years in surgical and cardiac surgical patients as
the benefit of guiding therapy is doubtful. Furthermore, its
usage might even be associated with increased morbidity [1].
Other randomised studies did not provide clear evidence of
CABG = coronary artery bypass graft; CO = cardiac output; CO
PAC
= pulmonary artery catheter thermodilution cardiac output; CO
Transpulm
= aortic
transpulmonary thermodilution cardiac output; CO
Wave
= uncalibrated pulse contour cardiac output; CPB = cardiopulmonary bypass; ICU = intensive
care unit; LOA = limit of agreement; PAC = pulmonary artery catheter; SD = standard deviation.
Critical Care Vol 10 No 6 Sander et al.
Page 2 of 10
(page number not for citation purposes)
benefit or harm by managing critically ill patients with a PAC
[2,3]. Only some studies showed beneficial effect by guiding
the therapy by PAC-derived data [4]. Therefore, alternative
strategies have been developed to measure CO. Aortic
transpulmonary thermodilution (CO
Transpulm
), a less invasive
technique for determination of the CO, has become increas-
ingly accepted in clinical practice [5-7]. Several investigators
established a good correlation between these two methods of
CO determination [5-8]. Most devices using transpulmonal
thermodilution for CO determination also offer continuous CO
determination by arterial pulse contour analysis. In these
devices, the initial thermodilution measurement is used to cal-
ibrate the algorithm for the continuous CO measurement. Sev-
eral methodological improvements of the algorithm [9,10]
constituted the monitoring of the CO by calibrated continuous
arterial pulse contour analysis as an alternative to PAC ther-
modilution CO (CO
PAC
) in cardiac surgical patients [5,11],
showing an accuracy comparable to that of pulmonary artery
thermodilution [6,11,12].
Recently, a device offering uncalibrated CO measurement by
arterial waveform analysis (CO
Wave
) (Vigileo; Edwards Lifesci-
ences LLC, Irvine, CA, USA) was introduced. As far as this
approach is concerned, however, the validity of the CO meas-
urements obtained is utterly unclear. The software of this
device calculates CO every 20 seconds on the basis of the
last 20-second interval of arterial waveform analysis. The cali-
bration coefficient adjusting for individual characteristics of
the vascular resistance and the arterial compliance is re-calcu-
lated every 10 minutes on the basis of demographic data and
the arterial waveform analysis.
Therefore, the aim of this study was to compare the bias and
the limits of agreement (LOAs) (two standard deviations
[SDs]) of CO
Wave
at four specified time points prior, during,
and after coronary artery bypass graft (CABG) surgery with a
simultaneous gold standard thermodilution measurement of
CO
PAC
and the thermodilution measurement of CO
Transpulm
.
Materials and methods
Patients
After ethical committee approval and written informed con-
sent, 30 patients were considered eligible for this clinical trial
from January to April 2006. Inclusion criteria were age more
than 18 years and less than 80 years and elective CABG sur-
gery. Exclusion criteria were withdrawal of consent, valve
pathologies, left ventricular ejection fraction less than 40%,
and symptomatic peripheral artery disease.
Perioperative management
Oral premedication was with midazolam 0.1 mg/kg. A radial
artery was placed in all patients prior to induction of anaesthe-
sia. After induction, a femoral artery was cannulated with a 4-
French cannula (Pulsiocath; Pulsion Medical Systems AG,
Munich, Germany). A central venous catheter and a PAC (ther-
modilution catheter; Arrow International, Inc., Reading, PA,
USA) were inserted via the right internal jugular vein.
General anaesthesia was induced with etomidate 0.2 mg/kg,
fentanyl 5 μg/kg, and pancuronium 0.1 mg/kg. Maintenance
was with infusion of fentanyl 5 to 10 μg/kg per hour, boluses
of midazolam 0.1 mg/kg, pancuronium 0.03 mg/kg, and 0.6%
to 1% end-tidal isoflurane. All patients were ventilated with an
oxygen-air mixture (FiO
2
[inspiratory oxygen fraction] 0.5) to
maintain an end-tidal pCO
2
(partial pressure of carbon dioxide)
of 35 to 45 mm Hg. Cardiopulmonary bypass (CPB) tech-
nique was normothermic using intermittent antegrade warm
blood cardioplegia as described by Calafiore and colleagues
[13]. Transfusion management was performed according to
our standard operating procedure [14]. Durations of anaesthe-
sia, surgery, and aortic occlusion and number of CABGs were
recorded.
Determination of CO
CO was determined at four time points. The first measurement
was performed after induction of anaesthesia and placement
of the catheters. The second measurement was performed 15
minutes after sternotomy prior to CPB. The third and fourth
measurements were performed one hour after admission to
the intensive care unit (ICU) and six hours after admission to
the ICU, respectively. A stable haemodynamic condition was a
prerequisite for the measurements. Therefore, infusion of large
volumes of colloids or cristalloids or the bolus administration
of vasopressors was not permitted during the measurements.
The CO
PAC
and the CO
Transpulm
were measured by triple injec-
tion of 10 ml of iced isotone sodium chloride solution into the
central venous line of the PAC. The CO
PAC
and the CO
Transpulm
were calculated by commercially available monitors (CCO
module, Solar 8000; Marquette Hellige GmbH, Freiburg, Ger-
many, and PiCCO CCO monitor; Pulsion Medical Systems
AG, München, Germany). In case of a deviation of more than
10% of a measurement, five measurements were performed
and the highest and lowest were rejected. The CO
PAC
and the
CO
Transpulm
measurements were carried out simultaneously.
The measurement of CO
Wave
was performed by arterial wave-
form analysis without any external calibration by using a com-
mercially available transducer (FloTrac; Edwards Lifesciences
LLC), which links the radial arterial line with the monitor (Vig-
ileo; Edwards Lifesciences LLC). A stable haemodynamic
condition with no damping of the arterial pressure line, which
could be achieved in all patients, was also a prerequisite for
this measurement. For each measurement of CO
PAC
and
CO
Transpulm
, a corresponding simultaneous CO
Wave
was
documented.
Statistical analysis
All data are expressed as mean and standard error of the
mean. Statistical analysis was performed by linear regression
analysis. Bias and LOAs (two SDs) were assessed according
Available online />Page 3 of 10
(page number not for citation purposes)
to the method described by Bland and Altman [15]. The per-
centage error was calculated according to the method
described by Critchley and Critchley [16]. All numerical calcu-
lations were carried out with SPSS for Windows, Release
11.5.1 (SPSS Inc., Chicago, IL, USA).
Results
During this study, we evaluated CO using three different meth-
ods. To do so, we performed 120 measurements of CO in 30
patients at four different time points. In one patient, inserting
the PAC was impossible. In another patient, we were unable
to place the arterial thermodilution catheter. Due to technical
problems with the transducer, the uncalibrated arterial wave-
form CO could not be analysed in six measurements in five
patients. In one patient, postoperative measurements were
impossible because this patient received an intra-aortic bal-
loon pump for weaning from CPB. As a result, we were able to
analyse 110 paired measurements comparing CO
PAC
with
CO
Transpulm
and 108 paired measurements comparing CO
PAC
with CO
Wave
.
Anaesthesia and surgery were uncomplicated in all patients.
Patients' basic characteristics are given in Table 1. Surgery-
and ICU-related data are also provided in Table 1. Haemody-
namic data are provided in Table 2. Heart rate increased sig-
nificantly at all points of measurement compared with baseline
values (p < 0.01). Only prior to CPB was the central venous
pressure significantly decreased compared with the baseline
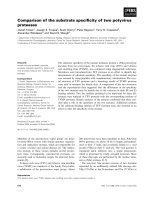
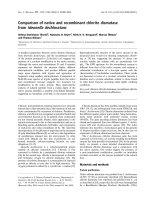
measurement (p = 0.04). The overall correlation between
CO
PAC
and CO
Wave
was 0.53 (p < 0.01) (Figure 1), whereas
the overall correlation between CO
PAC
and CO
Transpulm
was
0.84 (p < 0.01) (Figure 1). Bland-Altman analysis showed a
mean bias and LOAs of 0.6 litres per minute and -2.2 to +3.4
litres per minute for CO
PAC
versus CO
Wave
(Figure 1) and -0.1
litres per minute and -1.8 to +1.6 litres per minute for CO
PAC
versus CO
Transpulm
. The percentage errors for CO
PAC
versus
CO
Wave
and for CO
PAC
versus CO
Transpulm
were 54% and
30%, respectively.
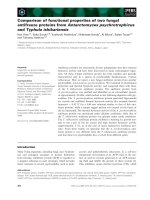
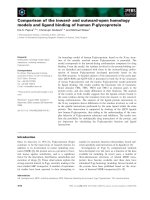
Prior to surgery, CO
PAC
and CO
Wave
showed a correlation
coefficient of 0.54 (p < 0.01) and CO
PAC
and CO
Transpulm
a
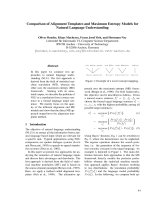
coefficient of 0.78 (p < 0.01) (Figure 2). Bland-Altman analysis
for CO
PAC
versus CO
Wave
showed a mean bias and LOAs of
0.2 litres per minute and -2.6 to +3.0 litres per minute and
CO
PAC
versus CO
Transpulm
of 0.2 litres per minute and -1.2 to
+1.6 litres per minute (Figure 3). The percentage errors for
CO
PAC
versus CO
Wave
and for CO
PAC
versus CO
Transpulm
were
58% and 32%, respectively. There was no correlation
between CO
PAC
and CO
Wave
(correlation coefficient of 0.29)
(Figure 2), whereas the correlation coefficient between CO
PAC
and CO
Transpulm
prior to CPB was 0.74 (p < 0.01). At this time
point, the Bland-Altman analysis showed a mean bias and
LOAs of +1.0 litres per minute and -2.6 to +4.6 litres per
minute for CO
PAC
versus CO
Wave
and 0.1 litres per minute and
-1.3 to +1.5 litres per minute for CO
PAC
versus CO
Transpulm
(Figure 3). The percentage errors for CO
PAC
versus CO
Wave
and for CO
PAC
versus CO
Transpulm
were 70% and 25%,
respectively.
After admission to the ICU, CO
PAC
versus CO
Wave
and CO
PAC
versus CO
Transpulm
showed a reasonable correlation, with cor-
relation coefficients of 0.69 (p < 0.01) and 0.68 (p < 0.01),
respectively (Figure 2). Bland-Altman analysis established a
Table 1
Patients' basic characteristics and surgery-related data
n Mean SD
Age (years) 30 67 7.6
Gender (male/female) 30 24/6
Height (cm) 30 173 8.9
Weight (kg) 30 82 9.3
Body mass index (kg/m
2
)30 27 2.8
Urine volume during CPB (ml) 30 391 185
Urine volume during surgery (ml) 30 1,030 324
Duration of anaesthesia (minutes) 30 312 56
Duration of surgery (minutes) 30 208 52
CPB time (minutes) 30 91 29
Aortic cross-clamp time (minutes) 30 55 23
APACHE II score 30 16 6
APACHE, acute physiology and chronic health evaluation; CPB, cardiopulmonary bypass; SD, standard deviation.
Critical Care Vol 10 No 6 Sander et al.
Page 4 of 10
(page number not for citation purposes)
Table 2
Haemodynamic data
n Mean SD
After induction of anaesthesia
Heart rate (beats per minute) 30 69 16
MAP (mm Hg) 30 71 15
PMAP (mm Hg) 30 19 5
CVP (mm Hg) 30 9 5
PVR (dyn/s per cm
-5
) 30 184 245
SVR (dyn/s per cm
-5
) 30 1,031 342
CO
PAC
30 4.79 1.23
CO
Wave
30 4.66 1.52
CO
Transpulm
30 4.50 1.07
After sternotomy
Heart rate (beats per minute) 30 76* 12
MAP (mm Hg) 30 68 13
PMAP (mm Hg) 30 19 5
CVP (mm Hg) 30 7* 4
PVR (dyn/s per cm
-5
) 30 325 492
SVR (dyn/s per cm
-5
) 30 945 338
CO
PAC
30 5.74 1.73
CO
Wave
30 4.69 1.44
CO
Transpulm
30 5.48 1.53
One hour after admission to ICU
Heart rate (beats per minute) 30 79* 15
MAP (mm Hg) 30 72 13
PMAP (mm Hg) 30 21 6
CVP (mm Hg) 30 9 5
PVR (dyn/s per cm
-5
) 30 225 463
SVR (dyn/s per cm
-5
) 30 938 220
CO
PAC
30 5.75 1.41
CO
Wave
30 5.02 1.04
CO
Transpulm
30 6.01 1.41
Six hours after admission to ICU
Heart rate (beats per minute) 30 81* 13
MAP (mm Hg) 30 73 10
PMAP (mm Hg) 30 21 7
CVP (mm Hg) 30 9 5
PVR (dyn/s per cm
-5
) 30 128 48
SVR (dyn/s per cm
-5
) 30 914 280
CO
PAC
30 6.03 1.34
Available online />Page 5 of 10
(page number not for citation purposes)
mean bias and LOAs of 0.7 litres per minute and -1.3 to +2.7
litres per minute versus -0.4 litres per minute and -2.6 to +1.8
litres per minute, respectively (Figure 3). The percentage
errors for CO
PAC
versus CO
Wave
and for CO
PAC
versus
CO
Transpulm
were 36% and 36%, respectively. Six hours after
ICU admission, the comparison of CO
PAC
versus CO
Wave
and
CO
PAC
versus CO
Transpulm
resulted in correlation coefficients of
0.36 (not significant) and 0.88 (p < 0.01), respectively (Figure
2). Bland-Altman analysis showed a mean bias and LOAs of -
0.5 litres per minute and -1.7 to +0.7 litres per minute versus
0.6 litres per minute and -2.2 to +3.4 litres per minute, respec-
tively (Figure 3). The percentage errors for CO
PAC
versus
CO
Wave
and for CO
PAC
versus CO
Transpulm
were 48% and
19%, respectively.
The change in CO between two subsequent measurements
prior to surgery and prior to CPB, prior to CPB and admission
to the ICU, and between admission to the ICU and six hours
later were, for CO
PAC
, 1.2 (1.5), -0.2 (1.8), and 0.3 (1.4),
respectively. The changes for CO
Wave
were 0.4 (2.0), 0.4
(1.4), and 0.2 (1.3), respectively. For the change of
CO
Transpulm
, the corresponding values were 1.3 (1.6), 0.4
(1.6), and 0.3 (1.4), respectively. Correlation coefficients of
the change in CO
PAC
versus CO
Wave
and CO
PAC
versus
CO
Transpulm
between measurements prior to surgery and prior
to CPB were 0.55 (p < 0.01) and 0.82 (p < 0.01), respec-
tively. Between measurements prior to CPB and admission to
the ICU, the coefficients were 0.51 (p = 0.2) and 0.67 (p <
0.01), respectively, and 0.60 (p < 0.01) and 0.44 (p = 0.05),
respectively, for measurements between admission to the ICU
and six hours later.
Discussion
This is the first study evaluating a new method of estimating
uncalibrated arterial waveform CO in comparison with two
standard methods of CO determination. The most important
finding of our study was that intraoperative and early postop-
erative CO measurements by the uncalibrated arterial wave-
form analysis showed a high bias and a wide range of LOAs in
comparison with the CO
PAC
measurement, which was the ref-
erence method in this study. In contrast, we found a better cor-
relation between CO
PAC
and transpulmonal thermodilution
CO measurement CO
Transpulm
.
In this study, we evaluated the FloTrac sensor and the Vigileo
monitor system for continuous monitoring of CO. This system
does not require thermodilution or dye dilution. Rather, it
bases its calculations on arterial waveform characteristics in
conjunction with patient demographic data. The software for
this device calculates CO every 20 seconds on the basis of
the last 20-second interval of arterial waveform analysis. The
calibration coefficient adjusting for individual characteristics of
the vascular resistance and the arterial compliance is re-calcu-
lated every 10 minutes on the basis of demographic data and
the arterial waveform analysis. In contrast to similar devices
analysing the arterial waveform, this device does not require
calibration with another method [17] and uses a radial artery
only. So far, however, there have not been any controlled peer-
reviewed studies comparing this method with standard meth-
ods of CO determination.
This trial investigated the validity of continuous CO measure-
ment by uncalibrated arterial waveform analysis compared
with standard techniques (CO
PAC
and CO
Transpulm
) prior, dur-
ing, and after CABG surgery. We could demonstrate that all
techniques of CO measurement have their technical limita-
tions, including difficulties with correct catheter placement,
transducer malfunction, and CO monitor malfunction. In our
intraoperative and early postoperative setting in patients
undergoing cardiac surgery, we found the use of the PAC with
fast determination of the CO by thermodilution and high preci-
sion within one set of measurement was the best alternative of
CO determination. The main practical advantage of CO
Wave
measurement in this setting is that it is a quick and easy way
of determining CO. The algorithm of the CO monitor automat-
ically starts to determine the CO by continuous arterial wave-
form analysis in all patients with pulsatile flow. Therefore, in the
setting of CABG surgery, haemodynamic monitoring using a
pulse contour device with a fast and continuous approach
might be practical and advantageous for haemodynamic-ori-
ented therapy. The anaesthetist can direct his/her full attention
on vasoactive and volume therapy, which might sometimes be
necessary in unstable CABG patients in the perioperative
period, rather than be involved in cumbersome, time-consum-
ing, intermitted thermodilution techniques of CO
determination. These advantages are, however, only relevant if
the data obtained are valid.
Overall analysis of all CO
Wave
measurements pooled failed to
show a clinically acceptable correlation and LOAs in compar-
ison with the total of CO
PAC
measurements. We were unable
to show a reliable correlation between CO
PAC
and CO
Wave
CO
Wave
30 5.25 1.11
CO
Transpulm
30 6.33 1.51
*significant change compared to baseline. CO
PAC
, pulmonary artery catheter thermodilution cardiac output; CO
Transpulm
, aortic transpulmonary
thermodilution cardiac output; CO
Wave
, uncalibrated pulse contour cardiac output; CVP, central venous pressure; ICU, intensive care unit; MAP,
mean arterial pressure; PMAP, peripheral mean arterial pressure; PVR, pulmonary vascular resistance; SD, standard deviation; SVR, systemic
vascular resistance.
Table 2 (Continued)
Haemodynamic data
Critical Care Vol 10 No 6 Sander et al.
Page 6 of 10
(page number not for citation purposes)
prior to CPB and six hours after admission to the ICU. The best
correlation was observed one hour after admission to the ICU,
with a correlation coefficient of 0.68. Even at this time point,
however, the bias and the LOAs were unacceptably high (0.7
litres per minute and -1.3 to +2.7 litres per minute). This was,
however, the only time point when the bias and the LOAs
between CO
PAC
and CO
Transpulm
were also unacceptably high
(-0.4 litres per minute and -2.6 to +1.8 litres per minute). All
other measurements between CO
PAC
and CO
Transpulm
showed
clinically acceptable bias and LOAs. As far as we know, there
are no other controlled studies investigating uncalibrated arte-
rial waveform analysis in comparison with standard methods of
CO determination.
Pulse contour analysis CO has been established as a valid and
cost-effective device for CO determination after calibration
[18,19]. Most devices providing continuous pulse contour
analysis, however, need calibration by an independent method
of CO measurement. After calibration by either thermodilution
or lithium dilution CO measurement, pulse contour CO algo-
rithms displayed a clinically acceptable bias and LOAs
[6,18,20].
Previous investigations with calibrated pulse contour analysis
showed only a reasonable correlation with thermodilution
methods of CO determination, with a bias and LOAs of -0.2
litres per minute and -2.2 to +2.6 litres per minute after cardiac
surgery [6]. Therefore, we suggest that CO determination with
pulse contour analysis in a setting after cardiac surgery might
not be the ideal method [21]. Uncalibrated arterial waveform
analysis in this setting might even yield worse results. This
conclusion is in line with our findings.
We compared overall calibrated CO
Transpulm
measurement per-
formed by aortic transpulmonary CO determination with over-
all CO
PAC
. We found a better correlation between the
CO
Transpulm
and the CO
PAC
[5,6,22] with the exception of the
time point one hour after admission to the ICU. The greater
scatter between the two CO measurements after admission to
the ICU compared with all other measurements may have been
Figure 1
Regression analysis and Bland-Altman plots of CO
PAC
versus CO
Wave
and of CO
PAC
versus CO
Transpulm
for overall measurementsRegression analysis and Bland-Altman plots of CO
PAC
versus CO
Wave
and of CO
PAC
versus CO
Transpulm
for overall measurements. CO
PAC
, pulmonary
artery catheter thermodilution cardiac output; CO
Transpulm
, aortic transpulmonary thermodilution cardiac output; CO
Wave
, uncalibrated pulse contour
cardiac output.
Available online />Page 7 of 10
(page number not for citation purposes)
Figure 2
Regression analysis and Bland-Altman plots of CO
PAC
versus CO
Wave
and of CO
PAC
versus CO
Transpulm
for each individual point of measurementRegression analysis and Bland-Altman plots of CO
PAC
versus CO
Wave
and of CO
PAC
versus CO
Transpulm
for each individual point of measurement.
CO
PAC
, pulmonary artery catheter thermodilution cardiac output; CO
Transpulm
, aortic transpulmonary thermodilution cardiac output; CO
Wave
, uncali-
brated pulse contour cardiac output; CPB, cardiopulmonary bypass; 1 h ICU, one hour after admission to the intensive care unit; 6 h ICU, six hours
after admission to the intensive care unit.
Critical Care Vol 10 No 6 Sander et al.
Page 8 of 10
(page number not for citation purposes)
Figure 3
Bland-Altman plots of CO
PAC
versus CO
Wave
and of CO
PAC
versus CO
Transpulm
for each individual point of measurementBland-Altman plots of CO
PAC
versus CO
Wave
and of CO
PAC
versus CO
Transpulm
for each individual point of measurement. CO
PAC
, pulmonary artery
catheter thermodilution cardiac output; CO
Transpulm
, aortic transpulmonary thermodilution cardiac output; CO
Wave
, uncalibrated pulse contour cardiac
output; CPB, cardiopulmonary bypass; 1 h ICU, one hour after admission to the intensive care unit; 6 h ICU, six hours after admission to the intensive
care unit.
Available online />Page 9 of 10
(page number not for citation purposes)
the influx of cooler blood derived from compartments, which
might be hypoperfused during and early after CPB and then
reperfused during the first hours after surgery as suggested by
previous investigators [5,23]. A decrease in body temperature
worsens the signal-to-noise ratio of the thermal indicator used
for determination of the CO by these methods. In this setting,
better results might be achieved by using an indicator inde-
pendent from thermal signals.
A limitation of our study concept is that we do not know the
'true' CO. Bearing in mind, however, that we did find a rather
good correlation for the two thermodilution measurements, we
assume that thermodilution-derived CO determination repre-
sents a reliable estimation of the 'true' CO in clinical practice.
The use of the radial artery for CO
Wave
determination, which
was in line with the recommendations of the manufacturer,
might have influenced the accuracy of the CO determination
due to vasoconstriction. However, because no patient
received continuous norepinephrine, we suggest that vaso-
constriction might not be the main factor influencing the accu-
racy of the CO determination with this method.
Conclusion
Our study of arterial waveform analysis with an uncalibrated
algorithm showed that CO
Wave
underestimated CO
PAC
to a
clinically relevant extent in the difficult setting prior, during, and
early after CABG surgery with the software used in this study.
The wide range of LOAs requires further evaluation. In contrast
to this, we observed a better correlation of calibrated
CO
Transpulm
and CO
PAC
measurements prior, during, and after
CABG surgery.
The bias and LOAs of CO
Wave
need to be evaluated in different
settings against standard methods of CO measurements to
prevent patients from being exposed to wrong therapeutic
decisions. However, the new software version of this device,
featuring a shorter recalibration period, might lead to better
results and has to be re-evaluated in this setting.
Competing interests
This study was financially supported by Edwards Lifesciences
LLC.
Authors' contributions
MS and CvH prepared the manuscript, carried out the cardiac
output measurements, conceived the study, and performed
the statistical analysis. AF and MM helped with the recruitment
of the patients and the drafting of the manuscript. HG partici-
pated in the study design and helped with the recruitment of
patients. CS drafted the manuscript and helped with the study
design and coordination. All authors read and approved the
final manuscript.
Acknowledgements
The authors appreciate the diligent linguistic revision of this manuscript
by Mrs. Sirka Sander, sworn and certified translator of the English lan-
guage. This study was financially supported by an unrestricted research
grant from Edwards Lifesciences LLC, departmental funding, and insti-
tutional research grants of the Charité Medical School (Charité Univer-
sitätsmedizin Berlin).
References
1. Connors AF Jr, Speroff T, Dawson NV, Thomas C, Harrell FE Jr,
Wagner D, Desbiens N, Goldman L, Wu AW, Califf RM, et al.: The
effectiveness of right heart catheterization in the initial care of
critically ill patients. SUPPORT Investigators. JAMA 1996,
276:889-897.
2. Richard C, Warszawski J, Anguel N, Deye N, Combes A, Barnoud
D, Boulain T, Lefort Y, Fartoukh M, Baud F, et al.: Early use of the
pulmonary artery catheter and outcomes in patients with
shock and acute respiratory distress syndrome: a randomized
controlled trial. JAMA 2003, 290:2713-2720.
3. Harvey S, Harrison DA, Singer M, Ashcroft J, Jones CM, Elbourne
D, Brampton W, Williams D, Young D, Rowan K: Assessment of
the clinical effectiveness of pulmonary artery catheters in
management of patients in intensive care (PAC-Man): a ran-
domised controlled trial. Lancet 2005, 366:472-477.
4. Polonen P, Ruokonen E, Hippelainen M, Poyhonen M, Takala J: A
prospective, randomized study of goal-oriented hemodynamic
therapy in cardiac surgical patients. Anesth Analg 2000,
90:1052-1059.
5. Rauch H, Muller M, Fleischer F, Bauer H, Martin E, Bottiger BW:
Pulse contour analysis versus thermodilution in cardiac sur-
gery patients. Acta Anaesthesiol Scand 2002, 46:424-429.
6. Godje O, Hoke K, Goetz AE, Felbinger TW, Reuter DA, Reichart
B, Friedl R, Hannekum A, Pfeiffer UJ: Reliability of a new algo-
rithm for continuous cardiac output determination by pulse-
contour analysis during hemodynamic instability. Crit Care
Med 2002, 30:52-58.
7. Sakka SG, Reinhart K, Meier-Hellmann A: Comparison of pulmo-
nary artery and arterial thermodilution cardiac output in criti-
cally ill patients. Intensive Care Med 1999, 25:843-846.
8. Buhre W, Weyland A, Kazmaier S, Hanekop GG, Baryalei MM,
Sydow M, Sonntag H: Comparison of cardiac output assessed
by pulse-contour analysis and thermodilution in patients
undergoing minimally invasive direct coronary artery bypass
grafting. J Cardiothorac Vasc Anesth 1999, 13:437-440.
9. Jansen JR, Wesseling KH, Settels JJ, Schreuder JJ: Continuous
cardiac output monitoring by pulse contour during cardiac
surgery. Eur Heart J 1990, 11(Suppl I):
26-32.
10. Wesseling KH, Jansen JR, Settels JJ, Schreuder JJ: Computation
of aortic flow from pressure in humans using a nonlinear,
three-element model. J Appl Physiol 1993, 74:2566-2573.
11. Zollner C, Haller M, Weis M, Morstedt K, Lamm P, Kilger E, Goetz
AE: Beat-to-beat measurement of cardiac output by intravas-
cular pulse contour analysis: a prospective criterion standard
study in patients after cardiac surgery. J Cardiothorac Vasc
Anesth 2000, 14:125-129.
12. Della RG, Costa MG, Pompei L, Coccia C, Pietropaoli P: Contin-
uous and intermittent cardiac output measurement: pulmo-
nary artery catheter versus aortic transpulmonary technique.
Br J Anaesth 2002, 88:350-356.
Key messages
• We observed a good correlation of CO
Transpulm
and
CO
PAC
measurements prior, during, and after CABG
surgery.
• Our study could not establish pulse contour analysis
with an uncalibrated pulse contour algorithm to be a
method yielding reliable results under difficult condi-
tions in perioperative CABG patients.
• CO
Wave
underestimated CO
PAC
and showed a wide
range of LOAs, requiring further clinical evaluation in dif-
ferent patient populations.
Critical Care Vol 10 No 6 Sander et al.
Page 10 of 10
(page number not for citation purposes)
13. Calafiore AM, Teodori G, Mezzetti A, Bosco G, Verna AM, Di Giam-
marco G, Lapenna D: Intermittent antegrade warm blood
cardioplegia. Ann Thorac Surg 1995, 59:398-402.
14. von Heymann C: Therapy with blood and blood components. In
Check-up Anästhesiologie Edited by: Spies CD, Kox WJ. Berlin:
Springer; 2004:400-402.
15. Bland JM, Altman DG: Statistical methods for assessing agree-
ment between two methods of clinical measurement. Lancet
1986, 1:307-310.
16. Critchley LA, Critchley JA: A meta-analysis of studies using bias
and precision statistics to compare cardiac output measure-
ment techniques. J Clin Monit Comput 1999, 15:85-91.
17. Manecke GR: Edwards FloTrac sensor and Vigileo monitor:
easy, accurate, reliable cardiac output assessment using the
arterial pulse wave. Expert Rev Med Devices 2005, 2:523-527.
18. Godje O, Friedl R, Hannekum A: Accuracy of beat-to-beat car-
diac output monitoring by pulse contour analysis in hemody-
namical unstable patients. Med Sci Monit 2001, 7:1344-1350.
19. Penttila J, Snapir A, Kentala E, Koskenvuo J, Posti J, Scheinin M,
Scheinin H, Kuusela T: Estimation of cardiac output in a phar-
macological trial using a simple method based on arterial
blood pressure signal waveform: a comparison with pulmo-
nary thermodilution and echocardiographic methods. Eur J
Clin Pharmacol 2006, 62:401-407.
20. Pittman J, Bar-Yosef S, SumPing J, Sherwood M, Mark J: Contin-
uous cardiac output monitoring with pulse contour analysis: a
comparison with lithium indicator dilution cardiac output
measurement. Crit Care Med 2005, 33:2015-2021.
21. Sander M, von Heymann C, Foer A, von Dossow V, Grosse J,
Dushe S, Konertz WF, Spies CD: Pulse contour analysis after
normothermic cardiopulmonary bypass in cardiac surgery
patients. Crit Care 2005, 9:R729-R734.
22. Jellema WT, Wesseling KH, Groeneveld AB, Stoutenbeek CP,
Thijs LG, van Lieshout JJ: Continuous cardiac output in septic
shock by simulating a model of the aortic input impedance: a
comparison with bolus injection thermodilution. Anesthesiol-
ogy 1999, 90:1317-1328.
23. Latson TW, Whitten CW, O'Flaherty D: Ventilation, thermal
noise, and errors in cardiac output measurements after cardi-
opulmonary bypass.
Anesthesiology 1993, 79:1233-1243.