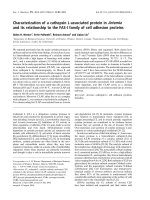
Báo cáo khoa học: "Prediction of fluid responsiveness using respiratory variations in left ventricular stroke area by transoesophageal echocardiographic automated border detection in mechanically ventilated patients" pdf
Bạn đang xem bản rút gọn của tài liệu. Xem và tải ngay bản đầy đủ của tài liệu tại đây (594.38 KB, 9 trang )
Open Access
Available online />Page 1 of 9
(page number not for citation purposes)
Vol 10 No 6
Research
Prediction of fluid responsiveness using respiratory variations in
left ventricular stroke area by transoesophageal
echocardiographic automated border detection in mechanically
ventilated patients
Maxime Cannesson
1
, Juliette Slieker
1
, Olivier Desebbe
1
, Fadi Farhat
2
, Olivier Bastien
1
and Jean-
Jacques Lehot
1
1
Department of Anaesthesiology and Intensive Care, Louis Pradel Hospital, Claude Bernard Lyon 1 university, EA 1896, Hospices Civils de Lyon,
Lyon, France
2
Service de Chirurgie Cardiaque, Hôpital Cardiologique Louis Pradel, 200 avenue du Doyen Lépine, 69500 Bron, France
Corresponding author: Maxime Cannesson,
Received: 13 Sep 2006 Revisions requested: 19 Oct 2006 Revisions received: 27 Oct 2006 Accepted: 12 Dec 2006 Published: 12 Dec 2006
Critical Care 2006, 10:R171 (doi:10.1186/cc5123)
This article is online at: />© 2006 Cannesson et al.; licensee BioMed Central Ltd.
This is an open access article distributed under the terms of the Creative Commons Attribution License ( />),
which permits unrestricted use, distribution, and reproduction in any medium, provided the original work is properly cited.
Abstract
Background Left ventricular stroke area by transoesophageal
echocardiographic automated border detection has been
shown to be strongly correlated to left ventricular stroke volume.
Respiratory variations in left ventricular stroke volume or its
surrogates are good predictors of fluid responsiveness in
mechanically ventilated patients. We hypothesised that
respiratory variations in left ventricular stroke area (ΔSA) can
predict fluid responsiveness.
Methods Eighteen mechanically ventilated patients undergoing
coronary artery bypass grafting were studied immediately after
induction of anaesthesia. Stroke area was measured on a beat-
to-beat basis using transoesophageal echocardiographic
automated border detection. Haemodynamic and
echocardiographic data were measured at baseline and after
volume expansion induced by a passive leg raising manoeuvre.
Responders to passive leg raising manoeuvre were defined as
patients presenting a more than 15% increase in cardiac output.
Results Cardiac output increased significantly in response to
volume expansion induced by passive leg raising (from 2.16 ±
0.79 litres per minute to 2.78 ± 1.08 litres per minute; p < 0.01).
ΔSA decreased significantly in response to volume expansion
(from 17% ± 7% to 8% ± 6%; p < 0.01). ΔSA was higher in
responders than in non-responders (20% ± 5% versus 10% ±
5%; p < 0.01). A cutoff ΔSA value of 16% allowed fluid
responsiveness prediction with a sensitivity of 92% and a
specificity of 83%. ΔSA at baseline was related to the
percentage increase in cardiac output in response to volume
expansion (r = 0.53, p < 0.01).
Conclusion ΔSA by transoesophageal echocardiographic
automated border detection is sensitive to changes in preload,
can predict fluid responsiveness, and can quantify the effects of
volume expansion on cardiac output. It has potential clinical
applications.
Introduction
Volume expansion is one of the most common manoeuvres to
increase cardiac output (CO) in patients with circulatory fail-
ure. However, if inappropriate, volume expansion may have
deleterious effects such as volume overload, systemic and pul-
monary oedema, and increased tissue hypoxia [1]. It is there-
fore important to obtain reliable information concerning fluid
responsiveness in patients presenting with circulatory failure
in the operating room or in the intensive care unit.
Static indicators of fluid responsiveness such as central
venous pressure (CVP) and pulmonary capillary wedge pres-
sure have been shown to be poor predictors of fluid respon-
siveness [2-6]. In contrast, indices relying on the
CO = cardiac output; CVP = central venous pressure; LV = left ventricle or left ventricular; LVEDA = left ventricular end-diastolic area; LVEDAI = left
ventricular end-diastolic area index; PP = pulse pressure; ΔPP = respiratory variations in pulse pressure; ROC = receiver operating characteristic;
SA = stroke area; ΔSA = respiratory variations in left ventricular stroke area; VTI = velocity time integral.
Critical Care Vol 10 No 6 Cannesson et al.
Page 2 of 9
(page number not for citation purposes)
cardiopulmonary interactions in mechanically ventilated
patients under general anaesthesia have been shown to be
good predictors of fluid responsiveness [2-13].
Transoesophageal echocardiography is widely used in the
operating room or in the intensive care unit for monitoring left
ventricular (LV) systolic function and LV preload [14,15] using
LV end-diastolic area index (LVEDAI). However, LVEDAI is a
static indicator and has poor predictive value to assess fluid
responsiveness [16]. Automated border detection has been
shown to be able to display LV area on a beat-to-beat basis,
representing the dynamic variant of the left ventricular end-
diastolic area (LVEDA) [17,18]. Moreover, through the LV
area, the LV volume can be assessed in a non-invasive manner
and changes in stroke area (SA) and stroke volume have been
shown to be closely related [19-21]. The aim of our study was
to evaluate the ability of respiratory variations in LV SA (ΔSA)
to detect changes in loading conditions and to predict the
effects of volume expansion in mechanically ventilated
patients.
Materials and methods
This study was approved by the institutional review board
committee (Comité Consultatif de Protection des Personnes
dans la Recherche Biomédicale Lyon B), and all patients gave
written informed consent. Twenty patients (aged 37 to 84
years old; 13 men, 7 women) undergoing coronary artery
bypass grafting were studied. Exclusion criteria were cardiac
arrhythmia, cardiac shunts, LV dysfunction (preoperative LV
ejection fraction < 50%), and any contraindication to tran-
soesophageal echocardiography.
Anaesthesia was induced using propofol (1 to 3 mg/kg) and
sufentanil (0.5 to 1.0 μg/kg), and orotracheal intubation was
facilitated with pancuronium (0.1 to 0.15 mg/kg). After induc-
tion of anaesthesia, an 8-cm 5-French tipped catheter (Arrow
International, Inc., Reading, PA, USA) was inserted in the left
or right radial artery and a triple-lumen 16-cm 8.5-French cen-
tral venous catheter was inserted in the right internal jugular
vein (Arrow International, Inc.). Pressure transducers (Medex
Medical Ltd., Rossendale, Lancashire, UK) were placed on the
mid-axillary line and fixed to the operation table to ensure their
position at an atrial level during the entire protocol. All trans-
ducers were zeroed to atmospheric pressure before each step
of the protocol. Thereafter, a 5-MHz transoesophageal multi-
plane transducer (Philips 5.0–6.4 MHz, 21367A; Philips Med-
ical Systems, Andover, MA, USA) was inserted in the patient's
oesophagus. Anaesthesia was maintained with continuous
infusions of propofol (5 to 8 mg/kg per hour) and sufentanil
(0.7 to 1.0 μg/kg per hour) to keep a bispectral index (Aspect
1000; Aspect Medical Systems, Inc., Norwood, MA, USA)
between 40 and 50. Patients were ventilated in a volume-con-
trolled mode with a tidal volume of 10 ml/kg at a frequency of
12 to 14 cycles per minute (average maximum inspiratory
pressure was 18 ± 5 cm H
2
O). Inspiratory-to-expiratory ratio
was set to 1:2. Positive end-expiratory pressure was set
between 0 and 4 cm H
2
O according to the attending
physician.
Haemodynamic measurements
The following haemodynamic parameters were monitored con-
tinuously (Philips Intellivue MP70 Anaesthesia; Philips Medizin
Systeme Böblingen GmbH, Böblingen, Germany): heart rate,
systolic arterial pressure, diastolic arterial pressure, mean arte-
rial pressure, and CVP.
Echocardiography
Echocardiographic images were recorded using a Hewlett-
Packard Sonos 2500 (HP M2406A; Hewlett-Packard Com-
pany, Palo Alto, CA, USA) with automated border detection
capabilities. The transoesophageal multiplane transducer was
positioned to obtain a transgastric, cross-sectional view of the
LV at midpapillary muscle level with the transducer positioned
to obtain the image that had the most-circular overall geometry
[22]. The cross-sectional view of the LV was chosen because
of a demonstrated relationship between LV cross-sectional
area and LV volume [23-25]. Automated border detection
quantifies the cardiac chamber areas instantaneously by
detecting the tissue-blood interface, which results in a contin-
uous, beat-to-beat ventricular area and has already been
described in great detail elsewhere [17-20,26]. Briefly, the
endocardial border of the LV, including the papillary muscles,
was circumscribed manually to define the region of interest
(careful attention was paid to circumscribe the LV all along the
respiratory cycle). The threshold for the determination of the
blood-tissue border inside this region was set manually by
adjusting the gain. The LV area was then displayed on a beat-
to-beat basis simultaneously with the patient's electrocardio-
gram and respiratory curve. It was then recorded and analysed
off-line by an investigator blinded to the other results (Figure
1).
Data analysis
Respiratory variations in pulse pressure
Pulse pressure (PP) was defined as the difference between
systolic and diastolic pressures. Maximal (PP
max
) and minimal
(PP
min
) values of PP were determined over the same respira-
tory cycle. The respiratory variations in PP, ΔPP, were then cal-
culated as described by Michard and colleagues. [9], ΔPP =
[(PP
max
- PP
min
)/([PP
max
+ PP
min
]/2)] × 100%, and averaged
over three consecutive respiratory cycles.
Respiratory variations in stroke area
SA was defined as the difference between the end-diastolic
area (LVEDA) and the end-systolic area (Figure 1) [20]. Maxi-
mal (SA
max
) and minimal (SA
min
) values of PP were determined
over the same respiratory cycle. ΔSA was then calculated
using the same formula described previously to calculate ΔPP:
[(SA
max
- SA
min
)/([SA
max
+ SA
min
]/2)] × 100% (Figure 2). ΔSA
and ΔPP were calculated over the same respiratory cycles.
Available online />Page 3 of 9
(page number not for citation purposes)
Left ventricular end-diastolic area
LVEDA was defined as peak of the LV area during diastole.
LVEDAI was defined as LVEDA/surface body area. For each
measurement, an average of three consecutive cardiac beats
throughout the respiratory cycle were evaluated.
Cardiac output
CO was used to monitor an increase in stroke volume in
response to volume expansion. CO was calculated using the
velocity time integral (VTI) obtained by transoesophageal
echocardiography from the transgastric long-axis view [27].
VTI was measured by a pulsed-wave Doppler beam at the level
of the aortic valve. The mean of three measurements was used.
Aortic valve area was measured at baseline and was consid-
ered constant throughout the protocol as aortic valve area = π
× (aortic diameter/2)
2
. [4,28]. The stroke volume was calcu-
lated as aortic valve area × VTI. CO was calculated as stroke
volume × heart rate.
Protocol
All patients were studied after induction of anaesthesia but
before surgery. Haemodynamic and echocardiographic data
were recorded during two consecutive steps. (a) The patient
was studied in the semirecumbent position (45°) after a two
minute period of haemodynamic stability. First, pulsed Doppler
aortic flow was recorded from the transgastric long-axis view.
Then, automated border detection data were recorded from a
transgastric, cross-sectional view of the LV at midpapillary
muscle level. (b) Using the automatic operation table, the
patient's legs were raised to a 45° angle with the patient's
trunk in a supine position. In this position, echocardiographic
and haemodynamic data were recorded within two minutes.
Automated border detection data were recorded before
pulsed Doppler aortic flow. This sequence was chosen in
order to keep the automated border detection settings stable
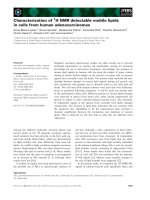
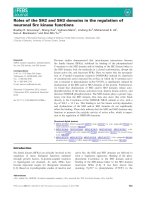
Figure 1
Transoesophageal echocardiographic transgastric, cross-sectional view of the left ventricle at midpapillary muscle level with automated border detection (ABD)Transoesophageal echocardiographic transgastric, cross-sectional
view of the left ventricle at midpapillary muscle level with automated
border detection (ABD). Endocardial border of the left ventricle, includ-
ing the papillary muscles, was circumscribed manually to define the
region of interest (blue line). ABD quantifies the cardiac chamber areas
instantaneously by detecting the blood-tissue interface (red line), which
results in a continuous, beat-to-beat left ventricular area curve (green
line). Left ventricular end-diastolic area (LVEDA) was defined as peak of
the left ventricular area during diastole. Left ventricular end-systolic
area (LVESA) was defined as minimum left ventricular area during sys-
tole. Stroke area (SA) was defined as LVEDA – LVESA over the same
cardiac cycle.
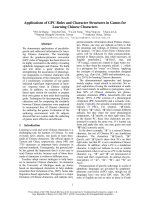
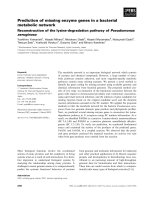
Figure 2
Transoesophageal echocardiographic transgastric, cross-sectional views of the left ventricle at midpapillary muscle level with automated border detection at baseline (top panel) and after volume expansion induced by passive leg raising manoeuvre (bottom panel)Transoesophageal echocardiographic transgastric, cross-sectional
views of the left ventricle at midpapillary muscle level with automated
border detection at baseline (top panel) and after volume expansion
induced by passive leg raising manoeuvre (bottom panel). Left ventricu-
lar area curve was displayed with electrocardiogram and respiratory
curve. Stroke area (SA) was defined as the difference between the
end-diastolic area (LVEDA) and the end-systolic area. Maximal (SA
max
)
and minimal (SA
min
) values of pulse pressure were determined over the
same respiratory cycle. Respiratory variations in left ventricular SA
(ΔSA) were then calculated using the following formula: ΔSA = [(SA
max
- SA
min
)/([SA
max
+ SA
min
]/2)] × 100%. Passive leg raising manoeuvre
induced a decrease in ΔSA and an increase in LVEDA. Gain was held
constant throughout the protocol.
Critical Care Vol 10 No 6 Cannesson et al.
Page 4 of 9
(page number not for citation purposes)
between the two measurements because of a known
dependency of automated border detection on echocardio-
graphic gain settings. This protocol was chosen because of its
demonstrated ability to mimic fluid challenge [29-32].
Mechanical ventilation and anaesthetic drug concentrations
were held constant throughout the study protocol.
Statistical analysis
All data are presented as mean ± standard deviation. Changes
in haemodynamic parameters induced by changes in loading
conditions within the same group were assessed using a non-
parametric Wilcoxon test. Spearman rank method was used to
test linear correlation. Patients were divided into two groups
according to the percentage increase in CO after the passive
leg raising manoeuvre: responders were defined as patients
presenting an increase in CO of more than or equal to 15% [9]
and non-responders as patients presenting an increase in CO
of less than 15%. The comparison of haemodynamic parame-
ters before passive leg raising in responder and non-
responder patients was assessed using a non-parametric
Mann-Whitney U test. Receiver operating characteristic
(ROC) curves were generated for CO, CVP, LVEDA, ΔPP, and
ΔSA, varying the discriminating threshold of each parameters,
and areas under the ROC curves were calculated and com-
pared [33] (MedCalc 8.0.2.0; MedCalc Software, Mariakerke,
Belgium). Intra- and interobserver variabilities for the calcula-
tion of ΔSA were assessed using Bland-Altman analysis and
are expressed as mean percentage error [34]. This analysis
comprised visualisation and re-installation of the automated
border detection in nine patients at baseline by two different
operators. A p value less than 0.05 was considered statisti-
cally significant. All statistic analysis was performed using
SPSS 13.0 for Windows (SPSS Inc., Chicago, IL, USA).
Results
Two patients (10%) were excluded because of poor echocar-
diographic images.
Effects of changes in loading conditions
As expected, passive leg raising induced a significant increase
in CO, from 2.16 ± 0.79 litres per minute to 2.78 ± 1.08 litres
per minute (p < 0.01). All haemodynamic parameters changed
significantly in response to the passive leg raising manoeuvre
(Table 1). ΔSA and ΔPP decreased significantly in response to
passive leg raising (from 17.1% ± 6.8% to 8.1% ± 5.8% and
from 9.9% ± 5.5% to 7.9% ± 3.2%, respectively; p < 0.05 for
both) (Figure 2). Likewise, LVEDAI increased from 9.2 ± 4.5
cm
2
/m
2
to 10.8 ± 6.3 cm
2
/m
2
(p < 0.05) and CVP increased
from 3 ± 4 mm Hg to 18 ± 4 mm Hg (p < 0.01) (Figure 2).
ΔSA to predict fluid responsiveness
Twelve patients were responders and six patients were non-
responders. Their haemodynamic data are shown in Table 2.
We observed a significant relationship (r = 0.62, p < 0.05) and
an acceptable agreement between ΔSA and ΔPP (3% ± 5%)
at baseline. ΔSA and ΔPP at baseline were significantly higher
in responders than in non-responders (20.5% ± 4.8% versus
10.0% ± 4.6% and 17% ± 5% versus 8% ± 4%; p < 0.01 for
both), whereas neither difference in CVP (6 ± 3 mm Hg in
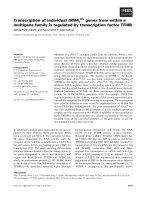
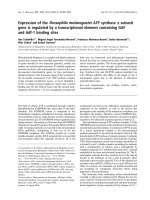
Figure 3
Receiver operating characteristic curves comparing the ability of respi-ratory variations in left ventricular stroke area (ΔSA), respiratory varia-tions in pulse pressure (ΔPP), left ventricular end-diastolic area index (LVEDAI), and central venous pressure (CVP) at baseline to predict response to volume expansion induced by passive leg raising manoeuvreReceiver operating characteristic curves comparing the ability of respi-
ratory variations in left ventricular stroke area (ΔSA), respiratory varia-
tions in pulse pressure (ΔPP), left ventricular end-diastolic area index
(LVEDAI), and central venous pressure (CVP) at baseline to predict
response to volume expansion induced by passive leg raising
manoeuvre.
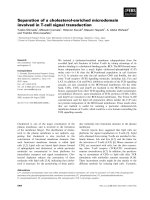
Figure 4
Respiratory variations in stroke area (ΔSA) values at baseline in responders and non-responders to volume expansion induced by pas-sive leg raising manoeuvreRespiratory variations in stroke area (ΔSA) values at baseline in
responders and non-responders to volume expansion induced by pas-
sive leg raising manoeuvre. A ΔSA threshold value of 16% allowed dis-
crimination between responders and non-responders with a 93%
sensitivity and an 82% specificity.
Available online />Page 5 of 9
(page number not for citation purposes)
responders versus 9 ± 4 mm Hg in non-responders; p = 0.13)
nor difference in LVEDAI (7.9 ± 4.1 cm
2
/m
2
versus 11.9 ± 4.5
cm
2
/m
2
; p = 0.06) and CO (2.17 ± 0.94 litres per minute in
responders versus 2.14 ± 0.43 litres per minute in non-
responders; p = 0.94) reached statistical significance
between these two groups. The areas under the ROC curves
(± standard error) were 0.910 ± 0.073 for ΔPP, 0.958 ±
0.043 for ΔSA, 0.271 ± 0.125 for CVP, 0.236 ± 0.114 for
LVEDAI, and 0.431 ± 0.134 for CO (Figure 3). The area for
ΔSA was significantly higher than the area for CVP, LVEDAI,
and CO (p < 0.05). Difference in area under the curve
between ΔSA and ΔPP did not reach significance (p = 0.83).
The threshold ΔPP value of 12% allowed discrimination
between responders and non-responders with a sensitivity of
92% and a specificity of 83%. The threshold ΔSA value of
16% allowed discrimination between responders and non-
responders with a sensitivity of 92% and a specificity of 83%
(Figure 4).
ΔSA to quantify response to volume expansion
ΔSA before volume expansion was significantly related to
changes in CO in response to volume expansion (r = 0.53, p
< 0.05). ΔPP before volume expansion also showed a signifi-
cant correlation to changes in CO (r = 0.73, p < 0.01), con-
firming previous results. In contrast, static indicators such as
LVEDAI and CVP before volume expansion were not related to
changes in CO in response to volume expansion (r = -0.42, p
= 0.08 and r = -0.23, p = 0.36, respectively) (Figure 5).
Reproducibility analysis
Intraobserver variability for ΔSA assessment was 8% ± 12%.
Interobserver variability for ΔSA assessment was 10% ± 12%.
Discussion
This is the first study to show that ΔSA can be assessed using
automated border detection. ΔSA is sensitive to changes in LV
Table 1
Haemodynamic data at baseline and after volume expansion induced by passive leg raising manoeuvre
Baseline Passive leg raising p
ΔSA (percentage) 17 ± 7 8 ± 6
a
< 0.001
ΔPP (percentage) 9.9 ± 5.5 7.9 ± 3.2
a
0.003
Central venous pressure (mm Hg) 3 ± 4 18 ± 4
a
0.005
LVEDAI (cm
2
/m
2
) 9.2 ± 4.5 10.8 ± 6.3
a
0.02
Heart rate (beats per minute) 64 ± 18 61 ± 16 0.092
Mean arterial pressure (mm Hg) 58 ± 10 74 ± 11
a
0.002
Velocity time integral (cm) 12.0 ± 4.1 15.9 ± 4.7
a
< 0.001
Cardiac output (litres per minute) 2.16 ± 0.79 2.78 ± 1.08
a
0.008
Data are presented as mean ± standard deviation. LVEDAI, left ventricular end-diastolic area index; ΔPP, respiratory variations in pulse pressure;
ΔSA, respiratory variations in left ventricular stroke area.
a
p < 0.05 compared to baseline.
Table 2
Echocardiographic and haemodynamic data in responders and non-responders to volume expansion induced by passive leg raising
manoeuvre
Responders (n = 12) Non-responders (n = 6) p
ΔSA (percentage) 20 ± 5 10 ± 5 0.001
ΔPP (percentage) 16.5 ± 4.8 8.2 ± 3.6 0.001
Central venous pressure (mm Hg) 6.2 ± 3.4 9.2 ± 3.6 0.13
LVEDAI (cm
2
/m
2
) 7.9 ± 4.1 11.9 ± 4.5 0.10
Cardiac output (litres per minute) 2.17 ± 0.95 2.14 ± 0.43 0.93
Heart rate (beats per minute) 65 ± 17 63 ± 18 0.91
Data are presented as mean ± standard deviation. LVEDAI, left ventricular end-diastolic area index; ΔPP, respiratory variations in pulse pressure;
ΔSA, respiratory variations in left ventricular stroke area.
Critical Care Vol 10 No 6 Cannesson et al.
Page 6 of 9
(page number not for citation purposes)
loading conditions, can predict and quantify fluid responsive-
ness, and is reproducible.
Fluid responsiveness assessment has been widely studied in
mechanically ventilated patients during the past 10 years [2-
13,28,31,35,36]. Positive pressure ventilation induces a
decrease in right ventricular preload during inspiration fol-
lowed by a decrease in right ventricular stroke volume (as
described by the Frank-Starling relationship). These phenom-
ena are transmitted to the LV (pulmonary transit time) and
induce a decrease in LV preload followed by a decrease in LV
stroke volume during expiration [2,37]. These respiratory vari-
ations in LV stroke volume or its surrogates are greater when
the LV operates on the steep portion of the Frank-Starling
curve rather than on the plateau. These phenomena explain
how the respiratory variations in LV stroke volume or its surro-
gates (PP, pulsed Doppler aortic flow) can be predictive of
response to volume expansion [2]. Indices derived from these
respiratory variations are qualified as dynamic predictors of
fluid responsiveness in opposition to static predictors such as
CVP, pulmonary capillary wedge pressure, or LVEDAI [2,37].
Moreover, it is now well established that dynamic indicators
have better predictive value for fluid responsiveness assess-
ment than do static indicators alone [2,37].
Automated border detection allows accurate and reproducible
on-line measurements of cross-sectional LV area. It analyses
received unprocessed radio frequency data to define the inter-
face between blood and myocardial tissue. Then, the software
calculates the blood cavity area within a specified region of
Figure 5
Relationship between respiratory variations in left ventricular stroke area (ΔSA) (top left panel), respiratory variations in pulse pressure (ΔPP) (top right panel), left ventricular end-diastolic area index (LVEDAI) (bottom left panel), and central venous pressure (CVP) (bottom right panel) at baseline and percentage increase in cardiac output (CO) after volume expansion (VE) induced by passive leg raising manoeuvreRelationship between respiratory variations in left ventricular stroke area (ΔSA) (top left panel), respiratory variations in pulse pressure (ΔPP) (top
right panel), left ventricular end-diastolic area index (LVEDAI) (bottom left panel), and central venous pressure (CVP) (bottom right panel) at baseline
and percentage increase in cardiac output (CO) after volume expansion (VE) induced by passive leg raising manoeuvre.
Available online />Page 7 of 9
(page number not for citation purposes)
interest (LV) and displays the area as a calibrated waveform in
real time. Several previous investigations have shown a strong
relationship between cross-sectional LV area and LV volume
[18,23]. Moreover, this relationship was demonstrated during
a wide range of haemodynamic alterations such as occlusion
and release of inferior vena cava, pulmonary artery, and aorta.
By displaying LV area continuously, automated border detec-
tion allows beat-to-beat determination of LV SA (defined as LV
end-diastolic area – LV end-systolic area). LV SA has been
shown to be closely related to LV stroke volume
[20,21,26,38], and this relationship has been demonstrated in
various ventricular loading conditions [20,21] and in patients
with wall motion abnormalities [21]. Coupled to LV pressure,
LV cavity area has been proposed to construct pressure-area
loops in real time in order to estimate LV contractility from end-
systolic relationships of cavity area (as a surrogate for LV vol-
ume) and central arterial pressure (as a surrogate for LV pres-
sure) with promising results [39]. Gorcsan and colleagues
[20,21] have shown that changes in LV stroke volume during
vena cava occlusion were strongly related to changes in LV
SA in patients undergoing coronary artery bypass surgery and
in dogs. It must be emphasised that these changes were
studied in a beat-to-beat analysis. Thus, changes in preload
can be assessed using automated border detection LV SA.
Our results are consistent with this previously published data
given that changes in preload induced by positive pressure
ventilation were quantifiable using respiratory changes in LV
SA (ΔSA). Furthermore, these variations were reduced after a
volume expansion induced by a passive leg raising manoeuvre
and were higher in responders to volume expansion than in
non-responders. Of note, in 1978, Brenner and colleagues
[40] were the first to describe respiratory changes in LV
dimensions using echocardiography. In a study focusing on
spontaneously breathing patients with normal ventricular func-
tion, they showed respiration-induced changes in LV end-
diastolic and end-systolic diameters measured from a par-
asternal mid-short-axis view using M-mode. It is interesting to
note that in this study the authors showed an inspiratory
decrease in LV stroke volume. In mechanically ventilated
patients, we observed an inspiratory increase in LV SA con-
sistent with the cardiopulmonary interactions in patients under
positive pressure ventilation [2]. However, the relationship
between mechanical ventilation, arterial pressure, and LV area
and volume is still complex and some studies found an incon-
stant association between respiration-induced changes in
systolic arterial pressure and changes in LV area [41].
Recently published studies have shown that the passive leg
raising manoeuvre was able to mimic volume expansion and to
predict fluid responsiveness in mechanically ventilated
patients [31,32]. These two studies show that patients who
significantly increase CO after a passive leg raising manoeu-
vre are more likely to be responders to volume expansion. The
major interest of this manoeuvre is that it can be performed in
patients with arrhythmia, even if the patient is triggering on the
ventilator in the intensive care unit. However, the passive leg
raising manoeuvre may not be easy to perform in the operating
room in patients undergoing surgical procedures with sur-
geons needing exposure and access to the operating field.
Transoesophageal echocardiography is widely used in the
intensive care unit and in the operating room. It is now a well-
established tool for intensivists and anaesthesiologists. It
allows analysis of left and right ventricular functions and pro-
vides invaluable information for the management of patients
with circulatory failure [15,27]. In the intensive care unit,
echocardiography is a useful tool to assess fluid responsive-
ness (respiratory variations in pulsed Doppler aortic blood
velocity, inferior vena cava diameter, and superior vena cava
collapsibility) [42]. In this setting, automated border detection
could be used as a new tool to discriminate between respond-
ers to volume expansion and non-responders. In the operating
room, transoesophageal echocardiography has been pro-
posed for LV systolic function and LV preload monitoring
[16,35,43,44]. Monitoring preload is different from assessing
fluid responsiveness, and LVEDAI has been shown to poorly
predict response to volume expansion. Using automated bor-
der detection and ΔSA in this setting may be helpful to monitor
both systolic function and fluid responsiveness from a trans-
gastric, cross-sectional view of the LV at midpapillary muscle
level.
Study limitations
The patients enrolled in this study underwent coronary artery
bypass grafting and may have wall motion abnormalities. How-
ever, a study conducted in patients undergoing coronary artery
bypass grafting demonstrated that even in this group of
patients a linear correlation exists between changes in SA and
stroke volume [21]. Thus, we are confident that wall motion
abnormalities had no influence on ΔSA. We performed pas-
sive leg raising with trunk lowering from 45° to 0° to mimic vol-
ume expansion as described by Monnet and colleagues[31].
This manoeuvre has been shown to be a simple method of
transiently increasing venous return [29,30] and has recently
been shown to be able to predict fluid responsiveness in
mechanically ventilated patients [31]. Moreover, echocardio-
graphic data were obtained within two minutes after passive
leg raising because it is known that the fluid challenge induced
by passive leg raising does not persist if legs are maintained
elevated. This is in accordance with previously published stud-
ies [31,32]. We chose to use a standardised tidal volume of
10 ml/kg because it has been demonstrated that tidal volume
influences dynamic parameters [45,46]. Most of the studies
focusing on dynamic parameters in the operating room chose
to use tidal volumes between 8 and 10 ml/kg. Thus, we believe
that our choice is in accordance with these studies.
A limitation of this study is a possible artifact caused by a res-
piratory-related motion of the heart relative to a fixed echocar-
diographic probe. Brenner and colleagues [40] described this
Critical Care Vol 10 No 6 Cannesson et al.
Page 8 of 9
(page number not for citation purposes)
hypothesis without being able to reject it. In our study, we can-
not exclude such an artifact, which would result in a different
LV short axis during the respiratory cycle and influence the res-
piratory changes in end-diastolic and end-systolic area, espe-
cially during the passive leg raising manoeuvre. This limitation
may be observed for most of the previously described
echocardiographic predictors of fluid responsiveness
because respiration may move either the ultrasound beam or
the studied structure (inferior [28] or superior [36] vena cava
diameter, LV outflow tract for aortic pulsed Doppler flow [4]).
However, the respiratory changes in LV SA are consistent with
previously published respiratory changes in LV stroke volume
or its surrogates in patients under mechanical ventilation and
we can postulate that ΔSA accurately reflects respiratory
changes in LV stroke volume. In our study, passive leg raising
may have induced displacement of the transoesophageal
probe. On the other hand, from a prospective point of view, we
used ΔSA before passive leg raising to predict fluid respon-
siveness. Consequently, this index was not influenced by
change in body position. Thus, the predictive value of ΔSA is
not impacted by this manoeuvre. Moreover, previously pub-
lished studies focusing on oesophageal Doppler and passive
leg raising did not mention this technical problem [31,32]. An
additional limitation is that automated border detection is
dependent on the gain setting. However, we held the gain con-
stant throughout the protocol. Whether ΔSA can be assessed
using transthoracic echocardiography has to be demon-
strated. The results were obtained from 18 patients and the
study is underpowered to permit a definitive conclusion
regarding the threshold value of 16%. Further studies in other
settings will be required to validate this value. Finally, ΔSA
cannot be used in spontaneously breathing patients or in
patients with cardiac arrhythmia.
Conclusion
ΔSA derived from transoesophageal echocardiographic auto-
mated border detection appears to be a non-invasive and
reproducible index of changes in loading conditions, fluid
responsiveness, and quantification of the effects of volume
expansion on CO in mechanically ventilated patients. ΔSA has
potential clinical applications.
Competing interests
The authors declare that they have no competing interests.
Authors' contributions
MC conceived of and designed the study, performed analysis
and interpretation of data, edited the manuscript, and gave
final approval of the manuscript. JS performed analysis and
interpretation of data, drafted the manuscript, and gave final
approval of the manuscript. OD and FF performed analysis and
interpretation of data and gave final approval of the manu-
script. OB and J-JL revised the manuscript critically for impor-
tant intellectual content, edited the manuscript, and gave final
approval of the manuscript.
Acknowledgements
The authors wish to thank Dr. Freek J. Ziljstra and Dr. Jasper van Bommel
from Erasmus MC University, Rotterdam, The Netherlands, for their
thoughtful comments and expertise during this study.
References
1. Practice parameters for hemodynamic support of sepsis in
adult patients in sepsis. Task Force of the American College of
Critical Care Medicine, Society of Critical Care Medicine. Crit
Care Med 1999, 27:639-660.
2. Michard F: Changes in arterial pressure during mechanical
ventilation. Anesthesiology 2005, 103:419-428.
3. Michard F, Teboul JL: Predicting fluid responsiveness in ICU
patients. A critical analysis of the evidence. Chest 2002,
121:2000-2008.
4. Feissel M, Michard F, Mangin I, Ruyer O, Faller JP, Teboul JL: Res-
piratory changes in aortic blood velocity as an indicator of fluid
responsiveness in ventilated patients with septic shock. Chest
2001, 119:867-873.
5. Tavernier B, Makhotine O, Lebuffe G, Dupont J, Scherpereel P:
Systolic pressure variation as a guide to fluid therapy in
patients with sepsis-induced hypotension. Anesthesiology
1998, 89:1313-1321.
6. Pinsky MR, Teboul JL: Assessment of indices of preload and
volume responsiveness. Curr Opin Crit Care 2005,
11:235-239.
7. Bendjelid K, Romand JA: Fluid responsiveness in mechanically
ventilated patients: a review of indices used in intensive care.
Intensive Care Med 2003, 29:352-360.
8. Feissel M, Badie J, Merlani PG, Faller JP, Bendjelid K: Pre-ejection
period variations predict the fluid responsiveness of septic
ventilated patients. Crit Care Med 2005, 33:2534-2539.
9. Michard F, Boussat S, Chemla D, Anguel N, Mercat A, Lecarpen-
tier Y, Richard C, Pinsky MR, Teboul JL: Relation between respi-
ratory changes in arterial pulse pressure and fluid
responsiveness in septic patients with acute circulatory
failure. Am J Respir Crit Care Med 2000, 162:134-138.
10. Reuter DA, Felbinger TW, Schmidt C, Kilger E, Goedje O, Lamm
P, Goetz AE: Stroke volume variations for assessment of car-
diac responsiveness to volume loading in mechanically venti-
lated patients after cardiac surgery. Intensive Care Med 2002,
28:392-398.
11. Rex S, Brose S, Metzelder S, Huneke R, Schalte G, Autschbach R,
Rossaint R, Buhre W: Prediction of fluid responsiveness in
patients during cardiac surgery. Br J Anaesth 2004,
93:782-788.
12. Slama M, Masson H, Teboul JL, Arnould ML, Nait-Kaoudjt R, Colas
B, Peltier M, Tribouilloy C, Susic D, Frohlich E, Andrejak M: Moni-
toring of respiratory variations of aortic blood flow velocity
Key messages
• ΔSA can be assessed using transoesophageal
echocardiographic automated border detection in
mechanically ventilated patients.
• ΔSA is sensitive to changes in LV preload.
• A ΔSA cutoff value of 16% allows discrimination
between responders to volume expansion and non-
responders.
• The higher the ΔSA before volume expansion, the
higher the increase in CO induced by volume
expansion.
• ΔSA is a simple tool for fluid responsiveness assess-
ment using transoesophageal echocardiographic LV
short-axis view.
Available online />Page 9 of 9
(page number not for citation purposes)
using esophageal Doppler. Intensive Care Med 2004,
30:1182-1187.
13. Wiesenack C, Fiegl C, Keyser A, Prasser C, Keyl C: Assessment
of fluid responsiveness in mechanically ventilated cardiac sur-
gical patients. Eur J Anaesthesiol 2005, 22:658-665.
14. Bergquist BD, Bellows WH, Leung JM: Transesophageal
echocardiography in myocardial revascularization: II. Influ-
ence on intraoperative decision making. Anesth Analg 1996,
82:1139-1145.
15. Cheitlin MD, Armstrong WF, Aurigemma GP, Beller GA, Bierman
FZ, Davis JL, Douglas PS, Faxon DP, Gillam LD, Kimball TR, et al.:
ACC/AHA/ASE 2003 guideline update for the clinical applica-
tion of echocardiography: summary article: a report of the
American College of Cardiology/American Heart Association
Task Force on Practice Guidelines (ACC/AHA/ASE Commit-
tee to Update the 1997 Guidelines for the Clinical Application
of Echocardiography). Circulation 2003, 108:1146-1162.
16. Cheung AT, Savino JS, Weiss SJ, Aukburg SJ, Berlin JA: Echocar-
diographic and hemodynamic indexes of left ventricular
preload in patients with normal and abnormal ventricular
function. Anesthesiology 1994, 81:376-387.
17. Perez JE, Waggoner AD, Barzilai B, Melton HE Jr, Miller JG, Sobel
BE: On-line assessment of ventricular function by automatic
boundary detection and ultrasonic backscatter imaging. J Am
Coll Cardiol 1992, 19:313-320.
18. Vandenberg BF, Rath LS, Stuhlmuller P, Melton HE Jr, Skorton DJ:
Estimation of left ventricular cavity area with an on-line, semi-
automated echocardiographic edge detection system. Circu-
lation 1992, 86:159-166.
19. Gorcsan J 3rd, Morita S, Mandarino WA, Deneault LG, Kawai A,
Kormos RL, Griffith BP, Pinsky MR: Two-dimensional echocardi-
ographic automated border detection accurately reflects
changes in left ventricular volume. J Am Soc Echocardiogr
1993, 6:482-489.
20. Gorcsan J 3rd, Lazar JM, Romand J, Pinsky MR: On-line estima-
tion of stroke volume by means of echocardiographic auto-
mated border detection in the canine left ventricle. Am Heart J
1993, 125:1316-1323.
21. Gorcsan J 3rd, Gasior TA, Mandarino WA, Deneault LG, Hattler
BG, Pinsky MR: On-line estimation of changes in left ventricu-
lar stroke volume by transesophageal echocardiographic
automated border detection in patients undergoing coronary
artery bypass grafting. Am J Cardiol 1993, 72:721-727.
22. Schiller NB, Shah PM, Crawford M, DeMaria A, Devereux R, Fei-
genbaum H, Gutgesell H, Reichek N, Sahn D, Schnittger I, et al.:
Recommendations for quantitation of the left ventricle by two-
dimensional echocardiography. American Society of Echocar-
diography Committee on Standards, Subcommittee on Quan-
titation of Two-Dimensional Echocardiograms. J Am Soc
Echocardiogr 1989, 2:358-367.
23. Appleyard RF, Glantz SA: Two dimensions describe left ven-
tricular volume change during hemodynamic transients. Am J
Physiol 1990, 258:H277-284.
24. Eaton LW, Maughan WL, Shoukas AA, Weiss JL: Accurate vol-
ume determination in the isolated ejecting canine left ventricle
by two-dimensional echocardiography. Circulation 1979,
60:320-326.
25. Weiss JL, Eaton LW, Kallman CH, Maughan WL: Accuracy of vol-
ume determination by two-dimensional echocardiography:
defining requirements under controlled conditions in the
ejecting canine left ventricle. Circulation 1983, 67:889-895.
26. Gorcsan J III, Denault A, Mandarino WA, Pinsky MR: Left ventricu-
lar pressure-volume relations with transesophageal echocar-
diographic automated border detection: comparison with
conductance-catheter technique. Am Heart J 1996,
131:544-552.
27. Shanewise JS, Cheung AT, Aronson S, Stewart WJ, Weiss RL,
Mark JB, Savage RM, Sears-Rogan P, Mathew JP, Quinoñes MA,
et al.: ASE/SCA guidelines for performing a comprehensive
intraoperative multiplane transesophageal echocardiography
examination: recommendations of the American Society of
Echocardiography Council for Intraoperative Echocardiogra-
phy and the Society of Cardiovascular Anesthesiologists Task
Force for Certification in Perioperative Transesophageal
Echocardiography. J Am Soc Echocardiogr 1999, 12:884-900.
28. Feissel M, Michard F, Faller JP, Teboul JL: The respiratory varia-
tion in inferior vena cava diameter as a guide to fluid therapy.
Intensive Care Med 2004, 30:1834-1837.
29. Rutlen DL, Wackers FJ, Zaret BL:
Radionuclide assessment of
peripheral intravascular capacity: a technique to measure
intravascular volume changes in the capacitance circulation in
man. Circulation 1981, 64:146-152.
30. Reich DL, Konstadt SN, Raissi S, Hubbard M, Thys DM: Trende-
lenburg position and passive leg raising do not significantly
improve cardiopulmonary performance in the anesthetized
patient with coronary artery disease. Crit Care Med 1989,
17:313-317.
31. Monnet X, Rienzo M, Osman D, Anguel N, Richard C, Pinsky MR,
Teboul JL: Passive leg raising predicts fluid responsiveness in
the critically ill. Crit Care Med 2006, 34:1402-1407.
32. Lafanechere A, Pene F, Goulenok C, Delahaye A, Mallet V,
Choukroun G, Chiche J, Mira J, Cariou A: Changes in aortic blood
flow induced by passive leg raising predict fluid responsive-
ness in critically ill patients. Crit Care 2006, 10:R132.
33. Hanley JA, McNeil BJ: A method of comparing the areas under
receiver operating characteristic curves derived from the
same cases. Radiology 1983, 148:839-843.
34. Bland JM, Altman DG: Statistical methods for assessing agree-
ment between two methods of clinical measurement. Lancet
1986, 1:307-310.
35. Tousignant CP, Walsh F, Mazer CD: The use of transesophageal
echocardiography for preload assessment in critically ill
patients. Anesth Analg 2000, 90:351-355.
36. Vieillard-Baron A, Chergui K, Rabiller A, Peyrouset O, Page B,
Beauchet A, Jardin F: Superior vena caval collapsibility as a
gauge of volume status in ventilated septic patients. Intensive
Care Med 2004, 30:1734-1739.
37. Bendjelid K, Romand JA: Fluid responsiveness in mechanically
ventilated patients: a review of indices used in intensive care.
Intensive Care Med 2003, 29:352-360.
38. Katz WE, Gasior TA, Reddy SC, Gorcsan J 3rd: Utility and limita-
tions of biplane transesophageal echocardiographic auto-
mated border detection for estimation of left ventricular stroke
volume and cardiac output. Am Heart J 1994, 128:389-396.
39. Denault AY, Gorcsan J 3rd, Mandarino WA, Kancel MJ, Pinsky MR:
Left ventricular performance assessed by echocardiographic
automated border detection and arterial pressure.
Am J
Physiol 1997, 272:H138-147.
40. Brenner JI, Waugh RA: Effect of phasic respiration on left ven-
tricular dimension and performance in a normal population. An
echocardiographic study. Circulation 1978, 57:122-127.
41. Denault AY, Gasior TA, Gorcsan J 3rd, Mandarino WA, Deneault
LG, Pinsky MR: Determinants of aortic pressure variations dur-
ing positive pressure ventilation in man. Chest 1999,
116:176-186.
42. Charron C, Caille V, Jardin F, Vieillard-Baron A: Echocardio-
graphic measurement of fluid responsiveness. Curr Opin Crit
Care 2006, 12:249-254.
43. Swenson JD, Bull D, Stringham J: Subjective assessment of left
ventricular preload using transesophageal echocardiography:
corresponding pulmonary artery occlusions pressures. J Car-
diothorac Vasc Anesth 2001, 15:580-583.
44. Simon P, Mohl W: Intraoperative echocardiographic assess-
ment of global and regional myocardial function. Echocardiog-
raphy 1990, 7:333-341.
45. Reuter DA, Bayerlein J, Goepfert MS, Weis FC, Kilger E, Lamm P,
Goetz AE: Influence of tidal volume on left ventricular stroke
volume variations measured by pulse contour analysis in
mechanically ventilated patients. Intensive Care Med 2003,
29:476-480.
46. Charron C, Fessenmeyer C, Cosson C, Mazoit JX, Herbert JL, Ben-
hamou D, Edouard AR: The influence of tidal volume on the
dynamic variables of fluid responsiveness in critically ill
patients. Anesth Analg 2006, 102:1511-1517.