Báo cáo khoa học: "Differences in one-year health outcomes and resource utilization by definition of prolonged mechanical ventilation: a prospective cohort study" doc
Bạn đang xem bản rút gọn của tài liệu. Xem và tải ngay bản đầy đủ của tài liệu tại đây (532.73 KB, 11 trang )
Open Access
Available online />Page 1 of 11
(page number not for citation purposes)
Vol 11 No 1
Research
Differences in one-year health outcomes and resource utilization
by definition of prolonged mechanical ventilation: a prospective
cohort study
Christopher E Cox
1
, Shannon S Carson
2
, Jennifer H Lindquist
3
, Maren K Olsen
3,4
,
Joseph A Govert
1
, Lakshmipathi Chelluri
5
and the Quality of Life After Mechanical Ventilation in the
Aged (QOL-MV) Investigators
1
Department of Medicine, Division of Pulmonary and Critical Care Medicine, Duke University, Box 3683, Durham, North Carolina, 27710 USA
2
Department of Medicine, Division of Pulmonary and Critical Care Medicine, University of North Carolina, 4134 Bioinformatics Bldg, CB# 7020,
Chapel Hill, North Carolina, 27599 USA
3
Center for Health Services Research in Primary Care, VA Medical Center, 11033 Hock Bldg 2424 Erwin Road, Durham, North Carolina, 27705 USA
4
Department of Biostatistics and Bioinformatics, Duke University, 7020 N. Pavilion Building, Durham, North Carolina, 27710 USA
5
Department of Critical Care Medicine, University of Pittsburgh School of Medicine 637 Scaife, Pittsburgh, Philadelphia, 15261 USA
Corresponding author: Shannon S Carson,
Received: 8 Nov 2006 Revisions requested: 18 Dec 2006 Revisions received: 11 Jan 2007 Accepted: 23 Jan 2007 Published: 23 Jan 2007
Critical Care 2007, 11:R9 (doi:10.1186/cc5667)
This article is online at: />© 2007 Cox et al.; licensee BioMed Central Ltd
This is an open access article distributed under the terms of the Creative Commons Attribution License ( />),
which permits unrestricted use, distribution, and reproduction in any medium, provided the original work is properly cited.
Abstract
Introduction The outcomes of patients ventilated for longer
than average are unclear, in part because of the lack of an
accepted definition of prolonged mechanical ventilation (PMV).
To better understand the implications of PMV provision, we
compared one-year health outcomes between two common
definitions of PMV as well as between PMV patients and those
ventilated for shorter periods of time.
Methods We conducted a secondary analysis of prospectively
collected data from medical and surgical intensive care units at
an academic tertiary care medical center. The study included
817 critically ill patients ventilated for ≥ 48 hours, 267 (33%) of
whom received PMV based on receipt of a tracheostomy and
ventilation for ≥ 96 hours. A total of 114 (14%) patients met the
alternate definition of PMV by being ventilated for ≥ 21 days.
Survival, functional status, and costs were measured at baseline
and at 2, 6, and 12 months after discharge. Of one-year
survivors, 71 (17%) were lost to follow up.
Results PMV patients ventilated for ≥ 21 days had greater costs
($140,409 versus $143,389) and higher one-year mortality
(58% versus 48%) than did PMV patients with tracheostomies
who were ventilated for ≥ 96 hours. The majority of PMV deaths
(58%) occurred after hospital discharge whereas 67% of PMV
patients aged 65 years or older had died by one year. At one
year PMV patients on average had limitations in two basic and
five instrumental elements of functional status that exceeded
both their pre-admission status and the one-year disability of
those ventilated for < 96 hours. Costs per one-year survivor
were $423,596, $266,105, and $165,075 for patients
ventilated ≥ 21 days, ≥ 96 hours with a tracheostomy, and < 96
hours, respectively.
Conclusion Contrasting definitions of PMV capture significantly
different patient populations, with ≥ 21 days of ventilation
specifying the most resource-intensive recipients of critical care.
PMV patients, particularly the elderly, suffer from a significant
burden of costly, chronic critical illness and are at high risk for
death throughout the first year after intensive care.
Introduction
Intensive care is expensive, particularly for those who require
mechanical ventilation [1]. Because respiratory failure inci-
dence increases markedly after age 60 years, the aging of the
US population will probably strain the health care system's
capacity to meet future critical care demands [2,3]. Patients
who require prolonged mechanical ventilation (PMV) are a
growing group of patients who provoke particular controversy
ADL = activity of daily living; DRG = diagnosis related group; IADL = instrumental activity of daily living; ICU = intensive care unit; PMV = prolonged
mechanical ventilation; SF-36 = Short Form 36-item questionnaire.
Critical Care Vol 11 No 1 Cox et al.
Page 2 of 11
(page number not for citation purposes)
with regard to their uncertain long-term outcomes and disabil-
ity as well as their disproportionate resource utilization [4].
Clinical decision making and policy making regarding PMV
provision is challenging because of the medical literature's
confusing array of PMV definitions, ranging from as few as 24
hours to more than 29 days [5,6]. As a result, some have
reported that PMV patients experience poor survival, low qual-
ity of life, diminished functional status and poor cognitive func-
tioning, and require substantial postdischarge care giving,
whereas other have demonstrated a survival benefit from PMV
[4,7-10]. A consensus group recently recommended defining
PMV as a total duration of ventilation of 21 days or more [11].
Many investigators favor Medicare's definition of tracheostomy
and ventilation for at least four days (diagnosis related groups
[DRGs] 541 and 542; formerly DRG 483) because diagnostic
codes facilitate data extraction from secondary databases and
permit linkage to payment data. However, the earlier timing of
tracheostomy placement may be altering the composition of
the DRG 541/542 population [12-14]. Defining PMV by ven-
tilator days, therefore, may be more specific for the most
resource-intensive critically ill patients, in addition to having
more meaning for the practicing clinician [4].
There also are problems with the PMV literature that extend
beyond definition. Namely, most data on the long-term health
experiences of PMV patients are cross-sectional and do not
include comparisons with those who are ventilated for shorter
periods of time [15]. Additionally, no prospective studies of
PMV patients, to our knowledge, have attempted to address
the methodological shortcomings associated with this popula-
tion's high rates of postdischarge death and dropout in longi-
tudinal analyses of health outcomes [16].
Together, these limitations represent a notable barrier to
understanding how different clinical factors affect outcomes
and the rate of recovery, assessing the overall cost-effective-
ness of PMV, meeting the informational needs of patients and
families, and informing decisions regarding interventions in
this expanding patient group [12,17,18]. To address these
issues, we performed novel analyses of previously collected
data from a prospective cohort of critically ill patients, with the
following a priori hypothesizes: identification of PMV patients
using DRG 541/542 is less specific for selecting a resource-
intensive patient group than a definition of ≥ 21 days of
mechanical ventilation; and patients with PMV have higher
mortality rates, worse quality of life, and greater functional lim-
itations at one year than patients requiring shorter periods of
mechanical ventilation.
Materials and methods
Patients, study site, and procedures
These analyses are based on data that were originally col-
lected at the University of Pittsburgh Medical Center in the
QOL-MV (Quality of Life After Mechanical Ventilation in the
Aged) study, a one-year prospective cohort study whose pro-
tocol has been described elsewhere [19,20]. Briefly, all
patients aged 18 years or older who received mechanical ven-
tilation for ≥ 48 hours in the medical, general surgical, trauma,
and neurologic intensive care units (ICUs) were screened for
enrollment. Exclusion criteria were lack of English fluency,
receipt of a solid organ transplant, prisoners, baseline chronic
ventilation, and hospital transfers ventilated for more than 24
hours before arrival. Data were collected between 1997 and
2000.
Data collection
In baseline in-hospital interviews, study staff recorded
patients' sociodemographics, prehospital functional status
and physical function aspects of quality of life, medical comor-
bidities, length of ICU and hospital stay, day one Acute Physi-
ology and Chronic Health Evaluation III score, diagnostic
category (medical, surgical, trauma, or other), and admitting
source (emergency room, ward transfer, postoperative, out-
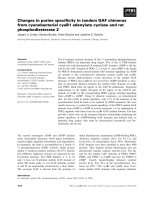
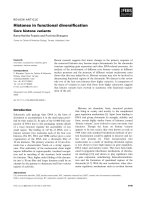
side transfer, other; Figure 1) [21-25]. In postdischarge follow-
up interviews (at 2, 6, and 12 months) patient vital status, qual-
ity of life, functional status, and need for care giver assistance
were recorded. Approximately one-third of interviews involved
the use of proxy responses by patients' designated informal
care givers because of patients' severe illnesses or degree of
cognitive dysfunction. Mini follow-ups (at 2, 6, and 12 months)
were abbreviated interviews conducted in those patients or
care giver proxies who were unable or unwilling to complete
the full follow-up protocol.
Quality of life was measured using the Short Form 36-Item
questionnaire (SF-36), a questionnaire for which there is evi-
dence of validity among ICU survivors [26]. We reported val-
ues for the SF-36's physical function and role physical
domains preferentially because of their objective nature and
amenability to proxy assessment. Functional status was meas-
ured as the number of dependencies in activities of daily living
(ADLs) and instrumental activities of daily living (IADLs)
[22,24]. We quantified medical comorbidities using the Charl-
son index, a validated measure with higher scores indicating
greater burden of illness [21]. Mortality was recorded from
medical records, physician reports, death certificates, and the
Social Security Death Index [27]. Costs were obtained by mul-
tiplying hospital charges by Medicare cost to charge ratios
and adjusted to 2005 US$ using the medical component of
the consumer price index [28].
Outcomes
Our primary outcomes were one-year survival, functional sta-
tus, quality of life, and hospital costs. The main group of inter-
est was patients with PMV, which we defined in two different
ways: DRG 541/542 (mechanical ventilation for ≥ 96 hours
with placement of tracheostomy for non-head and neck diag-
noses either with [DRG 541] or without [DRG 542] an opera-
tive diagnosis) and ventilation for ≥ 21 days total (with
Available online />Page 3 of 11
(page number not for citation purposes)
ventilation discontinued for no more than 48 hours). We
defined a comparative short-term mechanical ventilation group
as those ventilated for ≥ 48 hours who did not meet either
PMV definition.
Regarding DRGs, Medicare reimburses US acute hospital
care based on adjustment of a base payment by one of these
526 condition-specific weights. This condition-adjusted DRG
payment can be further adjusted for hospital-specific factors
such as local wage, participation in medical education, and
volume of indigent care provided. DRG 541/542 has a very
high relative weight, meaning that reimbursement is higher
than for many other common conditions.
Statistical analyses
We addressed the problem of missing data due to death and
disability common to longitudinal critical care outcomes stud-
ies by using multiple imputation and linear mixed-effects mod-
els. In contrast to single imputation methods (for example, last
observation carried forward or mean substitution), multiple
imputation replaces each missing value by multiple values
[29]. We chose not to use a single imputation method
because it would not have accurately reflected the uncertainty
that is imposed by filling in a single missing value, leading to
standard errors that are too small. Instead, multiple imputation
reflects missing data uncertainty and results in multiple ver-
sions of a complete dataset. Each of these multiple versions
are analyzed using the same model, and the estimates and
standard errors from each model are combined using Rubin's
rules [30]. The combined estimates incorporate both within-
and between-imputation variability, and therefore they reflect
missing data uncertainty. In addition, linear mixed-effects mod-
els are particularly useful for longitudinal data because each
patient can have an unequal number of observations, although
individuals with more observations will contribute more pre-
cise information to parameter estimation [31]. Both of these
methods assume that the reason for dropout is 'ignorable'
[30].
We first compared baseline characteristics between patient
groups (DRG 541/542 versus short-term ventilation) using χ
2
tests for dichotomous variables and two-sample t-tests for
continuous variables. For longitudinal analyses involving hos-
pital survivors, ten multiply imputated datasets were generated
under a multivariate normal model using Markov chain Monte
Carlo methods in the SAS function PROC_MI. We then fitted
Figure 1
Flowchart of participants in the study by DRG 541/542 statusFlowchart of participants in the study by DRG 541/542 status. Diagram demonstrates enrollment of 817 patients into this prospective study. DRG,
diagnosis related group.
Critical Care Vol 11 No 1 Cox et al.
Page 4 of 11
(page number not for citation purposes)
linear mixed-effects models using the SAS function
PROC_MIXED [16]. Our linear mixed models incorporated
potentially confounding baseline variables found to have an
association (P < 0.20) with both DRG 541/542 status and the
outcome of interest, including preadmission Charlson score,
preadmission IADLs, admission diagnosis, admission source,
education level, age, and APS. These adjusted models
allowed us to compare PMV group-level growth curves of
quality of life and functional status scores over the course of
one year and to determine the extent to which these trajecto-
ries were modified by patient characteristics. The mixed-
effects models were fitted to the ten imputed datasets, and
parameter estimates and standard errors were combined
using the SAS function PROC_MIANALYZE.
We also contrasted one-year survival between groups by PMV
status (DRG 541/542 versus short-term ventilation) using a
piecewise-constant time-varying nonproportional hazard
model to generate hazard ratios and 95% confidence intervals
for PMV status, a variable that we found to violate the propor-
tional hazards assumption when tested using scaled Schoen-
feld residuals and log-log plots [32]. We included in the model
preadmission IADLs and Charlson score, day one APS, admit-
ting service, age, and education status, because these varia-
bles exhibited group-level differences of statistical (P < 0.20)
or clinical significance.
Stata 9 (Statcorp, College Station, TX, USA) and SAS 9.1
(SAS Institute Inc., Cary, NC, USA) were used in analyses. The
institutional review board of the University of Pittsburgh
approved the original protocol, and Duke University's institu-
tional review board approved this secondary analysis.
Results
Baseline sociodemographics and clinical characteristics
A total of 817 patients drawn from a potential pool of 1123
patients ventilated for 48 hours were included in the study, of
whom 267 (33%) met our study criteria for DRG 541/542
(Figure 1). A total of 114 (14%) of the 817 patients were ven-
tilated for ≥ 21 days, 88 (77%) of whom received tracheosto-
mies and therefore also met the definition of DRG 541/542.
The median age was around 65 years in both groups and most
patients were male, white, lived at home before admission, and
were treated in a medical ICU (Table 1). Compared with
patients ventilated short term, DRG 541/542 patients had less
medical comorbidities, fewer dependencies in ADLs and
IADLs, and better preadmission SF-36 physical function
scores (all P < 0.02). Sociodemographics, work status before
admission, and admission source were not significantly differ-
ent between persons ventilated short term and those venti-
lated for prolonged periods (P > 0.05).
Health outcomes
Mortality
DRG 541/542 patients had significantly lower in-hospital mor-
tality (20% versus 43%; P < 0.0001) and one-year mortality
(48% versus 59%) compared with short-term ventilation
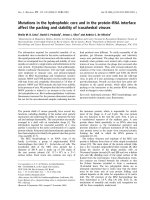
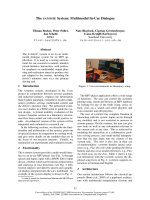
patients (Table 2). Considering DRG 541/542 patients alone,
mortality increased with patient age (Figure 2), although there
were statistically significant adjusted one-year mortality differ-
ences only between patients in the 65–74, 75–84, and ≥ 85
year age groups (all P < 0.01). In-hospital and one-year mor-
tality appeared higher for those ventilated for ≥ 21 days than
for DRG 541/542 patients (statistical comparison not per-
formed because of overlap between the groups). Mortality did
not differ significantly between patient age strata (P = 0.30 by
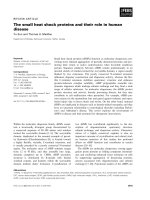
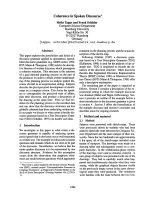
log-rank test) for patients ventilated ≥ 21 days. Patients venti-
lated for ≥ 21 days who did not receive a tracheostomy had
particularly high mortality (Figure 3).
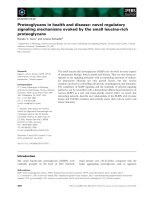
The piecewise-constant time-varying survival model generated
adjusted hazard ratios (95% confidence interval) for DRG
541/542 status compared with short-term ventilation over the
course of follow up ranging from 0.05 (0.007–0.38) to 2.14
(1.15–3.99; Figure 4). Interestingly, hazard ratios for DRG
541/542 status ranged from 1.95 (1.05 to 3.63) to 2.14 (1.14
to 3.99) between 60 and 100 days after intubation, represent-
ing a higher risk for death, but they demonstrated no signifi-
cant group-based differences thereafter.
Quality of life and functional status
At one year, DRG 541/542 patients had significantly lower
SF-36 physical function scores and more ADL and IADL limi-
tations than short-term ventilation patients after adjusting for
clinical characteristics (Table 3). Although DRG 541/542
patients had more profound early disability, they exhibited a
similar, statistically significant rate of improvement in function
recovery compared with those ventilated for shorter periods of
time. Nonetheless, at one year the average DRG 541/542
patient had not returned to their preadmission functional sta-
tus and was still receiving weekly care giving assistance. There
were insufficient patient numbers to perform similar quality of
life analyses between short-term ventilation patients and those
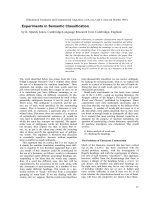
ventilated ≥ 21 days. However, there were clinically important
unadjusted functional status differences by PMV group (DRG
541/542 versus ventilation ≥ 21 days), although statistical
testing was not done because of patient overlap (Figure 5).
Resource utilization
PMV patients defined by DRG 541/542 had significantly
longer ICU and hospital length of stay, and their hospital costs
were substantially higher than those ventilated for shorter peri-
ods of time (Table 2). Costs per one-year survivor were
$165,075 for short-term ventilation patients, $266,105 for
DRG 541/542 patients, and $423,596 for patients ventilated
for ≥ 21 days. By identifying patients who received 'potentially
ineffective care', or high-intensity (> $100,000 per hospitaliza-
Available online />Page 5 of 11
(page number not for citation purposes)
Table 1
Baseline sociodemographics and clinical characteristics
Characteristic Short-term MV (n = 524) DRG 541/542 (n = 267) MV ≥ 21 days (n = 114)
Age 65 (49 to 75) 66 (45 to 75) 66 (47 to 74)
Age group (years)
≤ 34 57 (11%) 42 (16%) 12 (11%)
35–54 124 (24%) 59 (22%) 33 (29%)
55–64 79 (15%) 26 (10%) 10 (9%)
65–74 121 (23%) 68 (25%) 32 (28%)
75–84 110 (21%) 64 (24%) 25 (22%)
≥ 85 33 (6%) 8 (3%) 2 (2%)
Female 255 (48%) 110 (41%)* 45 (39%)
Race
a
Black 87 (16%) 35 (13%) 19 (17%)
White 435 (83%) 231 (87%) 94 (82%)
Other 2 (1%) 1 (1%) 1 (1%)
Marital status
Married 257 (49%) 133 (51%) 66 (59%)
Unmarried 259 (51%) 126 (49%) 45 (41%)
Education
High school or less 256 (86%) 159 (73%)* 69 (72%)
More than high school 140 (14%) 59 (27%) 27 (28%)
Income
< $20,000 139 (48%) 86 (57%) 33 (48%)
≥ $20,000 149 (52%) 64 (43%) 36 (52%)
Residence before hospitalization
Home 455 (87%) 251 (94%)* 106 (93%)
Rehab facility 10 (2%) 3 (1%) 0 (0%)
Nursing facility 55 (10%) 11 (4%) 7 (6%)
Other 4 (1%) 2 (1%) 1 (1%)
Work status before hospitalization
Employed 103 (21%) 63 (24%) 26 (24%)
Student 10 (2%) 5 (2%) 1 (1%)
Homemaker 50 (9%) 24 (9%) 10 (9%)
Retired 224 (46%) 108 (40%) 44 (40%)
Unemployed 68 (14%) 43 (16%) 17 (16%)
Disabled 36 (7%) 8 (3%) 11 (10%)
Charlson Index 2.4 (2.6) 1.8 (2.3)* 2.2 (2.7)
Missing 1 (1%) 0 (0%) 0 (0%)
ADLs 1.4 (2.1) 0.8 (1.7)* 1.0 (1.7)
†
Missing 84 (17%) 41 (12%) 16 (14%)
Critical Care Vol 11 No 1 Cox et al.
Page 6 of 11
(page number not for citation purposes)
tion) medical treatment associated with early death (survival <
100 days), we were able to estimate short-term cost-effective-
ness [33]. A total of 58 (22%) DRG 541/542 patients, 55%
of whom were aged 65 years or older, and 47 (41%) of
patients ventilated ≥ 21 days could be classified as having
received potentially ineffective care. By comparison, fewer
than 10% of the short-term ventilation patients received poten-
tially ineffective care, even considering their 36% in-hospital
mortality. Potentially ineffective care was associated with age,
total days of ventilation, male sex, and number of preadmission
IADLs (all P < 0.05 by logistic regression) but not with day one
APS, admission source, or admitting service.
Discussion
In this analysis of a large prospective cohort of mechanically
ventilated patients, we found that patients who required PMV,
particularly the elderly, remain at high risk for death during the
first year after critical care and experience persistent, signifi-
cant ICU-associated functional disability at great costs. This
study also reveals that the two suggested definitions for PMV,
DRG 541/542 and ventilation for ≥ 21 days, select cohorts
with similar baseline clinical characteristics and trends in sur-
vival, disposition, and resource utilization. Importantly,
however, PMV defined by ventilation for ≥ 21 days more spe-
cifically identifies patients who are outliers in resource con-
IADLs 2.9 (2.9) 2.0 (2.8)* 2.2 (2.8)
†
Missing 146 (28%) 56 (21%) 26 (23%)
SF-36 physical function 48 (39) 62 (38)* 56 (40)
†
Missing 135 (26%) 56 (21%) 22 (19%)
Primary admission diagnosis
Medical 350 (67%) 142 (53%)* 70 (61%)
Respiratory 140 (40%) 54 (38%) 29 (42%)
Cardiovascular 46 (13%) 14 (10%) 5 (7%)
Neurologic 77 (22%) 50 (35%) 19 (27%)
Other 87 (25%) 24 (17%) 17 (24%)
Surgical 198 (19%) 66 (25%) 25 (22%)
Trauma 44 (8%) 43 (16%) 9 (8%)
Missing 32 (6%) 16 (6%) 10 (9%)
Admission source
Direct admit 55 (11%) 28 (10%) 13 (11%)
Emergency room 133 (25%) 78 (29%) 27 (24%)
Floor 145 (28%) 55 (21%) 29 (25%)
ICU 14 (3%) 3 (1%) 1 (1%)
Operating room 98 (19%) 66 (25%) 25 (22%)
Transfer 47 (9%) 21 (8%) 9 (8%)
Missing 32 (6%) 16 (6%) 10 (9%)
APACHE III score: day 1 70 (30) 64 (26)* 69 (26)
Missing 25 (5%) 16 (6%) 10 (9%)
APS: day 1 57 (27) 53 (24)* 57 (24)
Missing 25 (5%) 16 (6%) 10 (9%)
Values are expressed as n (%), mean (standard deviation), or median (interquartile range). Statistical tests were performed between short-term
ventilation and either DRG 541/542 or ventilation ≥ 21 days groups. P values by χ
2
test (for percentages), two-sided t-tests (for means), and
Wilcoxon rank sum test (for medians).
a
Comparisons are white versus non-white, home versus non-home, employed versus not employed, medical
versus nonmedical diagnosis, and direct versus other admission. *P < 0.05 for comparison between short-term ventilation and DRG 541/542;
†
P
< 0.05 for comparison between short-term ventilation and ventilation ≥ 21 days. ADL, activity of daily living; APACHE, Acute Physiology and
Chronic Health Evaluation; APS, Acute Physiology Score; DRG, diagnosis related group; IADL, instrumental activity of daily living; ICU, intensive
care unit; MV, mechanical ventilation; SF-36, Short Form 36-item.
Table 1 (Continued)
Baseline sociodemographics and clinical characteristics
Available online />Page 7 of 11
(page number not for citation purposes)
Table 2
Clinical outcomes and resource utilization by definition of prolonged mechanical ventilation
Short-term MV (n = 524) DRG 541/542 (n = 267) MV ≥ 21 days (n = 114)
Mortality (cumulative)
In-hospital 227 (43%) 53 (20%)* 36 (31%)
†
(care limited) 114 (50%) 24 (45%)* 16 (44%)
†
2 months 257 (49%) 74 (28%)* 40 (35%)
6 months 289 (55%) 115 (43%)* 61 (54%)
12 months 308 (59%) 127 (48%)* 65 (58%)
Discharge disposition
Home 90 (17%) 19 (7%)* 5 (4%)
†
Rehabilitation facility 111 (21%) 77 (29%) 27 (24%)
Nursing home 81 (15%) 60 (22%) 28 (25%)
Ventilator facility 0 (0%) 45 (17%) 9 (8%)
Other hospital 15 (4%) 13 (5%) 9 (8%)
Dead 227 (43%) 53 (20%) 36 (31%)
Status at 1 year
Home 196 (37%) 134 (50%)* 47 (41%)
Rehabilitation facility 4 (1%) 2 (1%) 0 (0%)
Nursing home 16 (3%) 4 (2%) 2 (2%)
Dead 308 (59%) 127 (48%) 65 (57%)
Location of death
Home 15 (5%) 3 (2%) 0 (0%)
Rehab facility 2 (1%) 1 (1%) 0 (0%)
Nursing facility 27 (9%) 24 (19%) 5 (8%)
Ventilator facility 1 (< 1%) 9 (7%) 2 (3%)
Hospital 262 (85%) 89 (70%) 57 (87%)
Other 0 (0%) 1 (1%) 1 (2%)
Ventilator days 6 (4, 9) 16 (10, 24)* 27 (23, 36)
†
Reintubated 36 (7%) 46 (17%)* 25 (22%)
†
Ventilator days before
Tracheostomy - 10 (5, 14) 14 (10, 20)
n 0 (0%) 267 (100%) 88 (77%)
ICU length of stay 8 (5 to 12) 22 (14 to 31)* 30 (24 to 41)
†
Hospital length of stay 15 (9 to 21) 29 (22 to 38)* 39 (30 to 52)
†
Hospital costs/patient $40,968 ($25,773 to 65,959) $111,194* ($80,164 to 156,312) $152,709
†
($115,565 to
221,959)
Costs/hospital survivor $120,054 $164,956* $266,105
†
Costs/1-year survivor $165,075 $266,105* $423,596
†
Values are expressed as n (%), mean (standard deviation), or median (interquartile range). Statistical tests were performed between short-term
ventilation and either DRG 541/542 or ventilation ≥ 21 days groups. P values by χ
2
test (for percentages), two-sided t-tests (for means), and
Wilcoxon rank sum test (medians). Costs are presented in 2005 US$. *P < 0.05 for comparison between short-term ventilation and DRG 541/
542;
†
P < 0.05 for comparison between short-term ventilation and ventilation ≥ 21 days. DRG, diagnosis related group; ICU, intensive care unit;
MV, mechanical ventilation.
Critical Care Vol 11 No 1 Cox et al.
Page 8 of 11
(page number not for citation purposes)
sumption among ventilated patients. DRG 541/542 will
remain a useful identifier for selecting PMV patients from large
administrative databases, but the biases created by using this
definition should be acknowledged in future studies.
Our analyses also provide compelling new observations about
PMV patients related to their trajectories of post-discharge
health outcomes and resource utilization. First, unlike patients
ventilated for shorter periods of time, the majority of DRG 541/
542 deaths occurred after hospital discharge and was dispro-
portionately weighted toward the elderly. In addition to a high
risk for postdischarge death, the average one-year DRG 541/
542 survivor reported a notable burden of chronic illness
reflected by two dependencies in basic functioning, five
limitations in higher levels of functioning, and need for signifi-
cant amounts of unpaid care giving assistance from family
members. We also found that many PMV patients, particularly
those ventilated for at least 21 days, received care with ques-
tionable short-term cost-effectiveness. These findings may
help to clarify what PMV patients may experience regarding
the general rate and magnitude of their functional recovery as
well as reinforce others' concerns about the shifting of
increasingly ill patients to posthospital care venues [4,14,18].
However, these observations also reflect the current difficulty
in predicting PMV outcomes, because a physician's assess-
ment that the patient has a reasonable chance of survival and
basic functioning is inherent in their decision to place a
tracheostomy.
Figure 2
Survival by age group among DRG 541/542 patientsSurvival by age group among DRG 541/542 patients. Kaplan-Meier
plot demonstrating one-year survival stratified by age group among
DRG 541/542 patients. Patients aged < 55 years have noticeably bet-
ter overall survival than do older patients. Those < 55 years old also
experience very low mortality rates after two months, whereas other age
groups continue to die at relatively constant rates. P < 0.01 for compar-
isons between 65–74, 75–84, and ≥ 85 year age groups by logistic
regression and adjusted for day one APS, preadmission IADLs, admis-
sion source, admitting diagnostic group, and preadmission Charlson
score; P > 0.05 for comparisons between other age groups. APS,
Acute Physiology Score; DRG, diagnosis related group; IADL, instru-
mental activity of daily living.
Figure 3
Survival among all patients by duration of ventilation and tracheostomy statusSurvival among all patients by duration of ventilation and tracheostomy
status. Kaplan-Meier plot demonstrating one-year survival by PMV sta-
tus. The group with the best survival is those who were ventilated for <
21 days and who received a tracheostomy. Persons ventilated for at
least 21 days but who did not receive a tracheostomy experienced the
worst survival. Other groups had intermediate one-year survival. MV,
mechanical ventilation; PMV, prolonged mechanical ventilation.
Figure 4
Hazard ratios for prolonged mechanical ventilation status over one year of follow upHazard ratios for prolonged mechanical ventilation status over one year
of follow up. Plot of hazard ratios (solid line) and 95% confidence inter-
vals (dashed lines) for DRG 541/542 patients versus short-term
mechanical ventilation patients, determined using a time-varying piece-
wise-constant nonproportional survival model. The shaded areas repre-
sent time periods with statistically significant hazard ratios. The hazard
ratios vary over time, predicting an early (< 30 days after intubation)
lower risk for death for DRG 541/542 relative to short-term ventilation
patients, but a higher risk for mortality between days 60 and 100 as the
slope of short-term ventilation mortality levels off (also see Figure 2).
Hazard ratios are adjusted by day one APS, pre-admission Charlson
score, age, and pre-admission ADLs. APS, Acute Physiology Score;
ADL, activity of daily living; DRG, diagnosis related group.
Available online />Page 9 of 11
(page number not for citation purposes)
Comparison of our findings with work by others is challenging
because of differences in PMV definition and study design.
Past research has shown one-year survival rates to range from
39% to 25%, similar to our patients [14,34]. Still others have
described PMV hospital survival and reported contradictory
findings regarding group-based mortality [9,35]. To our knowl-
edge, however, one-year health outcomes of PMV patients
have not been compared with concurrently enrolled non-PMV
patients [36]. PMV patient costs in this study are similar to
past work when adjusted to 2005 US$, although our assess-
ments of potentially ineffective care are unique [4].
This study has limitations that are worth emphasizing. First,
there was a significant amount of missing data due to death
and inability to complete interviews, although we used novel
statistical analyses to address these deficits. Because
patients who could not complete interviews were more likely
to have received PMV and also to have higher severity of ill-
ness scores, it is likely that this omission resulted in an under-
estimate of the PMV cohort's actual disability. Some may
disagree with our choice to include both patient and proxy
assessments of physical function in our analyses, although
past experience with proxy-completed questionnaires has
determined their reliability and validity [37]. Also, because of
the unclear effect that refusals and eligibility factors during the
enrollment of the original cohort had on our post hoc patient
groups, our findings should be considered carefully. Finally,
because this study was performed using a secondary source,
it is susceptible to personal interpretational biases.
PMV provision and its associated $20 billion in annual inpa-
tient costs have a profound effect on the health care system
and those navigating within it [4]. Patients do not know what
to expect from a course of PMV, and their family members
Table 3
One-year health outcomes of hospital survivors by DRG 541/542 status
Unadjusted
a
Adjusted analyses for DRG 541/542 versus short-term MV
b
Short-term MV DRG 541/542 Between group
difference (95% CI)
tP
ADLs
Preadmission 1.2 (1.9) 0.9 (1.8) -0.3 (-0.6 to +0.04) -1.70 0.09
2 months 2.5 (2.1) 4.1 (1.9) 1.6 (1.0 to 2.2) 5.81 < 0.0001
6 months 1.9 (2.1) 2.8 (2.1) 0.9 (0.3 to 1.5) 3.29 0.003
12 months 1.6 (2.0) 2.3 (2.1) 0.7 (0.2 to 1.2) 2.97 0.005
IADLs
Preadmission 2.4 (2.8) 2.1 (2.7) -0.4 (-0.9 to +0.1) -1.41 0.16
2 months 4.8 (2.4) 5.7 (2.1) 0.9 (0.4 to 1.4) 3.60 0.0006
6 months 3.7 (2.6) 5.2 (2.4) 1.5 (0.8 to 2.2) 4.20 0.0003
12 months 3.4 (2.7) 4.8 (2.6) 1.4 (0.9 to 2.0) 4.86 < 0.0001
SF-36 physical
function
Preadmission 56 (38) 61 (37) 5 (-2 to +12) 1.39 0.17
2 months 29 (28) 15 (23) -14 (-19 to -8) -5.03 < 0.0001
6 months 42 (33) 28 (30) -14 (-22 to -6) -3.69 0.0006
12 months 46 (34) 31 (31) -15 (-22 to -7) -3.98 0.0002
SF-36 role physical
Preadmission 53 (42) 59 (43) 6 (-3 to +14) 1.30 0.20
2 months 26 (30) 19 (25) -7 (-13 to -1) -2.48 0.01
6 months 44 (35) 36 (32) -8 (-16 to -1) -2.20 0.03
12 months 46 (36) 41 (34) -5 (-14 to +4) -1.21 0.23
Analyses for short-term mechanical ventilation (n = 312) and DRG 541/542 (n = 214) patients.
a
Values from two-sample t-tests are expressed as
means (standard deviation).
b
Values are expressed as mean (95% confidence interval) based on linear-mixed effects models. Both unadjusted and
linear mixed-effects models included imputed values and adjusted for day 1 APS, admitting service, pre-admission IADLs, pre-admission Charlson
score, age ≥ 65 years, and education status. ADL, activity of daily living; DRG, diagnosis related group; IADL, instrumental activity of daily living;
SF-36, Short Form 36-item questionnaire.
Critical Care Vol 11 No 1 Cox et al.
Page 10 of 11
(page number not for citation purposes)
have a high prevalence of depression and postdischarge care
giving burden [18,38]. Also, clinicians struggle with PMV deci-
sion making because available prognostic models cannot
match these patients' individuality [39]. Considering these
observations, we believe that attention should be focused on
developing PMV-specific health outcome prediction models,
improving physician-family and physician-patient
communication, and conducting formal economic analyses of
PMV provision.
Conclusion
PMV defined as ventilation for ≥ 21 days is more specific than
DRG 541/542 (previously DRG 483) as marker of resource
utilization and potentially ineffective care for true outliers of
critical care, namely the chronically critically ill. However, the
more sensitive term DRG 541/542 captures a group that
nonetheless has persistent postdischarge deficits in
functioning that are more profound than the disability of short-
term ventilation recipients. Researchers should consider care-
fully the implications of these different PMV definitions based
on the goals of future studies.
Figure 5
Quality of life and functional status over time for PMV patientsQuality of life and functional status over time for PMV patients. The gray bars represent PMV patients ventilated for ≥ 96 hours with a tracheostomy
(DRG 541/542), and the black bars represent PMV patients ventilated for ≥ 21 days. Mean values are shown above the bars corresponding to
scores on the SF-36 physical function and physical role scores as well as for limitations in both instrumental (IADLs) and basic (ADLs) activities of
daily living. Because of the overlap of 88 persons in these two PMV groups, group-based statistical tests were not performed. ADL, activity of daily
living; DRG, diagnosis related group; IADL, instrumental activity of daily living; PMV, prolonged mechanical ventilation; SF-36, Short Form 36-item
questionnaire.
Key messages
• Patients receiving mechanical ventilation for ≥ 21 days
after acute illness have one-year mortality similar to that
in patients receiving mechanical ventilation for shorter
periods.
• Hospital costs for patients receiving PMV are substan-
tially higher than for patients ventilated for shorter peri-
ods, and up to 41% of PMV patients receive potentially
ineffective care.
• Identification of PMV patients using DRG 541/542,
rather than the definition ≥ 21 days of mechanical venti-
lation, selects patients who have lower illness severity,
lower mortality, and lower hospital costs.
• Despite having better baseline functional status than
patients ventilated for shorter periods, DRG 541/542
patients have lower functional capabilities after one
year.
Available online />Page 11 of 11
(page number not for citation purposes)
Competing interests
The authors declare that they have no competing interests.
Authors' contributions
CC conceived this secondary study, performed statistical
analyses and interpreted data, and drafted the manuscript. SC
interpreted data and drafted the manuscript. MO and JHL per-
formed statistical analyses and drafted the manuscript. JG
interpreted the data and drafted the manuscript. LC obtained
funding for the original study, designed the original study,
gathered data for the original study, supervised this study, and
revised the manuscript critically. CC, SC, MO, JHL, and LC
have given final approval of the version to be published.
Acknowledgements
This research was supported by National Institutes of Health grants K23
HL081048 (CC), K23 HL067068 (SC), and RO1 AG11979 (LC). The
funding agency had no role in study design, data collection, data analy-
sis, data interpretation, writing of the manuscript, or in the decision to
submit the manuscript for publication.
References
1. Dasta JF, McLaughlin TP, Mody SH, Piech CT: Daily cost of an
intensive care unit day: the contribution of mechanical
ventilation. Crit Care Med 2005, 33:1266-1271.
2. Angus DC, Kelley MA, Schmitz RJ, White A, Popovich J Jr: Caring
for the critically ill patient. Current and projected workforce
requirements for care of the critically ill and patients with pul-
monary disease: can we meet the requirements of an aging
population? JAMA 2000, 284:2762-2770.
3. Behrendt CE: Acute respiratory failure in the United States:
incidence and 31-day survival. Chest 2000, 118:1100-1105.
4. Carson SS, Bach PB: The epidemiology and costs of chronic
critical illness. Crit Care Clin 2002, 18:461-476.
5. Gillespie DJ, Marsh HM, Divertie MB, Meadows JA III: Clinical out-
come of respiratory failure in patients requiring prolonged
(greater than 24 hours) mechanical ventilation. Chest 1986,
90:364-369.
6. Gracey DR, Viggiano RW, Naessens JM, Hubmayr RD, Silverstein
MD, Koenig GE: Outcomes of patients admitted to a chronic
ventilator-dependent unit in an acute-care hospital. Mayo Clin
Proc 1992, 67:131-136.
7. Carson SS, Bach PB, Brzozowski L, Leff A: Outcomes after long-
term acute care. An analysis of 133 mechanically ventilated
patients. Am J Respir Crit Care Med 1999, 159:1568-1573.
8. Douglas SL, Daly BJ: Caregivers of long-term ventilator
patients: physical and psychological outcomes. Chest 2003,
123:1073-1081.
9. Kollef MH, Ahrens TS, Shannon W: Clinical predictors and out-
comes for patients requiring tracheostomy in the intensive
care unit. Crit Care Med 1999, 27:1714-1720.
10. Nelson JE, Tandon N, Mercado AF, Camhi SL, Ely EW, Morrison
RS: Brain dysfunction: another burden for the chronically crit-
ically ill. Arch Intern Med 2006, 166:1993-1999.
11. MacIntyre NR, Epstein SK, Carson S, Scheinhorn D, Christopher
K, Muldoon S: Management of patients requiring prolonged
mechanical ventilation: report of a NAMDRC consensus
conference. Chest 2005, 128:3937-3954.
12. Cox CE, Carson SS, Holmes GM, Howard A, Carey TS: Increase
in tracheostomy for prolonged mechanical ventilation in North
Carolina, 1993–2002. Crit Care Med 2004, 32:2219-2226.
13. Quintel M, Roth H: Tracheostomy in the critically ill: clinical
impact of new procedures. Intensive Care Med 1999,
25:326-328.
14. Scheinhorn DJ, Chao DC, Stearn-Hassenpflug M, LaBree LD, Hel-
tsley DJ: Post-ICU mechanical ventilation: treatment of 1,123
patients at a regional weaning center. Chest 1997,
111:1654-1659.
15. Engoren M, Arslanian-Engoren C, Fenn-Buderer N: Hospital and
long-term outcome after tracheostomy for respiratory failure.
Chest 2004, 125:220-227.
16. Muthen B, Muthen LK: Integrating person-centered and varia-
ble-centered analyses: growth mixture modeling with latent
trajectory classes. Alcohol Clin Exp Res 2000, 24:882-891.
17. Daly BJ, Douglas SL, Kelley CG, O'Toole E, Montenegro H: Trial
of a disease management program to reduce hospital
readmissions of the chronically critically ill. Chest 2005,
128:507-517.
18. Nelson JE, Kinjo K, Meier DE, Ahmad K, Morrison RS: When criti-
cal illness becomes chronic: informational needs of patients
and families. J Crit Care 2005, 20:79-89.
19. Quality of Life After Mechanical Ventilation in the Aged Investiga-
tors: 2-month mortality and functional status of critically ill
adult patients receiving prolonged mechanical ventilation.
Chest 2002, 121:549-558.
20. Chelluri L, Im KA, Belle SH, Schulz R, Rotondi AJ, Donahoe MP,
Sirio CA, Mendelsohn AB, Pinsky MR: Long-term mortality and
quality of life after prolonged mechanical ventilation. Crit Care
Med 2004, 32:61-69.
21. Charlson ME, Pompei P, Ales KL, MacKenzie CR: A new method
of classifying prognostic comorbidity in longitudinal studies:
development and validation. J Chronic Dis 1987, 40:
373-383.
22. Katz S, Ford AB, Moskowitz RW, Jackson BA, Jaffe MW: Studies
of illness in the aged. The index of ADL: a standardized meas-
ure of biological and physiological function. JAMA 1963,
185:914-919.
23. Knaus WA, Wagner DP, Draper EA, Zimmerman JE, Bergner M,
Bastos PG, Sirio CA, Murphy DJ, Lotring T, Damiano A, et al.: The
APACHE III prognostic system: risk prediction of hospital mor-
tality for critically ill hospitalized adults. Chest 1991,
100:1619-1636.
24. Lawton MP, Brody EM: Assessment of older people: self-main-
taining and instrumental activities of daily living. Gerontologist
1969, 9:179-186.
25. Ware JE Jr, Sherbourne CD: The MOS 36-item short-form
health survey (SF-36). I. Conceptual framework and item
selection. Med Care 1992, 30:473-483.
26. Heyland DK, Hopman W, Coo H, Tranmer J, McColl MA: Long-
term health-related quality of life in survivors of sepsis. Short
Form 36: a valid and reliable measure of health-related quality
of life. Crit Care Med 2000, 28:3599-3605.
27. Social Security Death Index [ />]
28. Consumer price indexes [ />]
29. Schafer JL: Analysis of Incomplete Multivariate Data 1st edition.
London, New York: Chapman & Hall; 1997.
30. Rubin DB: Multiple Imputation for Nonresponse in Surveys Hobo-
ken, NJ: Wiley-Interscience; 2004.
31. Verbeke G, Molenberghs G: Linear Mixed Models for Longitudinal
Data New York: Springer-Verlag; 2000.
32. Gray RJ: Flexible methods for analyzing survival data using
splines. J Am Stat Assoc 1992, 87:942-951.
33. Cher DJ, Lenert LA: Method of Medicare reimbursement and
the rate of potentially ineffective care of critically ill patients.
JAMA 1997, 278:1001-1007.
34. Gracey DR, Naessens JM, Krishan I, Marsh HM: Hospital and
posthospital survival in patients mechanically ventilated for
more than 29 days. Chest 1992, 101:211-214.
35. Williams TA, Dobb GJ, Finn JC, Webb SA: Long-term survival
from intensive care: a review. Intensive Care Med 2005,
31:1306-1315.
36. Douglas SL, Daly BJ, Gordon N, Brennan PF: Survival and quality
of life: short-term versus long-term ventilator patients. Crit
Care Med 2002, 30:2655-2662.
37. Hofhuis J, Hautvast JL, Schrijvers AJ, Bakker J: Quality of life on
admission to the intensive care: can we query the relatives?
Intensive Care Med 2003, 29:974-979.
38. Im K, Belle SH, Schulz R, Mendelsohn AB, Chelluri L: Prevalence
and outcomes of caregiving after prolonged (> or = 48 hours)
mechanical ventilation in the ICU. Chest 2004, 125:597-606.
39. Carson SS, Bach PB: Predicting mortality in patients suffering
from prolonged critical illness: an assessment of four severity-
of-illness measures. Chest 2001, 120:928-933.