Báo cáo khoa học: "Effect of mode of hydrocortisone administration on glycemic control in patients with septic shock: a prospective randomized trial" pptx
Bạn đang xem bản rút gọn của tài liệu. Xem và tải ngay bản đầy đủ của tài liệu tại đây (413.99 KB, 9 trang )
Open Access
Available online />Page 1 of 9
(page number not for citation purposes)
Vol 11 No 1
Research
Effect of mode of hydrocortisone administration on glycemic
control in patients with septic shock: a prospective randomized
trial
Pekka Loisa
1
, Ilkka Parviainen
2
, Jyrki Tenhunen
3
, Seppo Hovilehto
4
and Esko Ruokonen
2
1
Department of Intensive Care, Päijät-Häme Central Hospital, Keskussairaalankatu 7, FI 15850 Lahti, Finland
2
Department of Intensive Care, Kuopio University Hospital, P.O. Box 1777, FI 70211 Kuopio, Finland
3
Department of Intensive Care, Tampere University Hospital, P.O. Box 2000, FI 33521 Tampere, Finland
4
Department of Intensive Care, South Carelian Central Hospital, Valto Käkelän katu 1, FI 53130 Lappeenranta, Finland
Corresponding author: Pekka Loisa,
Received: 18 Oct 2006 Revisions requested: 24 Nov 2006 Revisions received: 1 Dec 2006 Accepted: 16 Feb 2007 Published: 16 Feb 2007
Critical Care 2007, 11:R21 (doi:10.1186/cc5696)
This article is online at: />© 2007 Loisa et al.; licensee BioMed Central Ltd
This is an open access article distributed under the terms of the Creative Commons Attribution License ( />),
which permits unrestricted use, distribution, and reproduction in any medium, provided the original work is properly cited.
Abstract
Introduction Low-dose hydrocortisone treatment is widely
accepted therapy for the treatment of vasopressor-dependent
septic shock. The question of whether corticosteroids should be
given to septic shock patients by continuous or by bolus infusion
is still unanswered. Hydrocortisone induces hyperglycemia and
it is possible that continuous hydrocortisone infusion would
reduce the fluctuations in blood glucose levels and that tight
blood glucose control could be better achieved with this
approach.
Methods In this prospective randomized study, we compared
the blood glucose profiles, insulin requirements, amount of
nursing workload needed, and shock reversal in 48 septic shock
patients who received hydrocortisone treatment either by bolus
or by continuous infusion with equivalent dose (200 mg/day).
Duration of hydrocortisone treatment was five days.
Results The mean blood glucose levels were similar in the two
groups, but the number of hyperglycemic episodes was
significantly higher in those patients who received bolus therapy
(15.7 ± 8.5 versus 10.5 ± 8.6 episodes per patient, p = 0.039).
Also, more changes in insulin infusion rate were needed to
maintain strict normoglycemia in the bolus group (4.7 ± 2.2
versus 3.4 ± 1.9 adjustments per patient per day, p = 0.038).
Hypoglycemic episodes were rare in both groups. No difference
was seen in shock reversal.
Conclusion Strict normoglycemia is more easily achieved if the
hydrocortisone therapy is given to septic shock patients by
continuous infusion. This approach also reduces nursing
workload needed to maintain tight blood glucose control.
Trial Registration Number ISRCTN98820688
Introduction
Surviving sepsis guidelines recommend low-dose corticoster-
oids for the treatment of vasopressor-dependent septic shock
[1]. In prospective randomized trials, hydrocortisone therapy
has shown a significant effect in septic shock reversal [2,3],
and in one large prospective study, a treatment with a hydro-
cortisone-fludrocortisone combination also reduced mortality
in the subgroup of patients who had a poor adrenal response
in the adrenocorticotrophic hormone stimulation test [4]. The
recommended hydrocortisone dosage is 200 to 300 mg daily
in three or four divided doses. Alternatively, hydrocortisone
may be administered by continuous infusion [5].
The tolerability of hydrocortisone therapy has been good in
previous studies and there is no evidence that corticosteroids
have increased the risk of gastrointestinal bleeding or risk of
secondary infections when used in septic shock [4,6]. How-
ever, hydrocortisone is a potent glucocorticoid and it stimu-
lates gluconeogenesis in both liver and peripheral tissues. It is
possible that corticosteroid treatment may induce hyperglyc-
emia and that the frequency of insulin use may increase with
corticosteroid exposure [7]. These effects must also be con-
sidered as major adverse events in critically ill patients.
Impaired glycemic control has been associated with increased
mortality in a heterogeneous population of critically ill patients
[8], and van den Berghe and coworkers [9] showed that
ICU = intensive care unit; SD = standard deviation.
Critical Care Vol 11 No 1 Loisa et al.
Page 2 of 9
(page number not for citation purposes)
preventing hyperglycemia with insulin substantially improved
outcome in critically ill surgical patients. This survival benefit
was also observed in a recent prospective study in a medical
intensive care unit (ICU) population that required ICU treat-
ment for more than three days [10]. In addition, corticosteroids
may increase the risk of critical illness polyneuropathy and
myopathy, and therefore the use of corticosteroids may be
associated with protracted weaning from mechanical ventila-
tion [7,11]. Prolonged hyperglycemia is one possible patho-
physiologic mechanism behind these complications [12].
So far, no studies have compared bolus versus continuous
hydrocortisone infusion regimen and their effects to blood glu-
cose profiles in septic shock [2,13]. International guidelines
do not precisely indicate which treatment modality would be
better [5]. The hypothesis of this study was that continuous
hydrocortisone infusion would reduce the occurrence of
hyperglycemic and hypoglycemic episodes when compared
to conventional bolus treatment. The purposes of this study
were to investigate how the different corticosteroid treatment
modalities would influence glucose profiles in septic shock
and to compare the reversal of shock and nursing workload
needed between two different hydrocortisone regimens.
Materials and methods
This prospective study was conducted between July 2005
and April 2006 in the ICUs of Kuopio University Hospital (Kuo-
pio, Finland), Tampere University Hospital (Tampere, Finland),
South Carelian Central Hospital (Lappeenranta, Finland), and
Päijät-Häme Central Hospital (Lahti, Finland). The study proto-
col was approved by the local ethics committees, and
informed consent was obtained from the patients or their first-
degree relatives.
Patients
Patients were prospectively enrolled in the study if they met
the criteria for septic shock defined according to the American
College of Chest Physicians/Society of Critical Care Medicine
Consensus Conference: (a) the presence of systemic inflam-
matory response syndrome (manifested by two or more of the
following criteria: fever [temperature of more than 38°C] or
hypothermia [temperature of less than 35.5°C], tachycardia
[more than 90 beats per minute], tachypnea [more than 20
breaths per minute], and leukocytosis or leukopenia [white
blood cell count of more than 12,000/mm
3
or less than 4,000/
mm
3
, respectively]), (b) documented source of infection, and
(c) hypotension despite adequate fluid resuscitation (systolic
blood pressure of less than 90 mm Hg or a decrease of systo-
lic blood pressure by 40 mm Hg or more from the baseline)
[14]. In addition, patients had to receive norepinephrine at any
dose to maintain mean arterial blood pressure above 65 mm
Hg. Patients under 18 years of age, patients with pre-existing
diabetes, and patients receiving glucocorticoids were
excluded from the study. Also, patients who died within 24
hours after the randomization were excluded from the analysis.
APACHE (Acute Physiology and Chronic Health Evaluation) II
score [15] and SAPS (Simplified Acute Physiology Score) II
[16] were calculated and the severity of organ dysfunction
was assessed using SOFA (Sepsis-related Organ Failure
Assessment) score [17] at the time of ICU admission. Hemo-
dynamic variables were recorded with arterial and Swan-Ganz
catheters. A pulmonary artery catheter was used in 42 (88%)
patients on the basis of clinical judgment.
Study intervention
When patients were considered to benefit from the corticos-
teroid treatment, they were randomly assigned to receive
hydrocortisone either by a conventional bolus therapy (50-mg
bolus of hydrocortisone every six hours intravenously) or by
continuous infusion with equivalent dose (200 mg/day).
Hydrocortisone treatment was started according to clinical
judgment when patients required high-dose or increasing
norepinephrine support [18]. Hydrocortisone was given in
hydrocortisone sodium succinate (Solu-Cortef
®
; Pharmacia,
now part of Pfizer Inc, Täby, Sweden), and when continuous
infusion was used, hydrocortisone was diluted in physiologic
saline. Randomization was performed in groups of four
patients by means of sequentially numbered opaque enve-
lopes. The duration of hydrocortisone treatment was five days.
After the randomization, a maintenance infusion of 5% glucose
was started at the rate of 30 ml/kg per day. At the same time,
a protocol-based enteral nutrition with standard formulas (1
kcal/ml) was initiated. Enteral feeding was started at 500 ml/
day with daily increments of 500 ml if possible. The maximum
amount of enteral nutrition was set at 1,500 ml/day. Blood glu-
cose levels were monitored from the arterial line every two
hours during the study period, and the goal was to maintain
blood glucose levels between 4 and 7 mmol/l (72 to 126 mg/
dl). Blood glucose measurements were performed with an
arterial blood gas analyzer. When the blood glucose level
exceeded 7 mmol/l (126 mg/dl), an insulin infusion of 1 IU/ml
(Actrapid
®
; Novo Nordisk A/S, Bagsvaerd, Denmark) was
started and the dose was adjusted according to a strict algo-
rithm (Table 1).
Sample size and statistical analysis
A sample size was calculated on the basis of detecting a dif-
ference of 1 mmol/l in mean blood glucose levels between the
study groups. A standard deviation (SD) of 1 mmol/l in blood
glucose level was assumed when calculating a sample size
based on previous studies [9]. A minimum of 17 patients were
required in each group (α = 0.05, power = 80%). ICU mortal-
ity was expected to be 30% and therefore 24 patients were
randomly assigned in both groups. Results are reported as
mean ± SD. Descriptive data were analyzed using the
unpaired t test for the continuous variables, and the categori-
cal data were analysed using a χ
2
test. Blood glucose profiles,
insulin requirements, and serial hemodynamic data were com-
pared with the analysis of variance for repeated measure-
Available online />Page 3 of 9
(page number not for citation purposes)
ments. Kaplan-Meier curves were calculated for shock
reversal, and the comparison between the groups was per-
formed with the log-rank test. All randomly assigned patients
were included for mortality and shock reversal analysis, and
the patients who died due to refractory hypotension during the
study period were considered as not having reversed septic
shock. A p value of less than 0.05 was considered significant.
Statistical analysis was performed using the SPSS 13.0 ver-
sion (SPSS Inc., Chicago, IL, USA).
The primary endpoint in the study was the difference in the
mean blood glucose levels between the study groups and the
occurrence of hyper- and hypoglycemic episodes. Secondary
endpoints included the reversal of shock and the amount of
nursing workload required to maintain strict normoglycemia.
The nursing workload was estimated by recording the number
of adjustments in insulin infusion during the study period.
Hyperglycemia was defined as a blood glucose level of more
than 7 mmol/l (126 mg/dl) and severe hyperglycemia as a
blood glucose level of more than 8.3 mmol/l (150 mg/dl) [19].
Hypoglycemia was defined as a blood glucose level of less
than 3 mmol/l (54 mg/dl) and severe hypoglycemia as a blood
glucose level of less than 2.2 mmol/l (40 mg/dl) [9]. Reversal
of shock was defined as a stable mean arterial pressure of
more than 65 mm Hg for at least 24 hours without norepine-
phrine support.
Table 1
Algorithm for glucose control in the study
Initial infusion
Blood glucose Insulin infusion rate Control interval
(mmol/l) (mg/dl) (hours)
7.0–9.9 126–179 1 IU/hour 2
10–11.9 180–214 2 IU/hour 1–2
> 12 > 215 4 IU/hour 1–2
Maintenance infusion
Blood glucose Insulin infusion rate Control interval
(mmol/l) (mg/dl) (hours)
< 2.5 < 45 10 % glucose 150 ml iv 0.5
< 3.0 < 54 Stop insulin 1
3.1–3.9 55–71 Reduce insulin dose by half 1
4.0–4.9 72–89 Reduce by 0.5 IU/hour 2
5.0–6.9 90–125 Insulin dose unchanged 2
7.0–9.9 126–179 Increase by 0.5–1 IU/hour 2
10–11.9 180–214 Increase by 1 IU/hour 2
> 12.0 > 215 Increase by 2 IU/hour 2
i.v., intravenously.
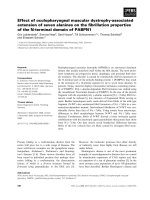
Figure 1
Flow diagram of the studyFlow diagram of the study. GI, gastrointestinal.
Critical Care Vol 11 No 1 Loisa et al.
Page 4 of 9
(page number not for citation purposes)
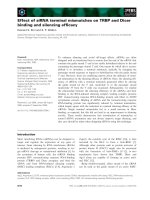
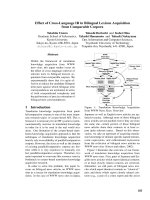
Results
A total of 48 patients were enrolled in the study. Two patients
in the infusion group and one in the bolus group died within 24
hours after the randomization and these patients were
excluded from the final analysis (Figure 1). These three
patients were included in shock reversal and mortality analysis.
Demographic data and the clinical characteristics of the
patients are presented in Table 2. There were no differences
between the two groups at the beginning of the study. In the
infusion group, 68% of the patients (15/22) were surgical
patients and the corresponding value in the bolus group was
48% (11/23); this difference was not statistically significant.
Five patients (three patients in the bolus group and two
patients in the infusion group) underwent surgical procedures
during the study. In two patients (one in the infusion group and
one in the bolus group), enteral nutrition had to be stopped
due to surgery, and in both patients one glucose measurement
was missed during the operation period.
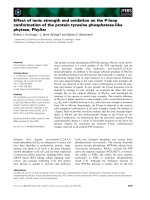
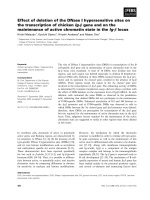
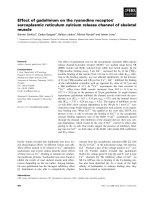
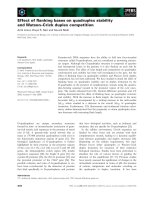
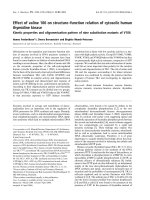
The mean daily blood glucose levels, insulin requirements, and
intake of calories are presented in Figures 2, 3 and 4, respec-
tively. There were no differences in mean daily blood glucose
levels between the study groups. Also, insulin requirements
and intake of calories were similar in the two groups. All
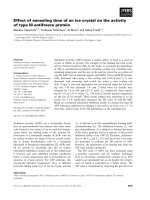
patients received exogenous insulin during the study. When
insulin requirements were adjusted to administered calories, a
trend of lower insulin requirements in the infusion group was
observed throughout the study period (Figure 5). However,
due to large individual variations, the difference between the
groups was not statistically significant.
The data concerning glycemic control are presented in Table
3. A total of 2,428 blood glucose measurements were per-
formed during the study, and 1,804 of them (74.3%) were
within the predetermined target range. The overall mean blood
glucose level was lower in the infusion group, but this differ-
ence of 0.2 mmol/l cannot be considered clinically significant.
Although the mean blood glucose levels were quite similar, the
hyperglycemic (more than 7 mmol/l [126 mg/dl]) episodes
were more common in the bolus group than in the infusion
group (p = 0.039). Severe hyperglycemia (blood glucose of
more than 8.3 mmol/l [150 mg/dl]) was rare in both study
groups and hypoglycemic episodes also were uncommon.
Three hypoglycemic (blood glucose of less than 3 mmol/l [54
mg/dl]) episodes were observed in the bolus group and only
one in the infusion group. Severe hypoglycemia (blood glu-
cose of less than 2.2 mmol/l [40 mg/dl]) was not observed in
either study group. The amount of nursing workload needed to
Table 2
Patient characteristics in the study
Bolus group (n = 23) Infusion group (n = 22) p value
Age (years) 61 ± 17 60 ± 16 0.732
APACHE II score 22.7 ± 5.6 22.5 ± 7.9 0.950
SAPS II 51.5 ± 11.3 52.2 ± 14.6 0.860
SOFA score 10.0 ± 2.1 10.3 ± 2.4 0.707
PaO
2
/FiO
2
ratio (mm Hg) 193 ± 110 176 ± 75 0.532
Cardiac index (l/minute per m
2
) 3.8 ± 1.7 3.6 ± 1.5 0.555
Mean arterial pressure (mm Hg) 62 ± 7.5 65 ± 7.9 0.188
Systemic vascular resistance (dyn·s/cm
5
) 623 ± 221 731 ± 254 0.158
SvO
2
(percentage) 61 ± 7.6 64 ± 12 0.462
Hemoglobin (g/l) 106 ± 22 105 ± 19 0.890
Leukocyte count (10
9
/l) 14.1 ± 9.2 9.6 ± 7.7 0.091
Platelet count (10
9
/l) 180 ± 103 141 ± 92 0.191
Plasma C-reactive protein (mg/l) 223 ± 115 197 ± 99 0.428
Serum lactate (mmol/l) 2.3 ± 1.6 2.8 ± 1.9 0.471
Norepinephrine dose (μg/kg per minute) 0.22 ± 0.12 0.19 ± 0.16 0.579
ICU mortality, n (percentage) 4 (17%) 7 (29%) 0.494
APACHE II, Acute Physiology and Chronic Health Evaluation II; ICU, intensive care unit;
PaO
2
/FiO
2
, arterial oxygen pressure/inspiratory fractional oxygen content; SAPS II,
Simplified Acute Physiology Score II; SOFA, Sepsis-related Organ Failure Assessment;
SvO
2
, mixed venous oxygen saturation.
Available online />Page 5 of 9
(page number not for citation purposes)
maintain normoglycemia was higher in the bolus group: more
insulin infusion rate adjustments were needed in the bolus
group compared to infusion-treated patients (p = 0.038).
Serial hemodynamic data are presented in Table 4. The
reversal of shock was similar in the study groups. The vaso-
pressor support could be withdrawn within 48 hours in 14
(58%) of the patients in the bolus group, and the correspond-
ing value in the infusion group was 12 (50%). After five days,
vasopressors were withdrawn in 20 patients (83%) in the
bolus group and in 15 patients (63%) in the infusion group.
Four patients in the infusion group and two patients in the
bolus group died due to refractory hypotension during the
study period. The overall ICU mortality was 23%.
Discussion
The main findings in the present study were that the hypergly-
cemic episodes were more common in those patients who
received hydrocortisone in bolus therapy and that the amount
of nursing workload needed to maintain normoglycemia was
higher in bolus-treated patients. Our findings suggest that, in
septic shock, strict normoglycemia is more easily achieved
Figure 2
Blood glucose levels (mean ± standard deviation) in the study groupsBlood glucose levels (mean ± standard deviation) in the study groups. P values represent the difference between the study groups (analysis of
variance).
Figure 3
Insulin requirements (mean ± standard deviation) in the study groupsInsulin requirements (mean ± standard deviation) in the study groups. P values represent the difference between the study groups (analysis of
variance).
Critical Care Vol 11 No 1 Loisa et al.
Page 6 of 9
(page number not for citation purposes)
with continuous hydrocortisone infusion. However, the differ-
ences between the study groups were rather marginal and in
both groups the normoglycemic goal could be achieved quite
successfully.
The most important risk associated with intensive insulin ther-
apy is the occurrence of severe hypoglycemia. This risk seems
especially likely to increase if the target range for the glucose
control is set at 4.4 to 6.1 mmol/l (80 to 110 mg/dl). In the
study of van den Berghe and coworkers [10], severe hypogly-
cemic episodes (less than 2.2 mmol/l [40 mg/dl]) were
observed in 25% of the long-stay ICU patients, and more
importantly, hypoglycemic episodes were associated with
increased mortality. In severely ill ICU patients, this risk seems
to be higher than in postoperative patients, and patients with
sepsis are especially vulnerable to hypoglycemia [10,20,21].
In our study, only four episodes (8.8%) of hypoglycemia (blood
glucose of less than 3 mmol/l [54 mg/dl]) were detected, and
more importantly, no severe hypoglycemic (less than 2.2
mmol/l [40 mg/dl]) episodes were observed in either study
group. These findings suggest that even a slightly more liberal
glucose control will prevent dangerous hypoglycemic epi-
Figure 4
Intake of calories (mean ± standard deviation) in the study groupsIntake of calories (mean ± standard deviation) in the study groups. P values represent the difference between the study groups (analysis of
variance).
Figure 5
Insulin requirements adjusted to administered calories (mean ± standard deviation) in the study groupsInsulin requirements adjusted to administered calories (mean ± standard deviation) in the study groups. P values represent the difference between
the study groups (analysis of variance).
Available online />Page 7 of 9
(page number not for citation purposes)
sodes very effectively. Other authors have also suggested that
blood glucose control might be somewhat more liberal than in
the study of van den Berghe and coworkers [22].
Certain limitations of this study should be addressed. The
study was not placebo-controlled or blinded. The major limita-
tion in our study was that the nutritional support in individual
patients was rather heterogeneous despite the unambiguous
feeding protocol. The majority of the study patients had septic
shock due to gastrointestinal primary disease (gastrointestinal
perforation or acute pancreatitis) and in these patients the
enteral feeding could not always be increased according to
Table 3
Glycemic control in study groups
Bolus group (n = 23) Infusion group (n = 22) p value
Mean blood glucose (mmol/l) 6.4 ± 0.7 6.2 ± 0.7 0.040
Blood glucose variation coefficient (percentage) 20.2 ± 6.9 16.5 ± 4.8 0.063
Blood glucose > 7 mmol/l (episodes per patient) 15.7 ± 8.5 10.5 ± 8.6 0.039
Blood glucose > 8.3 mmol/l (episodes per patient) 3.6 ± 3.4 2.6 ± 3.2 0.383
Mean insulin dose (IU/day) 66 ± 43 61 ± 40 0.381
Insulin infusion adjustments (number per patient per day) 4.7 ± 2.2 3.4 ± 1.9 0.038
Blood glucose < 3 mmol/l (episodes per group) 3 (13%) 1 (4.5%) 0.609
Blood glucose < 2.2 mmol/l (episodes per group) 0 0 n.s.
To convert glucose values to milligrams per deciliter, multiply by 18,015. n.s., not significant.
Table 4
Hemodynamic parameters in study groups
Day 1 Day 2 Day 3 Day 4 Day 5 p value
Heart rate (beats per minute)
Bolus group 107 ± 20 93 ± 20 85 ± 20 78 ± 22 86 ± 21 0.93
Infusion group 100 ± 21 95 ± 19 87 ± 23 86 ± 22 83 ± 15
Mean arterial pressure (mm Hg)
Bolus group 62 ± 7.5 75 ± 12 79 ± 13 85 ± 15 87 ± 15 0.06
Infusion group 65 ± 7.9 72 ± 9.4 72 ± 12 75 ± 13 79 ± 19
Cardiac index (liters/minute per m
2
)
Bolus group 3.8 ± 1.7 3.5 ± 1.1 3.5 ± 0.9 3.4 ± 1.0 3.4 ± 0.7 0.52
Infusion group 3.6 ± 1.5 3.9 ± 1.3 3.5 ± 1.1 3.6 ± 1.3 3.8 ± 1.5
SvO
2
(percentage)
Bolus group 61 ± 7.6 67 ± 7.2 69 ± 7.3 70 ± 7.6 69 ± 7.0 0.50
Infusion group 64 ± 12 65 ± 10 63 ± 11 66 ± 13 70 ± 13
SVR (dyn·s/cm
5
)
Bolus group 623 ± 221 770 ± 323 861 ± 249 999 ± 334 1,061 ± 200
Infusion group 731 ± 254 705 ± 248 818 ± 274 836 ± 332 832 ± 214
Shock reversal, n (percentage)
Bolus group 0/24 (0%) 3/24 (13%) 14/24 (58%) 18/24 (75%) 20/24 (83%) 0.48
Infusion group 0/24 (0%) 5/24 (21%) 12/24 (50%) 14/24 (58%) 15/24 (63%)
P values represent difference between the study groups (analysis of variance and log-rank test). SvO
2
, mixed venous oxygen saturation; SVR,
systemic vascular resistance.
Critical Care Vol 11 No 1 Loisa et al.
Page 8 of 9
(page number not for citation purposes)
the study protocol. In four patients (two in both groups),
parenteral nutrition was initiated during the study because
enteral feeding was not possible. In 16 patients, the maximum
intake of calories remained below 15 kcal/kg per day, and in
eight patients this underfeeding was due to the problems
associated with enteral nutrition. Additionally, nutritional goals
were not achieved in eight patients because they either died
or were discharged to the general ward before the completion
of the five day study period. The remaining eight patients
received poor nutrition because they either died or were dis-
charged to the general ward before the study period was com-
pleted. However, in those patients who stayed in the ICU for
the entire study period, the nutritional goals were achieved
quite successfully: the mean intake of calories in these
patients was 19.0 ± 6.0 kcal/kg per day with no detectable dif-
ferences between study groups. The standardization of nutri-
tional support has also been difficult in other trials concerning
critically ill patients [23].
Conclusion
Continuous hydrocortisone infusion reduced the number of
hyperglycemic episodes, and this approach also reduced the
nursing workload during intensive insulin therapy. Strict nor-
moglycemia is more easily achieved if hydrocortisone therapy
is given to septic shock patients by continuous infusion.
Competing interests
The authors declare that they have no financial competing
interests (reimbursements, fees, funding, or salary from an
organization) that may gain or lose financially from the publica-
tion of this manuscript. The authors also declare that they do
not hold any stocks or shares that may gain or lose financially
from the publication of this manuscript. The authors do not
have any non-financial competing interests to declare in rela-
tion to this manuscript.
Authors' contributions
PL participated in the study design and data collection, per-
formed statistical analysis, and wrote the manuscript. IP partic-
ipated in the study design, data collection, and analysis and
interpretation of the results. JT participated in the study
design, data collection, and analysis and interpretation of the
results and helped to write the manuscript. SH participated in
the study design and data collection and contributed to the
revision of the manuscript. ER participated in the study design
and in the analysis and interpretation of the results and helped
to write the manuscript. All authors read and approved the final
manuscript.
Acknowledgements
This study was supported by the Medical Research Fund of Tampere
University Hospital, Tampere, Finland, and the Medical Research Fund
of Päijät-Häme Central Hospital, Lahti, Finland.
References
1. Dellinger RP, Carlet JM, Masur H, Gerlach H, Calandra T, Cohen
J, Gea-Banacloche J, Keh D, Marshall JC, Parker MM, et al.: Sur-
viving sepsis campaign guidelines for management of severe
sepsis and septic shock. Intensive Care Med 2004,
30:536-555.
2. Bollaert PE, Charpentier C, Levy B, Depouverie M, Audibert G, Lar-
can A: Reversal of late septic shock with supraphysiologic
doses of hydrocortisone. Crit Care Med 1998, 26:645-650.
3. Briegel J, Forst H, Haller M, Schelling G, Kilger E, Kuprat G, Hem-
mer B, Hummel T, Lenhart A, Heyduck M, et al.: Stress doses of
hydrocortisone reverses hyperdynamic septic shock: a pro-
spective, randomized, double-blind, single-center study. Crit
Care Med 1999, 27:723-732.
4. Annane D, Sebille V, Charpentier C, Bollaert PE, Francois B,
Korach JM, Capellier G, Cohen Y, Azoulay E, Troche G, et al.:
Effect of treatment with low doses of hydrocortisone and
fludrocortisone on mortality in patients with septic shock.
JAMA 2002, 288:862-871.
5. Keh D, Sprung CL: Use of corticosteroid therapy in patients
with sepsis and septic shock: an evidence-based review. Crit
Care Med 2004, 32(11 Suppl):S527-S533.
6. Annane D, Bellissant E, Bollaert PE, Briegel J, Keh D, Kupfer Y:
Corticosteroids for severe sepsis and septic shock: a system-
atic review and meta-analysis. BMJ 2004, 329:480.
7. Rady MY, Johnson DJ, Patel B, Larson J, Helmers R: Corticoster-
oids influence the mortality and morbidity of acute critical
illness. Crit Care 2006, 10:R101.
8. Krinsley JS: Association between hyperglycemia and increased
hospital mortality in a heterogeneous population of critically ill
patients. Mayo Clin Proc 2003, 78:1471-1478.
9. van den Berghe G, Wouters P, Weekers F, Verwaest C, Bruyn-
inckx F, Schetz M, Vlasselaers D, Ferdinande P, Lauwers P, Bouil-
lon R: Intensive insulin therapy in critically ill patients. N Engl
J Med 2001, 345:1359-1367.
10. van den Berghe G, Wilmer A, Hermans G, Meersseman W, Wout-
ers PJ, Milants I, Van Wijngaerden E, Bobbaers H, Bouillon R:
Intensive insulin therapy in the medical ICU. N Engl J Med
2006, 354:
449-461.
11. De Jonghe B, Sharshar T, Lefaucheur JP, Authier FJ, Durand-Zale-
ski I, Boussarsar M, Cerf C, Renaud E, Mesrati F, Carlet J, et al.:
Paresis acquired in the intensive care unit: a prospective mul-
ticenter study. JAMA 2002, 288:2859-2867.
12. Bercker S, Weber-Carstens S, Deja M, Grim C, Wolf S, Behse F,
Busch T, Falke KJ, Kaisers U: Critical illness polyneuropathy and
myopathy in patients with acute respiratory distress
syndrome. Crit Care Med 2005, 33:711-715.
13. Oppert M, Schindler R, Husung C, Offermann K, Graf KJ, Boe-
nisch O, Barckow D, Frei U, Eckardt KU: Low-dose hydrocorti-
sone improves shock reversal and reduces cytokine levels in
early hyperdynamic septic shock. Crit Care Med 2005,
33:2457-2464.
14. American College of Chest Physicians/Society of Critical Care
Medicine Consensus Conference: Definitions for sepsis and
organ failure and guidelines for the use of innovative thera-
pies in sepsis. Crit Care Med 1992, 20:864-874.
15. Knaus WA, Draper EA, Wagner DP, Zimmerman JE: APACHE II: a
severity of disease classification system. Crit Care Med 1985,
13:818-829.
16. Le Gall JR, Lemeshow S, Saulnier F: A new Simplified Acute
Physiology Score (SAPS II) based on European/North Ameri-
can multicenter study. JAMA 1993, 270:2957-2963.
17. Vincent JL, Moreno R, Takala J, Willatts S, De Mendonca A, Bruin-
ing H, Reinhart CK, Suter PM, Thijs LG: The SOFA (Sepsis-
related organ failure assessment) score to describe organ
dysfunction/failure. Intensive Care Med 1996, 22:707-710.
Key messages
• In septic shock, continuous hydrocortisone infusion will
reduce the number of hyperglycemic episodes during
intensive insulin therapy.
• Continuous hydrocortisone infusion will also reduce the
nursing workload needed to maintain tight blood glu-
cose control.
Available online />Page 9 of 9
(page number not for citation purposes)
18. Dellinger RP: Cardiovascular management of septic shock.
Crit Care Med 2003, 31:946-955.
19. Cariou A, Vinsonneau C, Dhainaut JF: Adjunctive therapies in
sepsis: an evidence-based review. Crit Care Med 2004, 32(11
Suppl):S562-570.
20. Brunkhorst FM, Kuhnt E, Engel C, Meier-Hellmann A, Ragaller M,
Quintel M, Weiler N, Gründling M, Oppert M, Deufel T, et al.:
Intensive insulin therapy in patient with severe sepsis and
septic shock is associated with an increased rate of hypogly-
cemia-results from a randomized multicenter study (VISEP)
[abstract]. Infection 2005:19.
21. Viresendorp TM, van Santen S, DeVries JH, de Jonge E, Rosendaal
FR, Schultz MJ, Hoekstra JB: Predisposing factors for hypogly-
cemia in the intensive care unit. Crit Care Med 2006,
34:96-101.
22. Finney SJ, Zekveld C, Elia A, Evans TW: Glucose control and
mortality in critically ill patients. JAMA 2003, 290:2041-2047.
23. Preiser JC, Choléro R, Wernerman J: Nutritional papers in ICU
patients: what lies between the lines? Intensive Care Med
2003, 29:156-166.