Báo cáo khoa học: "Regional distribution of acoustic-based lung vibration as a function of mechanical ventilation mode" docx
Bạn đang xem bản rút gọn của tài liệu. Xem và tải ngay bản đầy đủ của tài liệu tại đây (1.08 MB, 13 trang )
Open Access
Available online />Page 1 of 13
(page number not for citation purposes)
Vol 11 No 1
Research
Regional distribution of acoustic-based lung vibration as a
function of mechanical ventilation mode
R Phillip Dellinger
1
, Smith Jean
1
, Ismail Cinel
1
, Christina Tay
1
, Susmita Rajanala
1
, Yael A Glickman
2
and Joseph E Parrillo
1
1
Division of Cardiovascular Disease and Critical Care Medicine, Robert Wood Johnson School of Medicine, University of Medicine and Dentistry of
New Jersey, Cooper University Hospital, 1 Cooper Plaza, Dorrance Building, Suite 393, Camden, NJ 08103, USA
2
Deep Breeze Ltd. 2 Hailan St., P.O. Box 140, North Industrial Park, Or-Akiva, 30600, Israel
Corresponding author: R Phillip Dellinger,
Received: 5 Dec 2006 Revisions requested: 16 Jan 2007 Revisions received: 23 Jan 2007 Accepted: 22 Feb 2007 Published: 22 Feb 2007
Critical Care 2007, 11:R26 (doi:10.1186/cc5706)
This article is online at: />© 2007 Dellinger et al.; licensee BioMed Central Ltd.
This is an open access article distributed under the terms of the Creative Commons Attribution License ( />),
which permits unrestricted use, distribution, and reproduction in any medium, provided the original work is properly cited.
Abstract
Introduction There are several ventilator modes that are used
for maintenance mechanical ventilation but no conclusive
evidence that one mode of ventilation is better than another.
Vibration response imaging is a novel bedside imaging
technique that displays vibration energy of lung sounds
generated during the respiratory cycle as a real-time structural
and functional image of the respiration process. In this study, we
objectively evaluated the differences in regional lung vibration
during different modes of mechanical ventilation by means of
this new technology.
Methods Vibration response imaging was performed on 38
patients on assist volume control, assist pressure control, and
pressure support modes of mechanical ventilation with constant
tidal volumes. Images and vibration intensities of three lung
regions at maximal inspiration were analyzed.
Results There was a significant increase in overall geographical
area (p < 0.001) and vibration intensity (p < 0.02) in pressure
control and pressure support (greatest in pressure support),
compared to volume control, when each patient served as his or
her own control while targeting the same tidal volume in each
mode. This increase in geographical area and vibration intensity
occurred primarily in the lower lung regions. The relative
percentage increases were 28.5% from volume control to
pressure support and 18.8% from volume control to pressure
control (p < 0.05). Concomitantly, the areas of the image in the
middle lung regions decreased by 3.6% from volume control to
pressure support and by 3.7% from volume control to pressure
control (p < 0.05). In addition, analysis of regional vibration
intensity showed a 35.5% relative percentage increase in the
lower region with pressure support versus volume control (p <
0.05).
Conclusion Pressure support and (to a lesser extent) pressure
control modes cause a shift of vibration toward lower lung
regions compared to volume control when tidal volumes are held
constant. Better patient synchronization with the ventilator,
greater downward movement of the diaphragm, and
decelerating flow waveform are potential physiologic
explanations for the redistribution of vibration energy to lower
lung regions in pressure-targeted modes of mechanical
ventilation.
Introduction
There are several ventilator modes that are more commonly
used for maintenance mechanical ventilation (MV) of the inten-
sive care unit (ICU) patient [1,2]. These include assist volume
control (VC), assist pressure control (PC), and pressure sup-
port (PS) modes. There is no conclusive evidence that one
mode of ventilation is better than another.
With most ventilators, selection of VC requires setting of tidal
volume (V
T
), respiratory rate (RR), and inspiratory flow rate or
time. In PC mode, pressure, RR, and inspiratory time are set.
In PS mode, the level of inspired pressure is set and all other
parameters are determined by the patient.
CV = coefficient of variation; FiO
2
= fraction of inspired oxygen; ICU = intensive care unit; MEF = maximal energy frame; MV = mechanical ventilation;
PC = assist pressure control; PEEP = positive end-expiratory pressure; PS = pressure support; RR = respiratory rate; SD = standard deviation; VC
= assist volume control; VRI = vibration response imaging; V
T
= tidal volume.
Critical Care Vol 11 No 1 Dellinger et al.
Page 2 of 13
(page number not for citation purposes)
The major differences between VC and the other two modes
are the inspiratory flow and pressure waveforms [3-5]. In VC
mode, the pressure rises throughout inspiration and the inspir-
atory flow can be constant, decelerating, or sine-patterned. On
the other hand, both PC and PS have a square pressure wave-
form and a decelerating inspiratory flow pattern, in which the
inspiratory flow rate is high at the beginning and decreases
with time. Although some studies have shown differences in
work of breathing [6], lung mechanics [7,8], and gas exchange
[8,9] in patients ventilated with these different waveforms, no
consistent reproducible findings have demonstrated the ben-
efit of one mode of ventilation over another. In fact, modes are
routinely chosen by the personal preference of the treating
physician or respiratory therapist.
Vibration response imaging (VRI) is a novel technology that
measures vibration energy of lung sounds generated during
the respiratory process. As air moves in and out of the lungs,
the vibrations propagate through the lung tissue and are
recorded by 36 surface skin sensors, which are spatially dis-
tributed and attached to the patient's back. The vibration
energy is transmitted to the VRI device, and a dynamic digital
image is created by means of specifically designed proprietary
software. An image is displayed using a gray-scale level (simi-
lar to ventilation scanning images of the lung), but in contrast
to radiolabeled ventilation scanning, VRI technology is non-
invasive and does not require the addition of a tracer to either
the inspired air or bloodstream. The transmission of an acous-
tic signal through the lungs is affected by air content and tis-
sue properties [10], and the ability to image the lungs by
means of an acoustic signal has been previously demon-
strated [11,12].
In the present study, we compare the vibration generated by
airflow in a lung ventilated with three different modes of MV:
VC, PC, and PS. Validation of the capability of VRI technology
to track changes in lung airflow and of the effect of different V
T
values on lung vibration is demonstrated in several subjects.
Some of the results included here have been previously
reported in our abstracts [13,14].
Materials and methods
Patients
The study protocol was approved by the Institutional Review
Board, and informed consent was obtained from all patients or
their next of kin. Thirty-eight patients (14 men, 24 women)
requiring mechanical ventilatory support in the ICU were
selected for the study (Table 1). Patients had a mean ± stand-
ard deviation (SD) age of 60 ± 16 years, fraction of inspired
oxygen (FiO
2
) of 0.41 ± 0.05, and positive end-expiratory
pressure (PEEP) of 5.2 ± 0.93 cm H
2
O and were mechani-
cally ventilated for 5 ± 5 days prior to the recordings. Patients
were ventilated with one of several types of ventilators: Puritan
Bennett 840 (Tyco Healthcare, Mansfield, MA, USA), Servo
900 C, 300, and 300A and the Servo I (Maquet, Inc., Bridge-
water, NJ, USA), and Bird 8400 ST (Bird Products Corp.,
Palm Springs, CA, USA). The selection of initial ventilator
Table 1
Patient characteristics (n = 38)
Number (percentage)
Gender
Male 14 (37%)
Female 24 (63%)
Chest x-ray findings
Atelectasis 20 (53%)
Pleural effusion 13 (34%)
Cardiomegaly 10 (26%)
Pulmonary edema 2 (5%)
Normal 2 (5%)
Other 6 (16%)
Reason for intubation
Respiratory distress or failure 27 (71%)
Dyspnea 7 (18%)
Airway protection 3 (8%)
Hypoxia or anoxia 3 (8%)
Patients may have more than one diagnosis and/or radiographic finding.
Available online />Page 3 of 13
(page number not for citation purposes)
mode was decided by the treating physicians and support
staff. The relationship between V
T
and flow on lung vibration
was demonstrated in four healthy volunteers.
Inclusion and exclusion criteria
Patients enrolled in the study were adults (18 to 84 years old)
who required minimal to moderate mechanical ventilatory sup-
port (peak airway pressure of less than or equal to 30 cm H
2
O,
PEEP of less than or equal to 8 cm H
2
O, FiO
2
of less than or
equal to 0.5, and RR of less than or equal to 30 breaths per
minute), who had no hypotension or severe hypertension, and
whose heart rate was in the acceptable range (that is, 60 to
115 beats per minute). Patients with hemodynamic instability
requiring vasopressors, chest cage or spine deformity, or skin
lesions or hirsutism on the back and any patient deemed una-
ble to be lifted to a near-sitting position with assistance were
excluded. Patients judged to have conditions that would make
maintenance of near-constant V
T
difficult (agitation, anxiety, or
unstable pulmonary status) were also excluded.
Study design
No patients were enrolled who were paralyzed or who were
sedated to the point of inability to interact with the ventilator.
All patients were capable of assisting the ventilator. Three
patients were judged as poor candidates for stand-alone PS
and were studied in VC and PC modes only. The modes used
were as follows:
VC: volume-targeted, time- or patient-triggered (based on the
frequency of patient respiratory effort), volume-cycled ventila-
tion with constant flow (square/rectangular inspiratory flow
waveform per protocol).
PC: pressure-targeted, time- or patient-triggered (based on
the frequency of patient respiratory effort), time-cycled ventila-
tion with variable flow (decelerating) and V
T
maintained near
the desired value by pressure adjustment.
PS: all breaths are pressure-targeted and patient-triggered.
Flow (decelerating), volume, and inspiratory time could vary
based on patient effort, and protocol targets the pressure
adjustment to hold V
T
near the desired value.
Because the great majority of ventilated patients included in
this study were on VC at the start of the experiment, the first
recordings were typically carried out on this mode, followed by
PC and then PS. Three patients were unable to trigger the ven-
tilator on PS, so no recording was carried out on this mode.
Subgroups of patients who received PC or PS during the first
recording (n = 3) or who were re-recorded in VC at the end of
the study (n = 6) were used to assess any effect due to the
lack of randomization. When switching from VC to PC and PS,
the ventilator was set (pressure adjusted) to achieve the target
V
T
delivered in VC mode. Inspiratory time was unchanged from
VC to PC and was determined by the patient on PS. V
T
, FiO
2
,
and PEEP were held constant.
In addition to the ventilated patients, 20 recordings were per-
formed on four non-intubated healthy volunteers at increasing
V
T
values (range 350 to 1,500 ml). This produced steadily
increasing flow rates. V
T
values were accurately measured
using a CPAP (continuous positive airway pressure) mask and
mechanical ventilator. RRs during recordings were kept con-
stant. The sum of the vibration energy in the lungs during each
breath cycle (inspiration and expiration) was calculated and
matched with each V
T
.
Recording procedure
The recordings were performed using a VRI device (Deep
Breeze Ltd., Or-Akiva, Israel) with two arrays of sensors (six
rows by three columns each) or microphones similar to those
used in digital stethoscopes. Each array was placed over a
lung on the patient's back. The rationale for posterior imaging
includes proximity to the lung and difficulty in imaging females
anteriorly. To gain access to the patient's back, the patient was
lifted to a near-sitting position. The recording was performed
during a 20-second period, capturing up to 10 respiratory
cycles. Following each recording, the suction was released
but the arrays were held in place to ensure no change in array
placement for subsequent recordings with different modes. A
normalized dynamic image was displayed after each record-
ing, and the raw data were stored digitally on the device for
later review and analysis.
The VRI dynamic image is created from a series of gray-scale
still images or frames, each of which represents 0.17 seconds
of vibration energy recording. The result is a movie depicting a
sense of air movement in the lungs. In addition, a graph is pro-
duced that represents the average vibration energy as a func-
tion of time throughout the respiratory cycle. Artifacts are any
distortions in the image which are not related to the condition
of the lungs and which are caused by extraneous noises (that
is, cough, sneeze, or grunt), vibrations (that is, from stridor or
the bed), or excessive motion by the patient during the record-
ing. Artifacts are easily identified in the image, and poor-quality
recordings were excluded. Overall, four patients (less than
10%) were excluded due to artifacts. Typical background ICU
noise has no effect on VRI recording.
VRI data analysis
Normalization was applied to a predetermined range of
frames. Within a frame, the areas with the highest vibration
energy are represented as black in a gray-level scale and the
areas with the lowest vibration energy are represented as light
gray. Areas of a frame are white if their energy is below a
signal-to-noise threshold determined by the VRI software. The
software displays a video containing those normalized frames
in shades of gray which reflect the intensity of vibration at each
stage of the respiratory cycle. The maximal energy frame
Critical Care Vol 11 No 1 Dellinger et al.
Page 4 of 13
(page number not for citation purposes)
(MEF) is the frame producing the maximal geographical area
of lung vibrations in the selected range of frames. In the
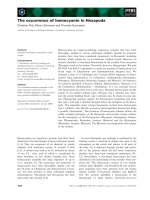
present study, this frame was used for analysis. Figure 1 is an
image from a recording of a 30-year-old, healthy, male non-
smoker (video of this recording is available online as Additional
file 1). Recordings are saved as both still MEF and dynamic
images, which can be analyzed either as a whole or according
to specific regions (left, right, upper, middle, and lower lung).
Although a very large amount of information is available within
the 20-second recording, it was necessary to select a method
of analysis from among various possibilities. Comparisons of
MEF areas and vibration energy were preferred techniques
because they provide straightforward quantification. MEFs
were extracted from normal, regular, and consistent cycles
available within each 20-second recording. Artifact-free MEFs
were extracted a priori from these selected cycles according
to predefined rules and criteria listed below. The MEF area of
the VRI image was measured using the software ImageJ
(National Institute of Health, Bethesda, MD, USA) [15].
Regional areas were obtained by first separating the image
into three regions on the basis of the rows of sensors (upper:
rows 1 and 2; middle: rows 3 and 4; and lower: rows 5 and 6).
Each segment was then measured with ImageJ. Because the
position of the sensors was kept the same for each image
recorded on a given patient, the three regions were standard-
ized across studies.
The regional vibration energy, which is not affected by normal-
ization of the image, was also analyzed. Vibration intensity is
computed in units of energy (watts × constant), reflecting the
acoustic energy associated with respiration. The vibration
energy was derived from the signal at each of the 36 sensors
as follows: the digitized acoustic signals were bandpass-fil-
tered between 150 and 250 Hz to remove heart and muscle
sounds; median filtering was applied to suppress impulse
noise, and truncation of samples above an automatically deter-
mined signal-to-noise threshold was performed. The resulting
signal was down-sampled to produce the vibration energy.
The regional distribution of vibration energy was also calcu-
lated for the frames of interest (MEFs) by means of proprietary
software. The percentage changes in vibration energy within
the lower lung region (two lower rows of sensors), the middle
lung region (two middle rows), and the upper lung region (two
upper rows) were calculated and then compared among differ-
ent modes of MV. The relative percentage changes within the
regions of the lung were also assessed to more clearly dem-
onstrate the shift in vibration energy and were also presented.
Selection of frames for analysis
Frames were selected a priori from the recordings on the basis
of the predefined rules and criteria listed below:
1. To correctly characterize respiratory cycles, the following
criteria were applied:
- Vibration intensity is lower between two cycles (from expira-
tion to inspiration) than within a same cycle (from inspiration to
expiration).
- The distance between expiration and the next inspiration in
the VRI energy graph is greater than the distance between
inspiration and expiration within the same cycle.
- The area of rapidly increasing vibration from baseline indi-
cates inspiration.
2. To correctly identify inspiration within a respiratory cycle,
these criteria were applied:
- The first dramatic rise of vibration in a cycle is inspiration.
- If there is no separation between inspiration and expiration in
the VRI energy graph, inspiration is considered to end at the
peak signal.
- If there is more than one peak in the cycle, the first peak is
considered the maximal inspiration signal.
- If there is a hint of separation in the form of a shoulder in the
VRI energy graph, the shoulder is considered an inspiration.
Figure 1
An example of a normal vibration response imageAn example of a normal vibration response image. A maximal energy
frame from a vibration response image recording of a healthy, 30-year-
old, male non-smoker is shown.
Available online />Page 5 of 13
(page number not for citation purposes)
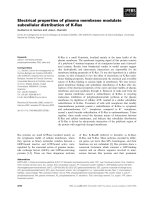
3. These criteria were applied in choosing the maximal inspira-
tion frame (Figure 2):
- The frame with the maximal energy within inspiration is cho-
sen for analysis.
- If inspiration and expiration are clearly separated, the MEF
during inspiration (first peak) is chosen (Figure 2a).
- If inspiration and expiration merge into one peak in the wave-
form, the frame closest to that peak is chosen from the image
(Figure 2b).
- If inspiration and expiration form a plateau, the first frame at
zero slope is chosen (Figure 2c).
- If there is no peak and the shoulder is curvilinear, the frame
nearest the inflection point is chosen (Figure 2d).
4. The following criteria were applied in choosing the range for
normalization of recording:
The dynamic image is produced by proprietary software and is
normalized based on a chosen range of frames. The MEF at
inspiration is selected for analysis.
- The chosen frame must have the highest energy in the range
chosen.
- If there is a peak in the waveform, the chosen range consists
of the two frames before and two frames after the peak. If this
captures a frame with energy greater than the chosen frame,
only frames with energy less than the chosen frame are
included.
- If there is no peak and only a shoulder, the chosen range con-
sists of the two frames before and the chosen frame.
The program SPSS (SPSS Inc., Chicago, IL, USA) was used
for statistical analysis. Mean ± SD or mean ± standard error of
the mean (SEM) are reported. Coefficients of determination for
linear regression (R
2
) were obtained using Microsoft
®
Office
EXCEL 2003 (Microsoft Corporation, Redmond, WA, USA).
The Kolmogorov-Smirnov goodness-of-fit test was used to
assess the normal distribution of the samples. The Wilcoxon
signed ranks test was used to analyze non-normally distributed
data, and paired t tests were performed for normally distrib-
uted data. A p value of less than 0.05 was considered statisti-
cally significant.
Results
Successive VRI recordings were performed two to five min-
utes apart and analyzed from 38 consecutive patients during
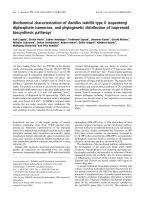
different modes of MV. Examples of still images of a mechani-
cally ventilated patient on VC, PC, and PS are displayed in Fig-
ure 3, and videos of these recordings are available online as
Additional files 2, 3, and 4, respectively. There were no differ-
ences in RR, heart rate, number of breaths per minute above
the set rate, blood pressure, oxygen saturation, PEEP, FiO
2
values, and V
T
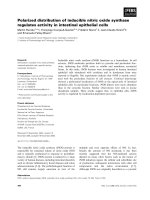
between the three modes (Table 2). Moreover,
the phase lag between airflow at the mouth and vibration was
minimal (less than 0.2 seconds) as demonstrated by various
inspiratory hold experiments (Figure 4).
Images and numeric vibration intensity values during maximal
inspiration were analyzed (Figure 5a,b). Data from 4 to 10
MEFs obtained during one recording were averaged. The
coefficient of variation (CV) was calculated for each set of
Figure 2
Selection of maximal inspiratory frames for analysisSelection of maximal inspiratory frames for analysis. Examples of frame
selection in various vibration response imaging (VRI) waveform patterns
are shown. The dot on the VRI waveform represents the area from
which the maximal energy frame was chosen for analysis. (a) When
inspiratory and expiratory vibrations are clearly separated, the maximal
energy frame during inspiration (first peak) is chosen. (b) When nspira-
tory and expiratory vibrations merge into one peak, the highest energy
frame is chosen. (c) When inspiratory and expiratory vibrations form a
plateau, first frame at zero slope is chosen. (d) When no clear separa-
tion exists between inspiratory and expiratory vibrations, and the frame
nearest the inflection point of the shoulder is chosen.
Critical Care Vol 11 No 1 Dellinger et al.
Page 6 of 13
(page number not for citation purposes)
MEFs, revealing rather low intra-patient variability (CV of less
than 10% for 95% of the data and CV of less than 5% for 80%
of the data). Furthermore, the lack of randomization did not
create a notable effect as assessed by analysis of the sub-
groups of patients recorded in a sequence other than VC-PC-
PS (n = 9) (data not shown).
The mean geographical area of the images recorded on PC
and PS, compared to VC, revealed a significant overall
increase in size (Figure 6a) (p < 0.001 for both). Each patient
was used as his or her own control for comparing percentage
change in area and total vibration signals. There was a signifi-
cant percentage increase in geographical area (Figure 7a) and
vibration (Figure 7b) from VC to PC and VC to PS (p < 0.02
for all). Although total vibration intensity was higher in PC and
PS compared to VC, the difference was not significant (Figure
6b).
Regional area analysis demonstrated that the increase in the
total area was due to the expansion of the lower lung region
whereas areas in the upper and the middle regions decreased
(Table 3). Assessment of relative percentage changes in areas
revealed an increase in area in the lower lung regions and a
decrease in the upper and middle regions (Figure 8a). When
comparing VC to PC and to PS, the data showed a shift in
image area away from the upper lung regions toward the
lower.
The regional vibration intensity values calculated from signals
recorded in the three modes showed similar trends. There was
a significant percentage increase in vibration intensity values
in the lower regions (Table 4). The relative increase in
Table 2
Parameters among different modes (n = 38)
VC PC PS p
Mean ± SD Mean ± SD Mean ± SD
Tidal volume (ml) 492 ± 86 479 ± 100 439 ± 137 NS
PIP (mm H
2
O) 28 ± 10 25 ± 7 22 ± 8 < 0.05
a
Respiratory rate (breaths per minute) 21 ± 6 22 ± 6 23 ± 9 NS
Breaths per minute above set respiratory rate 8.0 ± 6.3 8.3 ± 6.3 N/A NS
Oxygen saturation (percentage) 96 ± 4 96 ± 4 96 ± 3 NS
Heart rate (beats per minute) 90 ± 14 94 ± 14 95 ± 13 NS
Blood pressure (mm Hg) 132/74 ± 23/17 132/75 ± 28/18 131/74 ± 28/19 NS
a
PIP differed among all three modes. N/A, non-applicable; NS, not significant; PC, assist pressure control; PIP, peak inspiratory pressure; PS,
pressure support; SD, standard deviation; VC, assist volume control.
Figure 3
Vibration response images on various modes of mechanical ventilationVibration response images on various modes of mechanical ventilation. Maximal energy frames extracted from recordings of a 73-year-old mechani-
cally ventilated female with respiratory failure secondary to pancreatitis are shown. Chest radiography reported pleural fluid in both lungs. Assist vol-
ume control, assist pressure control, and pressure support are shown from left to right. L, left lung; R, right lung.
Available online />Page 7 of 13
(page number not for citation purposes)
vibrations in the lower region in PS versus VC was statistically
significant (Figure 8b) (p < 0.05). Here again, a shift of vibra-
tion toward the lower lung regions was noted.
We demonstrated a strong correlation between the V
T
values
and vibration energy in four healthy volunteers; the R
2
values
were 0.81, 0.74, 0.78, and 0.82. Figure 9 displays the relation-
ship between vibration and V
T
/airflow in one subject. Holding
RR constant as V
T
increases, the total lung vibration measured
with VRI increases linearly.
The mean peak airway pressures (± SD) in VC, PC, and PS
were 28 ± 10, 25 ± 7, and 22 ± 8 mm H
2
O, respectively.
These differences between the three modes were statistically
significant by paired t test analysis (VC-PC < 0.02, VC-PS <
0.001, and PC-PS < 0.02).
Discussion
The main finding of this study is that compared to VC, PS and
(to a lesser extent) PC modes are characterized by an overall
increase of geographical distribution of vibration in the lung.
Furthermore, in PS and PC, vibration energy is shifted toward
the lower lung regions when V
T
values are held constant. Two
different computing methods were used to assess the regional
distribution of vibration in the lungs: image analysis and raw
numerical data calculation. In contrast to image analysis, the
numerical method was not affected by normalization. The cor-
relation of vibration energy and airflow in healthy lungs sup-
ports the premise that the increase in vibration in the lower
lung regions in the subjects recorded within a two to five
minute period is correlated strongly with an increase in flow in
these regions. Because V
T
values were held constant, these
results suggest that the distribution of airflow in the lower lung
regions is greater in PC and PS compared to VC.
Two variables could contribute to a redistribution of airflow
toward the lower lung regions in PS and PC versus VC: differ-
ences in inspiratory flow pattern and synchronization of patient
diaphragmatic effort with the ventilator. PC and PS have a
decelerating flow pattern with higher flow rates at the begin-
ning of inspiration. This deceleration in flow is what may be
characterized as 'pure' because it is driven by a pressure dif-
ferential between patient and ventilator whereas the deceler-
ating inspiratory waveform of VC (not used in this study) is
determined by direct ventilator flow settings. The initial higher
flow in PC and PS may serve to prime (quickly fill) the proximal
airway, allowing more time for slower, more laminar flow to pro-
duce a more homogenous distribution of air to distal (lower)
lung regions. Albeit controversially, some investigators have
demonstrated that the decelerating flow waveform improves
oxygenation compared to square waveform, even in the same
mode (that is, square/rectangular versus decelerating VC)
[5,9,16]. Our study offers a possible reason for such an
improvement. The increase in total vibration observed in PS
and (to a lesser extent) PC, compared to VC, may be due to
the effect of higher initial flow on maximal vibration energy.
Patients who are mechanically ventilated may demonstrate
ventilator dysynchrony, in which the desired breathing patterns
do not match the ventilator and patient discomfort occurs
[17,18]. Among the three modes, PS is the closest to
spontaneous breathing in that the patient controls the length
of inspiration and RR and, in turn, the V
T
and inspiratory flow
rate are more adaptable to the patient's own ventilatory
demand [19].
The physiologic explanation for the increase in vibration in the
lower lungs during PS in our study could be the increase in
diaphragm-generated negative intrapleural pressure during
inspiration. Evidence has accumulated that diaphragmatic dis-
placements during spontaneous and mechanical breaths are
different. The increased use of muscles of inspiration in modes
Figure 4
Separation of inspiratory and expiratory signals in a vibration response imaging (VRI) waveformSeparation of inspiratory and expiratory signals in a vibration response
imaging (VRI) waveform. Separation of inspiratory and expiratory sig-
nals produced by application of an inspiratory hold during the second
breath in a mechanically ventilated patient is shown. Flow was sampled
directly from the ventilator and synchronized with VRI. The three wave-
forms depict pressure, flow, and vibration as a function of time. Exp.,
expiratory; Insp., inspiratory.
Critical Care Vol 11 No 1 Dellinger et al.
Page 8 of 13
(page number not for citation purposes)
Figure 5
Mean area and vibration among individual patientsMean area and vibration among individual patients. Mean areas of each patient (a) and mean vibration intensity values of each patient (b) on assist
volume control (VC), assist pressure control (PC), and pressure support (PS) are presented.
Figure 6
Total area and vibration intensity among modesTotal area and vibration intensity among modes. Mean total areas (a) and mean total vibration intensity values (b) on assist volume control (VC),
assist pressure control (PC), and pressure support (PS) are presented. Total area differed significantly between VC and PC as well as between VC
and PS. Data are presented as mean ± standard error of the mean.
Available online />Page 9 of 13
(page number not for citation purposes)
that are more amenable to this interaction, such as PC and PS
(in which inspiratory flow is affected by the degree of inspira-
tory muscle activity), could produce increased vibrations in
lower lung fields due to increased diaphragm activity. Because
this effect was also observed in PC, in which the breaths
above a set rate were not different than with VC, it is unlikely
to be a 'triggering'-produced effect only. Although ventilator-
triggered breaths were not differentiated from the patient-trig-
gered breaths in VC and PC, the lack of difference in breaths
above a set rate between these two modes supports this
premise. In VC, ventilated patients have limited capability to
produce effects on inspiration other than changing frequency
(no changes in inspiratory flow with changes in inspiratory
muscle activity). In PS and PC, increased diaphragm activity
increases flow. Among the types of mechanical ventilation
breaths tested here, PS most mirrors spontaneous breathing
[20]. Spontaneous breaths are associated with a predominant
movement of the posterior diaphragm, which contains more
muscle fibers, whereas controlled mechanical breaths cause
diaphragm displacement mainly in the anterior diaphragm [21-
23]. Most of the lung is seated on this dorsal region of the dia-
phragm. It would be anticipated that diaphragm activity would
be greatest with PS (greatest patient interaction), least with
VC (least patient interaction with synchronous ventilation), and
intermediate with PC (in which patient diaphragm activity can
influence flow). This gradation of anticipated diaphragm activ-
ity is consistent with our results.
Figure 7
Distribution of area and vibration intensity between modesDistribution of area and vibration intensity between modes. Percentage changes in total areas (a) and percentage changes in total vibration intensity
(b) between assist volume control (VC), assist pressure control (PC), and pressure support (PS) are shown. Percentage change in total area dif-
fered significantly between VC and PC modes as well as between VC and PS. VC to PC and VC to PS showed a significant difference in percent-
age change in total vibration intensity between modes.
Table 3
Regional area distribution
Upper Middle Lower
Mean ± SD Mean ± SD Mean ± SD
VC 40.4% ± 6.9% 36.0% ± 3.5% 23.6% ± 9.5%
PC 39.7% ± 6.3% 34.6% ± 3.3% 25.7% ± 8.9%
PS 39.5% ± 5.8% 34.6% ± 3.2% 25.8% ± 8.4%
t test Upper ↓ Mid ↓ Lower ↑
VC-PC 0.170 0.00001
a
0.002
a
VC-PS 0.042
a
0.0008
a
0.004
a
PC-PS 0.367 0.8598 0.536
a
p < 0.05 indicates a significant difference in area distribution among VC and PS modes in all three regions. VC to PC mean regional area differs
in the mid and lower lung regions. Tables 3 and 4 and their corresponding descriptions should be interpreted side by side. PC, assist pressure
control; PS, pressure support; SD, standard deviation; VC, assist volume control; ↑ = increase; ↓ = decrease.
Critical Care Vol 11 No 1 Dellinger et al.
Page 10 of 13
(page number not for citation purposes)
The square/rectangular waveform in VC, which maintains a
fixed flow throughout the inspiration with higher flows at end-
inspiration compared to PC and PS, leads to a higher peak air-
way pressure. Previous studies have also shown that a decel-
erating waveform results in lower peak airway pressures and
higher mean airway pressures [9]. Peak airway pressure is
achieved at end-inspiration in VC and is constant in PC. The
lower peak airway pressure in PC reflects a lower inspiratory
flow rate at end-inspiration when elastance is highest (largest
lung volume). The initial loading of non-gas-conducting
airways with the decelerating flow waveform followed by
slower flow rates later in inspiration may lead to better distri-
bution of airflow to the lower lung regions.
Our results are supported by recent studies that demonstrate
that superimposed spontaneous breathing during airway
pressure release ventilation redistributes tidal ventilation
toward dependent lung regions just near the diaphragm [24].
This conclusion was derived using single photon emission
tomography in the pig model. In another pig model experiment,
it was demonstrated that spontaneous breathing reopens non-
aerated lung tissue in dorsal juxtadiaphragmatic regions [25].
Our data reveal similar results in ICU patients by means of a
different novel technique of imaging, featuring distribution of
vibration as a surrogate of flow. VRI offers information at the
bedside not previously available through other technologies
and provides the potential to study the intensity and distribu-
tion of vibration within the lungs in real time. It is possible that
VRI obtained in an individual patient could provide information
on whether a particular distribution of vibration signified better
overall ventilation or oxygenation in that patient.
Study limitations
Physiologic effects other than distribution of vibration were not
ascertained nor were outcome parameters obtained. The
recordings were carried out in rapid succession in order to
minimize variables such as changes in patient condition and
sensor placement. The inter-patient variations in vibration
intensities pose potential difficulties in analyzing data from dif-
ferent patients. To overcome this limitation for analysis of
geographic area differences and total vibration energy among
Figure 8
Redistribution of area and vibration intensityRedistribution of area and vibration intensity. Relative percentage changes in area (a) and relative percentage changes in vibration intensity (b) in dif-
ferent lung regions between assist volume control (VC), assist pressure control (PC), and pressure support (PS) are presented as mean percentage
changes ± standard error. Gray represents VC-PC, white represents VC-PS, and black represents PC-PS. The asterisks indicate p values of less
than 0.05, considered to be statistically significant. The relative percentage change in area in the middle and lower regions changed significantly
from VC to PC and PS modes (a). A difference in relative percentage change in vibration between VC and PS was observed in the lower lung
region.
Figure 9
The effect of tidal volume/airflow on vibration intensityThe effect of tidal volume/airflow on vibration intensity. There is a strong
correlation and linear relationship between tidal volume and lung vibra-
tion intensity.
Available online />Page 11 of 13
(page number not for citation purposes)
the three modes, each patient served as his/her own control
and relative percentage change was analyzed over the group.
The reason for this large difference is not yet characterized but
was not correlated with body mass index in our study patients
(r = 0.002, data not shown).
In this study, because not all ventilators used were capable of
all waveform selections, we did not compare VC with deceler-
ating inspiratory flow pattern to other modes. It would be use-
ful, however, to compare PC to VC with decelerating
waveform. Also, the fact that each recording is normalized to
itself may result in an area of the images of similar vibration
energy values to be gray for one patient and white for another.
Although using each patient as his/her own control aids in alle-
viating this concern, this approach does not completely elimi-
nate the potential confounding effect of normalization. The
analysis of vibration intensity shifts, however, is not influenced
by normalization and supports the findings of geographical
surface area, making normalization an unlikely confounding
factor. The MEF, which displays the peak inspiratory vibration,
was selected as the frame providing the most information on
the distribution of lung vibrations and on the overall lung con-
dition. However, whether this is the most important period to
analyze distribution of vibration remains to be determined.
Moreover, the use of a heterogeneous group of ventilated
patients with varied diagnoses may hide much greater effects
in a subset of similar patients or different effects among patient
subgroups, so our conclusions are of a general nature only.
Peak flow data were not collected in this study, which is a
potential confounder given that data were not constant across
the three modes. If inspiratory time is the same, to deliver the
same V
T
would require higher peak flows at the start of
inspiration in the pressure-targeted modes compared to VC.
This may partly explain the higher vibration intensity observed
in PC and PS. However, the fact that this change in flow pat-
tern led to greater vibration intensity in lower lung regions still
has clinical relevance. Multiple different ventilation types were
used in this study. This may have had some influence on flow
pattern and intensity. Ventilator specifications available make
integration of this type of information into analyses difficult.
However, common to all ventilators would be basic tenets of
differences and similarities in flow 'patterns' among these
three modes.
For technical reasons (need for vacuum sensors that must be
free of contact with other objects), the recordings were carried
out in the sitting position and would be expected to be differ-
ent in the supine or intermediate (30° to 45°) position due to
shift in fluid and gravity effect in blood flow. However, changes
in vibration energy distribution between different modes of MV
in the sitting position still have physiologic relevance and are
of interest and potential clinical importance.
Conclusion
In our study, pressure-targeted ventilation (PS more so than
PC) shows a shift of vibration toward the lower, dependent
lung regions compared to VC when V
T
is held constant. Syn-
chronization with the ventilator, greater downward movement
of the diaphragm, and decelerating flow waveform may be the
physiologic explanation for the redistribution of vibration
energy to lower lung regions in PS mode of MV. Further stud-
ies in the supine position are needed to correlate vibration
intensity and distribution with oxygenation, ventilation, and
clinical outcome.
Competing interests
JEP and RPD have consultant agreements that include hono-
raria and stock options (no current monetary value) with Deep
Breeze Ltd. Research personnel and materials for the VRI
research program at Cooper University Hospital (Camden, NJ,
USA) are funded partially by Deep Breeze Ltd. YAG is an
Table 4
Regional vibration intensity distribution
Upper Middle Lower
Mean ± SD Mean ± SD Mean ± SD
VC 48.7% ± 18.7% 40.5% ± 13.7% 10.8% ± 11.2%
PC 47.8% ± 19.4% 39.4% ± 13.7% 12.8% ± 15.4%
PS 48.5% ± 17.4% 39.5% ± 11.3% 12.1% ± 11.6%
t test Upper Mid Lower ↑
VC-PC 0.709 0.610 0.107
VC-PS 0.411 0.747 0.027
a
PC-PS 0.851 0.951 0.825
a
p < 0.05 indicates a significant difference in vibration intensity distribution between VC and PS modes in the lower region. Tables 3 and 4 and
their corresponding descriptions should be interpreted side by side. PC, assist pressure control; PS, pressure support; SD, standard deviation;
VC, assist volume control; ↑ = increase.
Critical Care Vol 11 No 1 Dellinger et al.
Page 12 of 13
(page number not for citation purposes)
employee of Deep Breeze Ltd. SJ, IC, CT, and SR declare that
they have no competing interests.
Authors' contributions
SJ, IC, CT, and SR carried out the VRI recordings. SJ, IC, CT,
SR, and YG worked on the calculations of recordings. RPD,
SJ, and IC drafted the manuscript. RPD and JEP participated
in the design and coordination of the study and helped to draft
the manuscript. All authors edited and approved the final
manuscript.
Additional files
Acknowledgements
We would like to thank Denise McGinly, Kathy Lofland, Lyn Ferchau,
Mary Jo Cimino, and all the respiratory therapists and ICU nursing staff
at Cooper University Hospital for their assistance. We would also like to
acknowledge Hina Trivedi, Barry Milcarek, and Bernadette Pacifico for
their input to the manuscript. This research was funded in part by Deep
Breeze Ltd.
References
1. Gluck E, Sarrigianidis A, Dellinger RP: Mechanical ventilation. In
Critical Care Medicine: Principles of Diagnosis and Management
in the Adult 2nd edition. Edited by: Parrillo JE, Dellinger RP. St.
Louis: Mosby; 2001:137-161.
2. Esteban A, Hanzueto A, Alia I, et al.: How is mechanical ventila-
tion employed in the intensive care unit? An international utili-
zation review. Am J Respir Crit Care Med 2000,
161:1450-1458.
3. Baker AB, Colliss JE, Cowie RW: Effect of varying inspiratory
flow waveform and time in intermittent positive pressure ven-
tilation. Various physiological variables. Br J Anaesth 1977,
49:1221-1234.
4. Campbell RS, Davis BR: Pressure-controlled versus volume-
controlled ventilation: does it matter? Respir Care 2002,
47:416-424.
5. Chiumello D, Pelosi P, Calvi E: Different modes of assisted ven-
tilation in patients with acute respiratory failure. Eur Respir J
2002, 20:925-933.
6. Kallet RH, Alonos JA, Morabito DJ: The effects of PC vs VC
assisted ventilation in acute lung injury and ARDS. Respir Care
2000, 45:1085-1096.
7. Mead J, Takishina T, Leith D: Stress distribution in lungs: a
model of pulmonary elasticity. J Appl Physiol 1970,
28:596-608.
8. Rappaport SH, Shipner R, Yoshihara G: Randomized, prospec-
tive trial of pressure-limited versus volume-controlled ventila-
tion in severe respiratory failure. Crit Care Med 1994,
22:22-32.
9. Davis K, Branson R, Campbell R, Porembka D: Comparison of
volume control and pressure control ventilation: is flow wave-
form the difference? J Trauma 1996, 41:808-814.
10. Bergstresser T, Ofengeim D, Vyshedskiy A, Shane J, Murphy R:
Sound transmission in the lung as a function of lung volume.
J Appl Physiol 2002, 93:667-674.
11. Kompis M, Pasterkamp H, Wodicka GR: Acoustic imaging of the
human chest. Chest 2001, 120:1309-1321.
12. Rasanen J, Gavriely N: Response of acoustic transmission to
positive airway pressure therapy in experimental lung injury.
Intensive Care Med
2005, 31:1434-1441.
13. Jean S, Dellinger RP, Cinel I, Rajanala S, Kushnir I, Parrillo JE:
Increased spatial distribution of airflow in lungs with low-level
pressure support ventilation compared to maintenance venti-
lation [abstract]. Crit Care 2006, 10(suppl 1):s14.
14. Jean S, Rajanala S, Cinel I, Wang Z, Ferchau L, Lofland K, Dellinger
RP, Parrillo JE: Distribution of vibration energy among different
modes of mechanical ventilation [abstract]. Chest 2006,
130:s211.
15. ImageJ: image processing and analysis in Java [http://
rsb.info.nih.gov/ij]
16. Prella M, Feihl F, Domenighetti G: Effects of short-term pres-
sure-controlled ventilation on gas exchange, airway pres-
sures, and gas distribution in patients with acute lung injury/
Key messages
• With V
T
held constant, PC and PS modes of MV, com-
pared to VC, produce an increase in maximal inspiratory
vibration energy in the lower lung regions.
• Better patient synchronization with the ventilator,
greater downward movement of the diaphragm, and
decelerating flow waveform are potential physiologic
explanations for the redistribution of vibration energy to
lower lung regions in pressure-targeted modes of MV.
• VRI is a novel non-invasive bedside technology that dis-
plays both a real-time structural and functional video of
airflow-induced vibrations as well as total and regional
graphs of vibration energy.
The following Additional files are available online:
Additional file 1
An example of a VRI video recording of a healthy, 30-
year-old, male non-smoker. L, left lung; R, right lung.
See />supplementary/cc5706-S1.avi
Additional file 2
A VRI video recording of a mechanically ventilated female
on assist volume control mode. Chest radiography
reported pleural fluid in both lungs. L, left lung; R, right
lung.
See />supplementary/cc5706-S2.mpeg
Additional file 3
A VRI video recording of a mechanically ventilated female
on assist pressure control mode. Chest radiography
reported pleural fluid in both lungs. L, left lung; R, right
lung.
See />supplementary/cc5706-S3.mpeg
Additional file 4
A VRI video recording of a mechanically ventilated female
on pressure support mode. Chest radiography reported
pleural fluid in both lungs. L, left lung; R, right lung.
See />supplementary/cc5706-S4.mpeg
Available online />Page 13 of 13
(page number not for citation purposes)
ARDS. Comparison with volume-controlled ventilation. Chest
2002, 122:1382-1388.
17. Tobin MJ, Jubran A, Laghi F: Patient-ventilator interaction. Am J
Respir Crit Care Med 2001, 163:1059-1063.
18. Hess DR, Thompson BT: Patient-ventilator dyssynchrony dur-
ing lung protective ventilation: what's a clinician to do? Crit
Care Med 2006, 34:231-233.
19. Putensen C, Hering R, Wrigge H: Controlled versus assisted
mechanical ventilation. Curr Opin Crit Care 2002, 8:51-57.
20. Putensen C, Muders T, Varelmann D, Wrigge H: The impact of
spontaneous breathing during mechanical ventilation. Curr
Opin Crit Care 2006, 12:13-18.
21. Kleinman BS, Frey K, van Drunen M: Motion of the diaphragm in
patients with chronic obstructive pulmonary disease while
spontaneously breathing versus during positive pressure
breathing after anesthesia and neuromuscular blockade.
Anesthesiology 2002, 97:298-305.
22. Jousela I, Tahvanainen J, Nikki P: Diaphragmatic movement
using ultrasound during spontaneous breathing and mechan-
ical ventilation: effect of tidal volume. Acta Anaesthesiol Belg
1992, 43:165-171.
23. Reber A, Nylund U, Hedenstierna G: Position and shape of the
diaphragm: implications for atelectasis formation. Anaesthesia
1998, 53:1054-1061.
24. Neumann P, Wrigge H, Zinserling J, Hinz J, Maripuu E, Andersson
LG, Putensen C, Hadenstierna G: Spontaneous breathing
affects the spatial ventilation and perfusion distribution during
mechanical ventilatory support. Crit Care Med 2005,
33:1090-1095.
25. Wrigge H, Zinserling J, Neuman P: Spontaneous breathing
improves lung aeration in oleic acid-induced lung injury.
Anesthesiology 2003, 99:376-384.