Báo cáo khoa học: " Pulse pressure variation: beyond the fluid management of patients with shock" pot
Bạn đang xem bản rút gọn của tài liệu. Xem và tải ngay bản đầy đủ của tài liệu tại đây (74.69 KB, 3 trang )
Page 1 of 3
(page number not for citation purposes)
Available online />Abstract
In anesthetized patients without cardiac arrhythmia the arterial
pulse pressure variation (PPV) induced by mechanical ventilation
has been shown the most accurate predictor of fluid responsive-
ness. In this respect, PPV has so far been used mainly in the
decision-making process regarding volume expansion in patients
with shock. As an indicator of the position on the Frank–Starling
curve, PPV may actually be useful in many other clinical situations.
In patients with acute lung injury or with acute respiratory distress
syndrome, PPV can predict hemodynamic instability induced by
positive end-expiratory pressure and recruitment maneuvers. PPV
may also be useful to prevent excessive fluid restriction/depletion
in patients with pulmonary edema, and to prevent excessive
ultrafiltration in critically ill patients undergoing hemodialysis or
hemofiltration. In the operating room, a goal-directed fluid therapy
based on PPV monitoring has the potential to improve the outcome
of patients undergoing high-risk surgery.
In the previous issue of Critical Care, Keyl and colleagues [1]
have investigated the effects of cardiac resynchronization
therapy on arterial pulse pressure variation (PPV). Many
studies [2] have shown that PPV is much more accurate than
cardiac filling pressures and volumetric markers of preload to
predict fluid responsiveness (that is, the hemodynamic
effects of volume loading). PPV is also more reliable than
other dynamic parameters such as systolic pressure variation
[3,4] or pulse contour stroke volume variation [4]. In this
respect, PPV is used increasingly in the decision-making
process regarding volume expansion in patients with hemo-
dynamic instability [2]. Limitations to the use of PPV do exist
(mainly active breathing, cardiac arrhythmia, and low tidal
volume) and have been described in detail elsewhere [2,5].
It is very important to point out that PPV is not an indicator of
volume status, nor a marker of cardiac preload, but is an
indicator of the position on the Frank–Starling curve [2].
Briefly, patients operating on the flat portion of the
Frank–Starling curve are insensitive to cyclic changes in
preload induced by mechanical inspiration, such that PPV is
low (Figure 1). Conversely, PPV is high in patients operating
on the steep portion of the preload/stroke volume relationship
(and hence sensitive to cyclic changes in preload induced by
mechanical inspiration) (Figure 1). This information has so far
been used mainly to predict fluid responsiveness in patients
with shock, but actually could be useful in many other clinical
situations.
PPV and fluid depletion/restriction
As an indicator of the position on the Frank–Starling curve,
PPV is as useful to predict the deleterious hemodynamic
effects of fluid depletion as it is to predict the beneficial
effects of fluid loading [6]. In critically ill patients undergoing
hemodialysis or hemofiltration the volume of ultrafiltration is
often determined roughly on the basis of body weight gain or
fluid balance, and is further adjusted in case of hemodynamic
instability. In patients with acute respiratory distress
syndrome, a therapeutic strategy based on fluid restriction/
depletion has been shown to shorten the duration of
mechanical ventilation and intensive care [7]. In such clinical
situations, fluid management could be refined by PPV
monitoring: a large PPV or an increase in PPV indicates that
the patient is operating on the steep portion of the Frank–
Starling curve, and hence indicates that further ultrafiltration
or further fluid restriction/depletion will induce hemodynamic
instability.
PPV and respiratory settings
The first description of PPV [8] was a study showing that the
parameter can be used to predict the deleterious hemo-
dynamic effects of positive end-expiratory pressure. We must
Commentary
Pulse pressure variation: beyond the fluid management of
patients with shock
Frédéric Michard
1
, Marcel R Lopes
2
and Jose-Otavio C Auler Jr
3
1
Department of Anesthesia and Critical Care, Béclère Hospital – University Paris XI, France
2
Department of Anesthesia and Critical Care, Santa Casa Misericordia de Passos, Passos, MG, Brazil
3
Department of Anesthesia and Critical Care, INCOR – University of São Paulo, São Paulo, SP, Brazil
Corresponding author: Frédéric Michard,
Published: 17 May 2007 Critical Care 2007, 11:131 (doi:10.1186/cc5905)
This article is online at />© 2007 BioMed Central Ltd
See related research by Keyl et al., />PPV = pulse pressure variation.
Page 2 of 3
(page number not for citation purposes)
Critical Care Vol 11 No 3 Michard et al.
keep in mind that most patients with acute respiratory
distress syndrome still die of multiple organ failure and not of
hypoxemia. In this regard, PPV is now used (and normalized
by the use of fluid) routinely by renowned groups [9] before
performing recruitment maneuvers or before applying positive
end-expiratory pressure in patients with acute respiratory
distress syndrome, in order to prevent any hemodynamic
deterioration. Conversely, PPV can also be used to predict
the beneficial hemodynamic effects of positive end-expiratory
pressure removal. In patients with chronic obstructive
pulmonary disease and high auto-positive end-expiratory
pressure, Lee and colleagues [10] have shown that PPV is
closely related to the hemodynamic improvement observed in
response to Heliox administration.
PPV and perioperative fluid optimization
Another potential field of application for PPV is the intra-
operative fluid optimization of patients undergoing high-risk
surgery. Several studies [11-13] have shown that monitoring
and maximizing stroke volume by fluid loading (until the stroke
volume reaches a plateau, actually the plateau of the Frank–
Starling curve) during high-risk surgery is associated with
improved postoperative outcome. The benefit in using such a
peroperative fluid strategy was first established in patients
undergoing cardiac surgery or hip surgery, and has been
extended more recently to patients undergoing major bowel
surgery or general surgery [11-13. This strategy has so far
required the measurement of the stroke volume by a cardiac
output monitor. By increasing cardiac preload, volume
loading induces a rightward shift on the preload/stroke
volume relationship and hence a decrease in PPV (Figure 1).
Patients who have reached the plateau of the Frank–Starling
relationship can be identified as patients in whom PPV is low.
The clinical and intraoperative goal of ‘maximizing stroke
volume by volume loading’ can therefore be achieved simply
by minimizing PPV. A large multicenter trial is currently
ongoing to investigate whether minimizing PPV by volume
loading may improve the postoperative outcome of patients
undergoing high-risk surgery.
PPV as a tool to track changes in contractility?
In the previous issue of Critical Care, Keyl and colleagues [1]
reported a slight but significant increase in PPV (from 5.3%
to 6.9%) during resynchronization therapy. Although the
noninvasive method used by the authors to monitor blood
pressure lacks validation, their finding makes sense since
increasing left ventricular contractility means increasing the
slope of the Frank–Starling curve, and hence increasing PPV
(Figure 1). This result also suggests that PPV may be used to
track changes in contractility in situations where changes in
preload are unlikely. Keyl and colleagues did not, however,
assess left ventricular contractility (for example, by measuring
the maximum left ventricular pressure derivative, dP/dt
max
).
Moreover, biventricular pacing may induce a decrease in left
ventricular volumes [14], which may also explain the increase
in PPV. The relationship between changes in PPV and
changes in contractility during cardiac resynchronization
therefore remains to be proven.
Competing interests
The authors declare that they have no competing interest.
References
1. Keyl C, Stockinger J, Laule S, Staier K, Schiebeling-Romer J,
Wiesenack C: Changes in pulse pressure variability during
cardiac resynchronization therapy in mechanically ventilated
patients. Crit Care 2007, 11:R46.
2. Michard F: Changes in arterial pressure during mechanical
ventilation. Anesthesiology 2005, 103:419–428.
3. Michard F, Boussat S, Chemla D, Anguel N, Mercat A, Lecarpen-
tier Y, Richard C, Pinsky MR, Teboul JL: Relation between respi-
ratory changes in arterial pulse pressure and fluid
responsiveness in septic patients with acute circulatory
failure. Am J Respir Crit Care Med 2000, 162:134-138.
4. Preisman S, Kogan S, Berkenstadt H, Perel A: Predicting fluid
responsiveness in patients undergoing cardiac surgery: func-
tional haemodynamic parameters including the Respiratory
Systolic Variation Test and static preload indicators. Br J
Anaesth 2005, 95:746-755.
5. Michard F: Volume management using dynamic parameters.
The good, the bad, and the ugly. Chest 2005, 128:1902-1904.
6. Ornstein E, Eidelman LA, Drenger B, Elami A, Pizov R: Systolic
pressure variation predicts the response to acute blood loss.
J Clin Anesth 1998, 10:137-140.
7. National Heart, Lung, and Blood Institute Acute Respiratory Dis-
tress Syndrome (ARDS) Clinical Trials Network: Comparison of
two fluid-management strategies in acute lung injury. N Engl J
Med 2006, 354:2564-2575.
8. Michard F, Chemla D, Richard C, Wysocki M, Pinsky MR, Lecar-
pentier Y, Teboul JL: Clinical use of respiratory changes in arte-
rial pulse pressure to monitor the hemodynamic effects of
PEEP. Am J Respir Crit Care Med 1999, 159:935-939.
9. Borges JB, Okamoto VN, Matos GF, Caramez MP, Arantes PR,
Barros F, Souza CE, Victorino JA, Kacmarek RM, Barbas CS, et
al.: Reversibility of lung collapse and hypoxemia in early acute
respiratory distress syndrome. Am J Respir Crit Care Med
2006, 174:268-278.
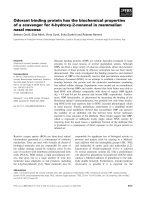
Figure 1
Determinants of pulse pressure variation. Pulse pressure variation
(PPV) is a marker of the position on the Frank–Starling curve, not an
indicator of blood volume or a marker of cardiac preload. Increasing
preload induces a decrease in PPV (from ➋ to ➌). PPV is mimimal
when the heart is operating on the plateau of the Frank–Starling curve
(➌ and ➍). Decreasing preload induces an increase in PPV (from ➋ to
➊), also increasing contractility (from ➍ to ➋).
Page 3 of 3
(page number not for citation purposes)
10. Lee DL, Lee H, Chang H-W, Chang AYW, Lin S-L, Huang Y-CT:
Heliox improves hemodynamics in mechanically ventilated
patients with chronic obstructive pulmonary disease with
pulse pressure variations. Crit Care Med 2005, 33:968-973.
11. Mythen MG, Webb AR: Perioperative plasma volume expan-
sion reduces the incidence of gut mucosal hypoperfusion
during cardiac surgery. Arch Surg 1995, 130:423-429.
12. Sinclair S, James S, Singer M: Intraoperative intravascular
volume optimisation and length of hospital stay after repair of
proximal femoral fracture: a randomised controlled trial. BMJ
1997, 315:909-912.
13. Gan TJ, Soppitt A, Maroof M, El-Moalem H, Robertson KM,
Moretti E, Dwane P, Glass PSA: Goal-directed intraoperative
fluid administration reduces length of hospital stay after
major surgery. Anesthesiology 2002, 97:820-826.
14. Yu CM, Lin H, Fung WH, Zhang Q, Kong SL, Sanderson JE:
Comparison of acute changes in left ventricular volume, sys-
tolic and diastolic functions, and intraventricular synchronicity
after biventricular and right ventricular pacing for heart failure.
Am Heart J 2003, 145:E18.
Available online />