Báo cáo khoa học: "Visualizing multiple organ failure: a method for analyzing temporal and dynamic relations between failing systems and interventions" pptx
Bạn đang xem bản rút gọn của tài liệu. Xem và tải ngay bản đầy đủ của tài liệu tại đây (469.84 KB, 2 trang )
Page 1 of 2
(page number not for citation purposes)
Available online />Multiple organ failure is common among critically ill patients
who have a prolonged stay in the intensive care unit or die.
Apart from causing significant morbidity and mortality, the
treatment for multiple organ failure requires use of limited and
costly resources. Although the epidemiology and progression
of multiple organ failure are well described, it is not possible
to conduct detailed and reliable analyses of the temporal
relations between failing organs and the effects of inter-
ventions (for instance, institution of antibiotic therapy or
surgery). In addition, progression of multiple organ failure may
differ between patient populations [1]. We describe a
method that allows evaluation of the temporal and dynamic
nature of multiple organ failure.
We developed this approach by using multiple organ failure
scores (Multiple Organ Dysfunction Score [MODS], Logistic
Organ Dysfunction Score [LODS] and Sequential Organ
Failure Assessment [SOFA]) stored in our critical care data-
base [2-5]. Using these scores, we have constructed a surface
topogram of organ failure for the entire stay in the intensive
care unit, using the open source data visualization software
OpenDX Visualization Data Explorer (version 4.4.4) [6].
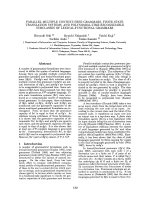
The software outputs a graphic in which each organ system
is represented by a row, and the various degrees of organ
failure are represented by different colours ranging (in order
of severity) from blue, green and yellow to red (Figure 1). This
allows clear and rapid visual identification of changes in
organ systems, temporal relations within and between failing
organs, and effects of interventions. In most patients in whom
disease severity is low, the software outputs a graphic that
resembles a smooth sea surface (all blue). In patients with
severe disease the graphic resembles a ‘stormy sea’, which
ends with a ‘tsunami’. In the given example, exacerbation of
organ failure by surgical intervention and relief with abdominal
decompression can clearly be identified. Also, worsening and
correction of renal function follows parallel changes in
cardiac function.
This approach can also be used to conduct quality
assessment studies, to evaluate intensive care unit perfor-
mance and patient safety, and to communicate complicated
relations between data arrays. The method is also useful for
visualizing concordance and calibration between different
organ failure systems (Figure 2). In the second example,
compared with MODS and SOFA systems, the LODS
system appears to underestimate cardiovascular failure.
In conclusion, we believe that this method will be useful in
analyzing temporal and dynamic relations within and between
Letter
Visualizing multiple organ failure: a method for analyzing
temporal and dynamic relations between failing systems and
interventions
Yusuf Alper Kiliç, Kaya Yorganci and Iskender Sayek
Hacettepe University School of Medicine, Department of General Surgery, Ankara, Turkey
Corresponding author: Yusuf Alper Kiliç,
Published: 6 July 2007 Critical Care 2007, 11:417 (doi:10.1186/cc5941)
This article is online at />© 2007 BioMed Central Ltd
.
Figure 1
Graphical representation of SOFA scores. Shown is a graphical
representation of the evolution over time in Sequential Organ Failure
Assessment (SOFA) scores: a ‘stormy’ intensive care unit course
ending with a ‘tsunami’.
Page 2 of 2
(page number not for citation purposes)
Critical Care Vol 11 No 4 Kiliç et al.
failing organ systems and related interventions. We also
suggest that this approach could be used as a basis for
constructing statistical methods to analyze these relations
quantitatively.
Competing interests
YAK is the author and director of the Muavenet Intensive
Care Information System, which is an open access, online
academic information system. The other authors declare that
they have no competing interests.
References
1. Kilic YA, Dogrul AB, Karakoc D, Yildiz B, Yorganci K, Sayek I:
Impact of organ failure on mortality prediction in a Turkish
surgical intensive care unit. Intensive Care Med 2005, Suppl 1:
S47
2. Marshall JC, Cook DJ, Christou NV, Bernard GR, Sprung CL,
Sibbald WJ: Multiple organ dysfunction score: a reliable
descriptor of a complex clinical outcome. Crit Care Med 1995,
23:1638-1652.
3. Vincent JL, Moreno R, Takala J, Willatts S, De Mendonca A, Bruin-
ing H, Reinhart CK, Suter PM, Thijs LG: The SOFA (Sepsis-
related Organ Failure Assessment) score to describe organ
dysfunction/failure. On behalf of the Working Group on
Sepsis-Related Problems of the European Society of Inten-
sive Care Medicine. Intensive Care Med 1996, 22:707-710.
4. Le Gall JR, Klar J, Lemeshow S, Saulnier F, Alberti C, Artigas A,
Teres D: The Logistic Organ Dysfunction System. A new way
to assess organ dysfunction in the intensive care unit. JAMA
1996, 276:802-810
5. Muavenet Intensive Care Information System [.
hacettepe.edu.tr/micis.html]
6. OpenDX []
Figure 2
Graphical representation of the performance of LOD, SOFA and
MODS: cardiovascular system. Shown are data of another patient,
illustrating differences between organ failure scores in assessing the
cardiovascular system. LODS, Logistic Organ Dysfunction Score;
MODS, Multiple Organ Dysfunction Score; SOFA, Sequential Organ
Failure Assessment.