Nonimaging Optics Winston Episode 12 pptx
Bạn đang xem bản rút gọn của tài liệu. Xem và tải ngay bản đầy đủ của tài liệu tại đây (1.37 MB, 30 trang )
case of the CPC), at least a small gap must be provided. Moreover, these thermal
aspects are responsible for the difference between thermal and photovoltaics with
respect to the use of optically dense transparent media (n > 1) surrounding the
receiver. This is difficult to apply for thermal concentrators, and if excluded, the
concentration limit is reduced by a factor n
2
for solar thermal systems (which is
n
2
= 1.5
2
= 2.25 for typical materials).
Another aspect to consider is the electric nature of the photovoltaic cell. The
necessity of extracting the photogenerated current and of interconnecting the dif-
ferent cells must be considered at the optical design stage. Also, the use of metal-
lic mirrors in contact with the cell should be avoided to prevent short circuits.
Obviously, these problems do not matter for solar thermal systems.
Also, the spectral sensitivity of the receivers is different in both fields.
For example, the quantum efficiency of the silicon solar cells is very low over
1,200nm. This means that the further infrared radiation of the sun, which usually
is nearly 25% of the sun power, is not useful, contrary to the solar thermal case.
These spectral differences may make it so that a good optical material for photo-
voltaics may be unsuitable for solar thermal applications due to its poor infrared
response.
Finally, the last aspect to be considered here is the receiver geometry. This
geometry affects the design importantly, as we have seen in Chapter 5. In the case
of medium to high concentration in photovotaics, the active surface of the solar
cell is always flat, typically with a round or squared contour of the active area.
Sometimes the cells tessellate to build a strip receiver. The inactive face of the
cell is used to evacuate the heat by fixing a heat-sink to this face. Only low-
concentration systems (typically C < 5) can use bifacial solar cells—that is, cells
that can collect the sunlight on their two faces. The bifacial geometry must be obvi-
ously considered in the concentrator design.
On the contrary, in solar thermal concentration there is a wider variety of
receiver geometries. Flat (monofacial and bifacial) and tubular are the most
common ones. In the case of a tubular receiver, the conventional cross section is
circular. However, the contour can also been considered a surface to design, which
constitutes an additional degree of freedom. As an example, for the specific case
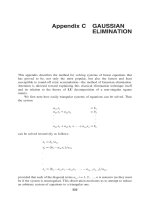
of the parabolic through, Ries and Spirkl (1995) proved that designing the contour
using the caustic of the edge rays allows to noticeably increase the concentration
ratio, as shown in Figure 13.1. With 100% ray collection efficiency within the accep-
tance angle ±a, the geometrical concentration is limited to C
MAX
= 1/sina. For a
parabola with rim angle of ±90° and also for 100% collection efficiency, the circu-
lar receiver only achieves C/C
MAX
= 1/p = 0.32, while the optimum receiver provides
C/C
MAX
= 0.47.
13.2.2 Irradiance Uniformity on the Receiver
The irradiance distribution on the receiver produced by most concentrators is not
uniform. The effect of this nonuniformity has not been critical in solar thermal
systems, although it has some relevance in the development of Direct Steam
Generation (DSG) systems (Goebel et al., 1996/1997). However, the nonuniform
illumination of a photovoltaic cell may produce a dramatic decrease of its solar-to-
electric power conversion efficiency. This is due to the Joule effect power losses in
the cell series resistance R
S
(if the series resistance were null, the efficiency will
13.2 Solar Thermal Versus Photovoltaic Concentrator Specifications 319
always increase with concentration). The losses in the series resistance degrade the
cell fill-factor FF, which is one parameter that is related with the cell efficiency by
the formula
(13.1)
where P
L
is the solar power, V
OC
is the open-circuit voltage, I
SC
is the short-circuit
current, and FF is the fill factor. The nonuniform illumination mainly affects the
cell fill factor. As an example, Figure 13.2 shows the PSIPICE simulation with a
discretized cell of the effect of illumination nonuniformity on the performance of
a 1mm ¥ 1mm Gallium Arsenide (GaAs) solar cell (Álvarez, 2001). This cell was
designed for optimum performance at a uniform irradiance of 1,000 suns (1 sun =
1kW/m
2
). The simulation considers an average irradiance along the total cell area
of 1,000kW/m
2
and a pillbox irradiance pattern with higher peak irradiance on a
squared area at the cell center and null irradiance outside said area. When the
cell is illuminated with a peak irradiance of 5 times the average, the cell conver-
sion efficiency reduces approximately as the fill factor does, and then the simula-
tion indicates that the efficiency decreases a 100(1 - 0.77/0.85) = 9.4%.
Both concentrator and cell designers should be concerned about this problem
at the design stage and try to minimize its negative effects. The variation of the
irradiance pattern with the mispointing angular error must also be considered.
Therefore, two issues must be addressed:
h =
VIFF
P
OC SC
L
320 Chapter 13 Applications to Solar Energy Concentration
Straight
lines
Caustic of
+a rays
+a
+a rays
Parabolic
mirror
Receiver
Figure 13.1 The concentration of a solar thermal parabolic trough (on the left) can be max-
imized by designing the contour of the receiver (on the right). The conventional circular
receiver providing the same acceptance angle (for 100% ray collection) is shown for com-
parison purposes.
0
5
10
15
20
25
0.0 0.2 0.5 0.7 1.0 1.2
Voltage (V)
Current (mA)
C
LOCAL
= 20,000 (FF = 0.59)
Uniform (FF = 0.85)
C
LOCAL
= 10,000 (FF = 0.70)
C
LOCAL
= 5,000 (FF = 0.77)
Figure 13.2 Simulation of the current-voltage characteristic of a GaAs solar cell under an
average irradiance of 1,000 suns (1 sun = 1kW/m
2
) and different pillbox local concentration
at the cell. FF denotes the cell fill factor.
1. How a given nonuniform irradiance distribution affects the cell efficiency. Note
that analytical models rather than numerical simulations verb (as that in
Figure 13.2) because the formers give much more information to the design-
ers about where and how much the light can be concentrated.
2. How to design concentrators producing the desired irradiance patterns, inde-
pendently of the sun position within the concentrator acceptance angle.
Discussing issue 1, the effect of the nonuniform illumination depends on both the
physical parameters of the solar cell and on the irradiance distribution. No general
analytical model to quantify this effect is available yet. As an illustrative example,
in the case in which the front metal grid contribution to the series resistance R
S
is negligible, the cell voltage near the maximum power point can be estimated with
the following approximate formula (Benítez and Miñano, 2003):
(13.2)
where V
0
is the cell voltage when the series resistance is null, kT/e is the thermal
voltage (about 29mV at usual cell operating temperatures), f(C) is the probability
density function of the irradiance C, and I
sc,1sun
is the cell short circuit current
under 1 sun irradiance. The parameter C
0
coincides approximately with the con-
centration level at which the cell efficiency is maximum. The integrand in Eq.
(13.2) indicates the relative importance of the different concentration intervals
(C, C + dC) on the cell performance degradation, pointing out that the dependence
on irradiance is strongly nonlinear due to the exponential function. Consequently,
even if a small fraction of power is highly concentrated, it can produce the cell
degradation dominating the integral in Eq. (13.2).
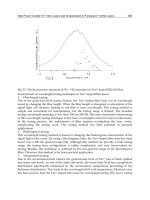
A general and simple rule of thumb that is generally used says that an irra-
diance distribution with a peak concentration doubling the average usually pro-
duces an affordable decrease of conversion efficiency. This rule is only inaccurate
when the average irradiance is several times higher than the paramenter C
0
. For
instance, following with the example of the cells fulfilling Eq. (13.2), let us con-
sider the two extreme irradiance distributions: (1) the pill-box type distribution
(half the cell is not illuminated and the other half is illuminated with double the
average irrradiance), which has maximum standard deviation; and (2) the distri-
bution with a very small area with the peak distribution, and the rest of the area
is illuminated slightly below the average, which is the minimum (null, at the limit)
standard deviation case. According to Eq. (13.2), the voltage difference near the
maximum power point between cases (1) and (2) is
(13.3)
For a high concentration GaAs cell, the 10% relative difference between the effi-
ciencies of cases (1) and (2), approximately coincides with V(2) - V(1) = 100mV.
This implies <C> ª 4C
0
. Since presently high concentration GaAs cells have C
0
ª
500 suns, this limits the 10% guaranteed accuracy of the rule to <C> ª 2,000 suns.
It can be proved (Benítez and Miñano, 2003) that, for a given average con-
centration, the irradiance distribution maximizing Eq. (13.2) is uniform. However,
when the grid series resistance is not negligible, it is clear that the irradiance
pattern that produces the maximum conversion efficiency on conventional
VV
kT
e
C
C
21
1
2
1
0
(
)
-
(
)
ª+
<>
Ê
Ë
ˆ
¯
Ê
Ë
ˆ
¯
Ê
Ë
ˆ
¯
ln exp
VV
kT
e
fC
C
C
dC C
kT e
RI
S sc sun
ª-
(
)
Ê
Ë
ˆ
¯
Ê
Ë
Á
ˆ
¯
˜
=
•
Ú
0
0
0
0
1
ln exp
,
13.2 Solar Thermal Versus Photovoltaic Concentrator Specifications 321
concentrator cells is nonuniform (Benítez and Mohedano, 1999). The maximum
efficiency of this optimum irradiance pattern is close to that obtained for the
uniform illumination in practice. Therefore, the efficiency increase is not the main
interest of this optimal nonuniform irradiance distribution but the fact that it
guides the concentrator designers to where and how much can they concentrate
the sun light.
In order to address now issue (2), let us consider the uniform illumination dis-
tribution as the goal. If only the uniformity is required for a given concentration
factor, the solution to this design problem is well known and was described in
Chapter 7. However, in the photovoltaic application, especially due to the nonlin-
ear effects when series connected cell are illuminated differently (see Section
13.2.3), the concentrator is desired to have an acceptance angle a substantially
greater than the sun angular radius a
S
(typically, a ª±1°, while a
S
ª±0.26°). The
uniformity is then required for the sun placed anywhere inside the acceptance
angle, which is a more complex design problem (the solutions in Chapter 7 coin-
cide with case in which a = a
S
), especially because in high-concentration systems
(<C> >1,000), the value a ª±1° approaches the thermodynamic limit (and thus the
maximum illumination angle of the cell, b, comes closer to ±90°, typically b ª
±60°–75°).
There are two methods in classical optics that potentially can achieve this
insensitivity to the source position. The two methods, used for instance in con-
denser designs in projection optics, are the light-pipe homogenizer and the Kohler
illuminator (commonly called integrator) (Cassarly, 2001).
The light pipe homogenizer uses the kaleidoscopic effect created in the multi-
ple reflections inside a light pipe, which can be hollow with metallic reflection or
solid with total internal reflections (TIR). This strategy have been proposed several
times in photovoltaics (Fevermann and Gordon, 2001; Jenkins, 2001; O’Gallagher
and Winston, 2001; Ries, Gordon, and Laxen, 1997), essentially attaching the cell
to the light pipe exit and placing the light pipe entry as the received of a conven-
tional concentrator. It can potentially achieve (with the proper design of the pipe
walls and length) good illumination on a squared light pipe exit with the sun in
any position within the acceptance angle. For achieving high-illumination angles
b, the design can include a final concentration stage by reducing the light pipe
cross section near the exit. However, this approach has not been proven yet to lead
to practical photovoltaic systems (and no company has commercialized it as a
product yet).
On the other hand, the integrating concentrator consists of two imaging
optical elements (primary and secondary) with positive focal length (that is,
producing a real image of an object at infinity, as a magnifying glass does). The
secondary is placed at the focal plane of the primary and the secondary images
the primary on the cell. This configuration makes it that the primary images of
the sun on the secondary aperture, and thus the secondary contour, defines the
acceptance angle of the concentrator. As the primary is uniformly illuminated by
the sun, the irradiance distribution is also uniform, and the illuminated area will
have the contour of the primary and will remain unchanged when the sun moves
within the acceptance angle (equivalently when the sun image moves within the
secondary aperture). If the primary is tailored in square shape, the cells will be
uniformly illuminated in a squared area. The squared aperture is usually the
preferred contour to tessellate the plane when making the modules, while the
322 Chapter 13 Applications to Solar Energy Concentration
squared illuminated area on the cell is also usually preferred because it fits the
cell’s shape.
Integrator optics in PV was first proposed (James, 1989) by Sandia Labs in
the late 1980s, and it was commercialized later by Alpha Solarco. Now, high-
concentration SMS concentrators (see Section 13.4.3) are including this strategy
for achieving good uniformity and improving tolerances.
Sandia Labs’ approach used a Fresnel lens as primary and a single-surface
imaging lens (called SILO, from SIngLe Optical surface) that encapsulates the cell
as secondary, as illustrated in Figure 13.3.
This simple configuration is excellent for getting sufficient acceptance angle a
and highly uniform illumination, but it is limited to low concentrations because it
cannot get high angles b. Imaging secondaries achieving high b (high numerical
aperture, in the imaging nomenclature) are, to the present, impractical. Classical
solutions, which would be similar to high-power microscopes objectives, need many
lenses and would achieve b ª 60°. Another simpler solution that nearly achieves
b = 90° is the RX concentrator (Benítez and Miñano, 1997; Miñano, Benítez, and
Gonzalez, 1995) (see Figure 13.4). Although the Lens+RX integrator is still not
practical, it is theoretically interesting because shows that the optimum photo-
voltaic concentrator performance (squared aperture concentrator, acceptance angle
a several times larger than the sun radius a
S
, isotropic illumination of the cell (b
= 90°), squared uniform cell irradiance independently of the sun position within
the acceptance) is nearly attainable.
As an example, for a = 1°, this optimum performance concentrator will get a
geometrical concentration C
g
= 7,387¥, which is the thermodynamic concentration
limit for that acceptance angle. Note that since all rays reaching the cell come from
the rays within the cone of angular radius a, no rays outside this cone are col-
lected by the optimum concentrator.
Of course, in practice, the optimum photovoltaic concentrator performance
might be not desired. For instance, as already mentioned, the high reflectivity of
nontextured cells for glazing angles may make the isotropical illumination useless.
As another example, illuminating a squared area inside the cell is perfect for back-
contacted solar cells (such as SunPower’s or Ammnix’ cells), but it may be not so
perfect for front-contacted cells, for which an inactive area is needed to make the
13.2 Solar Thermal Versus Photovoltaic Concentrator Specifications 323
CellCell
(a)
(b)
Figure 13.3 The “Sandia concept 90” proved that the cell could be nearly uniformly illu-
minated on a square (with a squared Fresnel lens) for any position of the sun in the accep-
tance angle. (a) Normal incidence. (b) Incidence near the acceptance angle.
front contacts (breaking the squared shape active area restriction). Finally, for
medium concentration systems (let’s say, C
g
= 100) the aforementioned optimum
performance would imply an ultrawide acceptance angle a = 8.6°. It seems logical
that over a certain acceptance angle, there must be no cost benefits due to the
relaxation of accuracies (and 8.6° seems to be over such a threshold). If this is the
case, coming close to the optimum performance seems to be unnecessary for this
medium concentration level.
The present challenge in the optical design for high-concentration photovoltaic
systems is concentrators that approach optimum performance and at the same
time are efficient and suitable for low-cost mass production.
13.2.3 Dispersion of the Optical Efficiency
Corresponding to Different Receivers
In solar thermal concentrating systems—for instance, in parabolic trough
technology—the optical efficiency along the receiving tube does not need to be
uniform because the system performance depends on the cumulative solar power
cast along the receiver.
However, in general this is not the case in photovoltaic concentration systems.
The level of degradation of performance due to the dispersion of the solar power
cast by the different solar cells depends on the electrical interconnection configu-
ration. The extreme cases are the all-parallel connected cells, whose performance
degradation is unimportant, and the all-series connected cells, whose performance
is much worse when nonequally illuminated.
Consider a set of N solar cells illuminated by nonperfect concentrators that
produce dispersion of the solar power cast by each individual cell of the set. Assume
that the cells are identical (thus, when illuminated equally and independently, all
the individual cells present the same fill-factor FF, short-circuit current I
SC
, and
open-circuit voltage V
OC
). Since I
SC
is proportional to the power cast by the cell
324 Chapter 13 Applications to Solar Energy Concentration
lens
Solar
cell
RX concentrator
mirror
lens
RX concentrator
Solar cell
lens
Solar
cell
RX concentrator
mirror
lens
RX concentrator
Solar cell
Figure 13.4 The use of an RX concentrator as the imaging secondary in the integrator (not
shown to scale on the left) with a double aspheric imaging primary shows that it is theo-
retically possible to come very close to optimum photovoltaic concentrator performance.
with very good approximation, instead of referring to the dispersion of the solar
power cast, we can directly refer to the dispersion of I
SC
instead.
Let us consider the effect of illuminating the cell set in the two extreme cases
(all cells are parallel connected or all cells are series connected). Referring to the
parameters of Eq. (13.1) applied to the cell sets, if all cells are equally illuminated
(I
SC,k
= I
SC
, 1 £ k £ N), we get
(13.4)
where V
OC
and FF are open-circuit voltage and fill-factor of all the (equally illu-
minated) individual cells. Therefore, according to Eq. (13.1), both series and par-
allel sets of cells get the same efficiency when uniformly illuminated.
However, when there is dispersion in the illumination, it is obtained that
(Luqve, Lorenzo, and Ruiz, 1980)
(13.5)
Although the fill-factor when cells are series connected is higher than when they
are parallel connected, the dominant difference with the equally illuminated case
is the decrease of the short circuit current in the series connection case, and in a
(pessimistic) first approximation, it can be said
(13.6)
Quantitatively, the degradation depends on the statistical distribution of the short
circuit current of the differently illuminated cells, which depends on the disper-
sion of different concentrators, their alignment, and so forth. Due to the fact that
the optical efficiency is usually maximum at normal incidence, misalignments
introduce an asymmetry that makes that asymmetric distributions (far from
Gaussian) are usually expected. As an illustrative example of this asymmetry, let
us consider the case of the EUCLIDES
TM
concentrator, which was developed jointly
by the Spanish Solar Energy Institute of the Technical University of Madrid (IES-
UPM), the British company BP solar and the Spanish Institute of Technology and
Renewable Energies (ITER). The biggest photovoltaic concentration plant in the
world, of 480kW, was made in Canary Islands with the EUCLIDES
TM
technology.
This concentrator tracks the sun with a single north-south axis, and it is composed
14 units of a parabolic trough 84m long (composed 140 individual parabolic
mirrors, as shown in Figure 13.5) that concentrate the sunlight onto silicon solar
cells, with a geometrical concentration of 38¥. The interconnection configuration
was based on 1,380 series connected cells grouped in 138 modules.
The structural support of the EUCLIDES
TM
is given by an equilateral trian-
gular beam. This beam suffers flexion and torsion due to the system weight and
the wind loads, which causes pointing errors along the concentrator trough. The
losses associated they’re beam deformations are not relevant for the annual energy
production (because with below 1%; see Arboiro, 1997), but the instantaneous
losses, which can be noticeable, are useful to illustrate the effect of the series con-
nection of the cells. Figure 13.6 shows the results of a simulation of the instanta-
neous performance of the EUCLIDES
TM
if installed in Madrid for the worst case
h
h
series
parallel
SC series
SC parallel
I
I
ª
,
,
IIkNVNVFF‰FF
INI V VFFFF
SC series SC k OC series OC k series k
SC parallel SC k OC parallel OC k parallel k
,, ,,
,, ,,
min=££
{}
=< > << >
=< > ª< > ª< >
1
IIVNVFFFF
INIVVFFFF
SC series SC OC series OC series
SC parallel SC OC parallel OC parallel
,,
,,
== =
===
13.2 Solar Thermal Versus Photovoltaic Concentrator Specifications 325
(the time of the year when the beam deformation and the sun position make the
pointing errors maximum). Figure 13.6a shows the photocurrent I
L
of the cells
along the concentrators, as a function of the cell position and for several wind
speed values. The photocurrent of each cell I
L
is proportional to the optical effi-
ciency of the mirror that illuminates the cell. Figure 13.6b shows the losses intro-
duced by the nonlinear effects of the series connection as a function of the wind
speed. Note that this graph shows only the losses associated with the series con-
nection (it does not include the decrease of the average of the optical efficiency).
This means if the EUCLIDES
TM
were solar thermal, its corresponding value in
Figure 13.6b would be 100% independently on the wind speed. Note that for the
case of no wind, although there is up to ±5% of photocurrent dispersion, only a 2%
loss should be expected. However, if the wind has a speed of 30km/h, the minimum
photocurrent reaches the 62% of the nominal value, and the series connection effi-
ciency drops to 79%. In practice, this low value would be pessimistic because each
one of the 138 modules has a bypass diode, which keeps the series connection effi-
ciency at 83%. These bypass diodes (not mentioned before) introduce another non-
linear effect to provide a way for the current to flow skipping the low photocurrent
modules.
This difference between solar thermal and photovoltaics is important because
effects to basic concepts not always clearly identified. For instance, in solar
thermal it is usual to use the concept of effective sun. This consists of analyzing a
real system as perfect but transferring its different imperfections (mirror profile
and scattering, tracking errors, structural misalignments, etc.) to the sun shape
(Rabl, 1985). This model, which is correct for solar thermal, it is not correct for
326 Chapter 13 Applications to Solar Energy Concentration
Figure 13.5 EUCLIDES
TM
photovoltaic concentrator plant installed in Tenerife, Spain.
(Courtesy of ITER, BP, and IES-UPM)
photovoltaics when the aforementioned nonlinear effects of series connection take
place.
Another direct consequence of all this is the definition of the acceptance angle.
Photovoltaic concentrators with series-connected cells cannot be used effectively
for the angular positions of the sun where the optical efficiency for some individ-
ual cells is low, whereas in solar thermal systems this can be allowed because the
optical efficiency is averaged along the receiver. For example, consider the afore-
mentioned EUCLIDES
IM
parabolic trough. Let us assume that each mirror
has an angular collection curve that can be approximated by a Gaussian curve
with a 50% transmission angle of ±1°. It is easy to obtain from the Gaussian curve
formula that the 90% transmission angle is ±0.4°. In order to avoid a significant
system performance degradation, standard deviation of the mirror positioning and
structural deformation errors should be kept below 1° for the thermal case (speci-
fically, if these errors are Gaussian distributed, a 5% degradation implies a stan-
dard deviation of 0.65°). However, in the photovoltaic case, probably a better
criteria would be to keep the mirror positioning and structural deformation errors
below ±0.4° during 95% of the operation time (if these errors are Gaussian dis-
tributed, this implies a standard deviation of 1°/4.4 = 0.23°, to be compared with
0.65° for the solar thermal). This is the reason why in photovoltaic concentrators
the acceptance angle is usually defined at 90% transmission, whereas the 50%
transmission angle is used as the definition of acceptance angle in solar thermal
systems.
13.3 NONIMAGING CONCENTRATORS FOR
SOLAR THERMAL APPLICATIONS
Table 13.1 shows various solar thermal concentrator types ordered by their geo-
metrical concentration ratio (Cg). In this regard, it is worth pointing out that the
13.3 Nonimaging Concentrators for Solar Thermal Applications 327
0102030
50
60
70
80
90
100
Without
bypass diodes
Wind speed v (km/h)
Series connection efficiency (%)
With bypass
diodes
North
I
L
(z)/ I
L
,nominal
(%)
South
00.51– 0.5–1
60
70
80
90
100
10
20
30
40
50
0
No wind
v = 15
v = 30
z/L
(a) (b)
Figure 13.6 Results of the selected simulation of the EUCLIDES
IM
concentrator instanta-
neous performance in the worst case. (a) Photocurrent of the cells depending on the posi-
tion along the concentrator and for several selected wind speed values. (b) Losses due to the
nonlinear effects of the series connection.
concept of concentration ratio is frequently misapplied. As is clear from the pre-
ceding discussion, this ratio divides the entrance aperture area by the area of the
absorber. For example, the Cg for a trough of diameter D with tubular absorber
of radius r is D/2pr, and not D/2r. The latter definition is sometimes quoted for
parabolic troughs—perhaps because it gives a higher number—but it is not the
thermodynamically correct definition. We will discuss various concentrator
regimes with Cg as the organizing principle. As already noted, we are concerned
with energy efficient concentrators only. Systems with low throughput are not par-
ticularly useful for solar applications.
13.3.1 Stationary Concentrators (Cg < 2)
This category may well be the most important of all because of the practical advan-
tages enjoyed by fixed solar systems. Recall that the elevation angle of the sun
varies by over 6° over the course of the year, a consequence of the tilt of Earth’s
axis of 23° to the plane of the ecliptic (Figure 13.7).
328 Chapter 13 Applications to Solar Energy Concentration
Table 13.1. Implications of availability of solar flux over a range of 1–100,000 suns.
Flux (Suns) Conditions Applications
1–2 Fixed concentrator Cooling and heating
2–100 Nontracking/tracking (linear focus) Power generation (cooling and
heating)
500–10,000 Tracking tower/dish Power generation
20,000–50,000 Solar furnace Materials, lasers space propulsion
70,000–100,000 Speciality solar furnace Materials, lasers, experiments
S
N
December 21
winter
summer
60°
June 21
23.5°
S
N
23.5°
Solar Geometry
Figure 13.7 Tilt of Earth’s axis to the ecliptic plane produces about 60° change in solar
elevation over the year.
Therefore a fixed concentrator would have to accommodate this annual excur-
sion in elevation on top of the diurnal east-west variation of nearly 180°. Clearly,
the diurnal variation indicates a 2D (trough) geometry aligned east-west. But what
of the excursion in elevation? At one time, the concept of a fixed concentrator was
considered an oxymoron. After all, the Cg of a parabolic trough is 1/p sinq for a
tubular receiver. So a parabolic trough aligned east-west that accepts, say, 60° in
elevation would have a concentration ratio Cg = 2/p. Therefore, such an arrange-
ment actually deconcentrates. To be sure, the geometry of the involute was known
to the ancient Greeks, as was the geometry of the parabola. The involute in
principle would have a concentration ratio approaching 1 but, in practice, with a
necessary space or gap between absorber and reflector, Cg falls short of 1. With
the advent of nonimaging optics and the recognition of the sine law of concentra-
tion the situation changed dramatically. Fixed solar concentrators were developed
and applied to thermal uses where the temperature requirements exceeded that
of the flat plate collector. A number of CPC collectors for midtemperature use are
now manufactured (Figures 13.8 and 13.9). A particularly attractive use is thermal
driven absorption cooling. In this application, rooftop solar collectors convert solar
radiation that would otherwise warm up the building into heat at temperatures,
say, 115°C to 180°C (Figure 13.10). The low end of the temperature range can drive
a “single effect” absorption chiller, which can be characterized as quasi-static. They
show a coefficient of performance (COP) of about 0.7–0.8. COP is the ratio of heat
removed by the chiller divided by heat supplied to the chiller. Thermodynamically,
this ratio can exceed 1. The upper end is sufficient to drive a “double-effect” chiller
with a COP of about 1.1–1.2. The heat drives an absorption chiller that actively
13.3 Nonimaging Concentrators for Solar Thermal Applications 329
Figure 13.8 CPC “flat plate” collector for midtemperature.
cools the building, a double benefit. At the low end, the solar collector’s elements
can be nonevacuated, whereas at the upper end, vacuum insulation is needed.
When triple effect machines become commercially available, with driving temper-
atures in the 200°C range, solar cooling systems with stationary concentrators will
be even more efficient. One can look forward to the day when the COP compen-
sates for collector losses so that the amount of heat removed matches the heat
collected.
13.3.2 Adjustable Concentrators (Cg = 2–10)
Narrowing the acceptance angle from 30° to, say, 6° still allows for stationary oper-
ation at least during the day. The required frequency of adjustments goes up
rapidly with Cg. Thus, Cg = 3 needs only biannual adjustment, whereas Cg = 10
requires almost daily updates. Thus, systems of this kind can be characterized as
quasi-static. Such collectors and systems have been successfully operated for
thermal and PV applications on both prototype and commercial scales. An indus-
trial process heat installation in Israel using seasonally adjusted nonevacuated
CPCs is shown in Figure 13.11. A project for heating in a very cold ambient used
a Cg = 3 nonevacuated CPC. This was a school building on a Navajo reservation
in Breadsprings, New Mexico, USA, that is over 2,000m elevation near the
330 Chapter 13 Applications to Solar Energy Concentration
Figure 13.9 Vacuum tube CPC collector for mid- to high temperature.
13.3 Nonimaging Concentrators for Solar Thermal Applications 331
Figure 13.10 Solar cooling using evacuated CPCs driving double-effect absorption chiller.
Continental Divide, which required only winter heating so that the collectors could
be stationary and oriented for winter use. Figure 13.12a shows a schematic
diagram of the collector, and Figure 13.12b shows the collector array on the roof.
13.3.3 Tracking Concentrators, One Axis (Cg = 15–70)
In this category, the most widely deployed type of solar concentrator is the para-
bolic trough, which is not a nonimaging solution. A good example is the solar power
plant at Kramer Junction, California, USA (Figure 13.13). The modern parabolic
trough technology was developed in the United States in the 1970s and early 1980s
with extensive testing and demonstration at Sandia Laboratory in New Mexico.
The technology was commercialized by the LUZ company in Israel, now succeeded
by the Solel Corporation. The parabolic mirrors are back-silvered glass for high
reflectivity and durability. The receiver heat collecting element (HCE) is stainless
steel tubing coated with a highly selective metallo-ceramic (cermet) material and
housed in an evacuated borosilicate glass tube. The glass is chemically treated to
reduce surface (Fresnel) reflections. The working fluid is heated to 400°C so that
the power block is a conventional steam turbine. The backup fuel to the solar heat
332 Chapter 13 Applications to Solar Energy Concentration
Figure 13.11 CPC array (nonevacuated) for process heat.
input is natural gas. This system represents the largest-scale implementation by
far of solar electric power generation.
Nonimaging design approaches in this concentration range have been mainly
focused on the design of CPC-type secondary concentrators for the parabolic. This
has been done for two reasons: (1) increasing the concentration (which can increase
the conversion efficiency by raising the operation temperature of the absorber
tube) and (2) obtaining a more uniform irradiance distribution on the absorber
(which reduces the thermomechanical stress in the tube wall, especially in direct-
steam generation systems; see Goebel et al., 1996/1997).
13.3 Nonimaging Concentrators for Solar Thermal Applications 333
(a)
Receiver
Reflector
surface
Foam
Exterior
housing
Low-iron
glass-cover (
1
/
8
inch)
(b)
Figure 13.12 CPC (nonevacuated) collectors for winter heating and hot water.
Extensive work has been done considering the parabolic primary as an appar-
ent Lambertian source (Collares-Pereira and Mendes, 1995; Collares-Pereira,
Gordon, and Rabl, 1991; Mills, 1995). When the whole primary mirror is consid-
ered as a single Lambertian source, the achievable concentration is low when the
primary f-number is decreased (which is desired for improving the mechanical
design of the supporting structure). This occurs because the actual bundle imping-
ing on the parabola within ±a, after the reflection, is far from performing as a
Lambertian source (its étendue is significantly smaller). In order to obtain designs
for f/0.5 parabolic primaries (i.e., rim angles f =±90°), several solutions based on
the division of the primary mirror in sections considered as Lambertian sources
have been developed. Figure 13.14 shows two examples of these secondary designs,
due to Mills (1995) and Collares et al. (1991). Neglecting the mirror reflectivity
losses, the design of Figure 13.14b has 100% ray collection efficiency within the
acceptance angle and gets a concentration of C/C
MAX
= 0.63, being C
MAX
= 1/sina,
while the parabola gets C/C
MAX
= 1/p = 0.32. On the hand, the design of Figure
13.14a has 98% ray collection efficiency and gets a concentration of C/C
MAX
= 0.80,
while the parabola gets C/C
MAX
= 0.37 for the same ray collection efficiency.
Later, Ries and Spirkl (1996) designed a CPC-type secondary, eliminating the
restriction of assuming the Lambertian-primary approximation—that is, consid-
ering the actual bundle of rays reflected by the primary (see Figure 13.15a).
This design is similar to that of the TIR mirror of the dielectric-filled CPC with
circular aperture (Ning, Winston, and O’Gallagher, 1987), described in Chapter 5.
Ries and Spirkl’s design improved the simplicity of the aforementioned previous
designs by Mills and Collares et al. and gets C/C
MAX
= 0.68 for 100% ray
collection efficiency.
334 Chapter 13 Applications to Solar Energy Concentration
Figure 13.13 Large array of parabolic troughs for electric power generation.
Assuming that the primary mirror contour is fixed to a parabola is also an
unnecessary restriction, which limits the performance of the two-stage collectors.
Benítez et al. (1997) applied the SMS design method (see Chapter 8) to redesign
that of Ries and Spirkl to show that the simultaneous unrestricted design of
primary and CPC-like secondary noticeably improved the optical performance. The
comparison numbers of these two qualitatively identical designs given in Table
13.2. As a result, the SMS design for comparison, both secondaries and the caustic
of the edge rays reflected on the primary, are shown in Figure 13.15.
13.3 Nonimaging Concentrators for Solar Thermal Applications 335
(a) (b)
Figure 13.14 (a) Mills (1995) and (b) Collares et al. (1991) designed CPC-type secondaries
for the Lambertian bundles coming from several primary sections.
calculate
secondary
calculate central portion
of primary (parabola)
calculate outer portion of
primary (non-parabolic)
calculate
secondary
involute
caustic of
egde rays (- a)
caustic of
egde rays ( a)
caustic of
egde rays ( a)
caustic of
egde rays (- a)
(a) (b)
Figure 13.15 Secondary profile and caustics of the edge rays reflected by the primary when
the primary is (a) fixed to a parabola and only the secondary is designed, and (b) is designed
simultaneously with the secondary.
All the aforementioned secondary designs are flow-line mirrors (i.e., mirrors
that guide the flow lines as a funnel). This type of mirrors has been called “non-
sequential” mirrors in Chapter 8 and Appendix B. The flow-line mirrors have the
feature that they have to be located in contact (or very close) to the absorber tube
to achieve high concentration. This forces designers to locate the secondary inside
the evacuated tube, which may be unpractical from the manufacturing point of
view.
The SMS method of Chapter 8 was also used to design two contactless non-
imaging solar thermal collectors, called Snail and Helmet concentrators, which use
sequential mirrors instead of CPC-like mirrors (Benítez et al., 1997). These designs
have a sizeable gap between the optics and the absorber, which has practical inter-
est, as explained following. As in the case of the design of Figure 13.15b, in the
Snail and Helmet concentrators the primary and secondary mirrors are calculated
simultaneously. Since the primary is not forced to be parabolic, there are again
more degrees of freedom available to achieve an improved performance.
The cross section of primary and secondary (this is not to scale) of the Snail
concentrator is shown in Figure 13.14. Its name (and the Helmet’s) is due to the
shape of its secondary mirror. Figure 13.16 also shows some of the edge rays used
in the design process. A detailed explanation of the design procedure for the Snail
is given in Benítez et al., 1997.
The Helmet concentrator cross-sectional diagram is shown in Figure 13.17. On
the contrary to the Snail, the Helmet is symmetric as the conventional parabolic
trough. Further details about the design procedure can be found in Benítez (1998).
Figure 13.18 shows the cross sections of two selected designs.
336 Chapter 13 Applications to Solar Energy Concentration
Table 13.2. Comparison of the edge rays and caustics of Benítez et al.’s (1997) concentra-
tor and Ries and Spirkl’s concentrator (1996). In the former the primary is designed simul-
taneously with the secondary, while in the latter the primary is constrained to have parabolic
profile.
C/C
MAX
Rim angle f (degs) SMS Parabola + TERC Secondary shade
90° 0.74 0.68 2.2%
120° 0.67 0.50 1.7%
–a
a
Figure 13.16 Edge rays used in the Snail concentrator design.
The Helmet concentrator fulfills the condition that the average number of
reflections on the secondary <n> is the lower bound attainable for two-stage col-
lectors and for its design parameters—that is, the same rim angles and geomet-
rical concentration. This lower bond can be expressed (for a small) as
(13.7)
where h
H
and h
P
are the collection efficiencies for r = 1 of the Helmet concentra-
tor and the parabolic concentrator with the same rim angles and geometrical con-
centration. The equality, reached by the Helmet, holds when (1) all the straight
lines that link every point P of the primary with the absorber coincide with
n
HP
≥-hh
13.3 Nonimaging Concentrators for Solar Thermal Applications 337
a
0
50
–50
–100
–150
a = ±0.73°
f =
85.9°
4003002001000–100
–200 –100 0 100 200
0
–100
–200
a = ±0.73°
f =
97.6°
Figure 13.17 Edge rays used in the Helmet concentrator design (secondary not to scale).
Figure 13.18 Cross section of selected Snail and Helmet concentrators, designed for an
acceptance angle a =±0.73°. The angle f is the upper rim angle. Other geometrical para-
meters are absorber radius = 1, (Helmet) C
G
= 54.6, Gap/absorber radius = 11.1, (Snail) C
G
= 69.3, Gap/absorber radius = 6.8.
trajectories of rays reflected at P, and (2) the remaining collected rays reflected at
P suffer only a second reflection on the secondary before reaching the absorber.
In order to compare the performance of Snail and Helmet concentrators with
the designs presented previously, let us represent their corresponding points of the
h - C
0
plane, where h is the collection efficiency, defined as the fraction of the inci-
dent power that reaches the absorber, and the optical (or flux) concentration C
0
,
which is the ratio of the average irradiance on the absorber to the irradiance at
the entry aperture and can be calculated as C
0
= hC
G
. Figure 13.19a shows the
performance points of several Snail and Helmet concentrators designed for a =
±0.73° in the h - C
0
plane, calculated by ray tracing assuming a uniform bright-
ness distribution within ±a. A reflectivity r = 0.95 for the primary and secondary
mirrors has been assumed. The C
0
axis is normalized to the thermodynamic limit
of concentration, C
max
= 1/sina = 78.5.
The Snail concentrators get higher flux concentrations for the same collection
efficiencies than the Helmet concentrators. If a higher reflectivity of the secondary
is assumed (today available as the multilayer interferential mirrors of 3M), the
efficiency and concentration of Snail concentrators increase more than those of the
Helmet concentrators due to their different average number of reflections <n> on
their secondaries: 1.2–1.4 in the Snails and 0.3–0.5 in the Helmets. Figure 13.19b
shows the h - C
0
plane in the limit case when r = 1 (not only for the secondaries
but also for the primaries). The performance points of the other two-stage con-
centrators of Collares-Pereira et al. (1991), Mills (1995), Collares-Pereira and
Mendes (1995), Ries and Spirkl (1996) and Benítez et al. (1997) (the last one,
labelled as Gull) are also represented in this figure for comparison purposes. These
concentrators are not shown in Figure 13.19a because the values of h and C
0
with
reflection losses have not been reported for some of them. The calculation of h
considers as entry aperture only the nonshaded portion of the primary mirror in
all cases.
338 Chapter 13 Applications to Solar Energy Concentration
)
98%96%94%92%90% 100%
30%
40%
50%
60%
70%
80%
90%
100%
Optimal
conc.
C
0
C
max
C
0
C
max
Parabola
)
Mills
Collares-Pereira
et al.
Ries
&
Spirkl
Gull
Snail
Helmet
Helmet
(circular secondary)
77% 80% 83% 86% 89% 92% 95%
90%
95%
80%
85%
70%
75%
60%
65%
Helmet
Snail
(a) (b)
hh
Figure 13.19 The performance of the concentrators can be compared when represented in
the h - C
0
plane. The mirror reflectivity is assumed to be (left) r = 0.95, (right) r = 1.
The best concentrator in the h - C
0
plane of Figure 13.19b would be an optimal
concentrator (not yet available in practice) which has h = 100% and C
0
= C
max
. The
best parabolic troughs (with rim angle f =±90 degrees) are also represented in the
figure.
The Snail and Helmet concentrators are as yet the only known concentrators
with a sizeable gap between the optics and the absorber that are efficient and
approach the optical concentration limit. The other two-stage concentrator designs
need the secondary to be very close to the absorber in order to be efficient, and
this implies that the secondary must be located inside the evacuated tube. Due to
the high temperature of the absorber, this might be complex guaranteeing low
heat-conduction losses through the secondary mirror supporting points. On the
contrary, secondary mirrors placed outside the evacuated tube or integrated with
it (as done with stationary evacuated CPC collectors) are possible when there is a
sizeable gap between absorber and optics, as shown in Figure 13.20.
In the case of the Helmet concentrator, the integrated secondary option is espe-
cially attractive in terms of its simplicity: If the secondary can be approximated
by an arc of circumference, it would be sufficient to metallize a conventional glass
tube. In this approximation, the parameters to optimize are the ordinate of the
center of the circumference z
C
and its radius R¢. Figure 13.21 shows the curves
associated with the Helmet concentrators with circular secondaries for various
values of R¢, with z
C
= R. This figure also shows the points corresponding to the
five Helmet concentrators in Figure 13.19 and the curve associated with the par-
abolic trough with rim angle ±90°, which are the references for comparison. The
calculations made assume a reflection coefficient of r = 100%. As it can be seen,
for an efficiency h = 96.8%, the circular secondary with radius R¢=6, R achieves
a concentration 1.92 times that of the 100% efficient parabola and 1.56 times that
of the parabola with the same collection efficiency. If a radius of R
S
= 11 R, is
assumed for the secondary factors of 2.07 and 1.68 are obtained, respectively. The
same comparison carried out for the Helmet concentrator with respect to the
parabola gives values of 2.29 and 1.86.
The Helmet concentrator is symmetric like the conventional parabolic trough
and has a rim angle close to ±90°, which is of interest for good mechanical stabil-
ity of the collector. In contrast, the Snail concentrator is not symmetric, although
13.3 Nonimaging Concentrators for Solar Thermal Applications 339
reflector (first surface)
vacuum tube
(a) (b)
Figure 13.20 Example of integrated design of secondary concentrators and evacuated tube
for (a) the Snail concentrator and (b) the Helmet concentrator.
the upper rim angle of the primary is also high (90°–105°). The design of asym-
metric two-stage concentrators for tubular absorbers is not new. If a symmetric
system is preferred, it can be obtained by placing the two asymmetric designs (with
their respective receivers) “back to back.” Another way of obtaining a symmetric
collector is shown in Figure 13.22. An advantage of this configuration is that it
does not need a specific supporting structure for the absorber and the secondary
mirror. This strategy was first introduced in the SMTS (Single-Mirror Two-Stage)
photovoltaic concentrator, which will be presented in Section 13.4.2.
13.3.4 Tracking Receiver, Stationary Reflector
A useful hybrid configuration that retains many of the advantages of static systems
while maintaining the relatively high Cg of tracking troughs combines a fixed sta-
tionary reflector with a tracking absorber. Although a number of such configura-
tions have been successfully demonstrated in the past, we will describe one
promising system currently under development. The fixed primary reflector is a
cylinder. By symmetry, rays of any elevation angle are equally (but poorly) con-
centrated into a region bounded by two caustics. The concentrated flux zone moves
with incident direction so that the receiver has to track. By itself, this configura-
tion would not have a high enough Cg to be effective. But when combined with a
340 Chapter 13 Applications to Solar Energy Concentration
Helmet with
circular
secondary
Parabola
Helmet
Optical concentration
C
0
/ C
max
Collection efficiency
Figure 13.21 Results of the analysis of the approximation of the secondary of the Helmet
concentrator by an arc of circumference.
(a) (b)
Figure 13.22 Symmetric two-Snail systems: (a) parabolic trough type and (b) Single-Mirror
Two-Stage (SMTS) type.
secondary concentrator, the overall Cg can rival and even exceed the tracking par-
abolic trough. The angular distribution presented to the secondary concentrator
is highly nonuniform and varies significantly across the aperture. Therefore, this
is a case for the tailored edge-ray method of nonimaging concentrator design. Such
systems are under development for mid- to high-temperature applications. A
prototype with Cg = 40 and evacuated receiver was tested at Sandia (Figure 13.23)
and showed a heat loss coefficient (the efficiency drops only 3% over a span of
13.3 Nonimaging Concentrators for Solar Thermal Applications 341
Figure 13.23 Stationary primary with tracking nonimaging secondary solar concentrator
for high temperature.
300°C), which is even lower than tracking parabolic troughs with evacuated
receivers. There are many advantages to having the primary reflector fixed. One
of the principal benefits is the ability to make the primary reflector part of the roof
structure of a building (Figure 13.24). Another is the potentially lower cost asso-
ciated with a fixed primary reflector.
13.3.5 Tracking Concentrators, Two-Axis (Cg = 50–1,000)
Common types of 2D concentrators are parabolic dishes and Fresnel lenses. Par-
abolic dishes for driving high-temperature engines such as Stirling and various
turbines have been under development for some time. The use of secondary con-
centrators has been proposed to improve performance by increasing either Cg, or
intercept, or reducing tracking and tolerance requirements. For practical reasons,
experiments have generally retrofitted existing dishes with secondary concentra-
tors, rather than taking the preferred path of designing both primary and sec-
ondary elements together. The flow-line design lends itself to this retrofit mode
because the secondary reflector is positioned forward of the focal plane of the
primary. For thermal applications, concentration is necessary to achieve high
temperature.
Since the concentration for a focusing single-stage reflecting concentrator max-
imizes for values of f near 45°, most primaries designed for use without secon-
daries have f-number F/D ratios of between 0.5 and 0.7. Reflecting secondaries
in retrofit applications with these primaries such as illustrated in Figure 13.25
342 Chapter 13 Applications to Solar Energy Concentration
Figure 13.24 A building roof concept for stationary primary with tracking secondary solar
thermal system.
are limited to concentrations between 1.5 and 2.0. However, even this moderate
improvement can be quite important in increasing system performance. For
example, if the root-mean-squared (rms) slope errors on the primary are about 5
milliradians, the corresponding “thermodynamic limit” for the concentration of
sunlight in a medium with index of refraction n = 1 (i.e., in air) is about 1,600¥,
and the best single stage concentrator will be able to achieve only about one-
quarter of this, or about 400¥. A trumpet concentrator can increase this effective
concentration readily to about 750¥.
A project is currently being carried out at the University of Chicago group to
design a practical trumpet secondary concentrator to be used in combination with
a faceted membrane primary concentrator for dish-Stirling applications (Bean and
Diver, 1992). This is a retrofit design for a dish that was originally designed as a
single stage, and so it cannot attain the full power of a fully optimized two-stage
concentrator. The configuration is shown in Figure 13.26. Nevertheless, prelimi-
nary ray-trace studies show that the addition of a small trumpet to the receiver
aperture will allow a reduced aperture size and corresponding lower thermal losses
at the operating temperature of 675°C. In addition the secondary will significantly
increase tolerances for tracking error and surface slope errors on the faceted mem-
brane primary. The optical design has been completed, and a water-cooled proto-
type has been constructed and tested under the supervision of Sandia National
Laboratories. This relatively small step marks the beginning of the incorporation
of these devices into practical commercial solar thermal concentrators and is a first
step toward the eventual utilization of their full potential.
13.3 Nonimaging Concentrators for Solar Thermal Applications 343
–8.00
–1.00 1.00 3.00 5.00 7.00
9.00
–6.00 –4.00 –2.00 0.00 2.00 4.00 6.00 8.00
Primary and Secondary Coordinates (Meters)
D
F
Figure 13.25 Dish primary with flow-line “trumpet” secondary.