Báo cáo y học: "Physiological properties of astroglial cell lines derived from mice with high (SAMP8) and low (SAMR1, ICR) levels of endogenous retrovirus" ppsx
Bạn đang xem bản rút gọn của tài liệu. Xem và tải ngay bản đầy đủ của tài liệu tại đây (1.74 MB, 18 trang )
BioMed Central
Page 1 of 18
(page number not for citation purposes)
Retrovirology
Open Access
Research
Physiological properties of astroglial cell lines derived from mice
with high (SAMP8) and low (SAMR1, ICR) levels of endogenous
retrovirus
Boe-Hyun Kim
1
, Harry C Meeker
2
, Hae-Young Shin
1
, Jae-Il Kim
2
, Byung-
Hoon Jeong
1
, Eun-Kyoung Choi
1
, Richard I Carp
2
and Yong-Sun Kim*
1
Address:
1
Ilsong Institute of Life Science, Hallym University, 1605-4 Gwanyang-dong Dongan-gu, Anyang, Gyeonggi-do 431-060, South Korea and
2
New York State Institute for Basic Research in Developmental Disabilities, Staten Island, NY 10314, USA
Email: Boe-Hyun Kim - ; Harry C Meeker - ; Hae-Young Shin - ; Jae-
Il Kim - ; Byung-Hoon Jeong - ; Eun-Kyoung Choi - ;
Richard I Carp - ; Yong-Sun Kim* -
* Corresponding author
Abstract
Previous studies have reported that various inbred SAM mouse strains differ markedly with regard
to a variety of parameters, such as capacity for learning and memory, life spans and brain
histopathology. A potential cause of differences seen in these strains may be based on the fact that
some strains have a high concentration of infectious murine leukemia virus (MuLV) in the brain,
whereas other strains have little or no virus. To elucidate the effect of a higher titer of endogenous
retrovirus in astroglial cells of the brain, we established astroglial cell lines from SAMR1 and SAMP8
mice, which are, respectively, resistant and prone to deficit in learning and memory and shortened
life span. MuLV-negative astroglial cell lines established from ICR mice served as controls.
Comparison of these cell lines showed differences in: 1) levels of the capsid antigen CAgag in both
cell lysates and culture media, 2) expression of genomic retroelements, 3) the number of virus
particles, 4) titer of infectious virus, 5) morphology, 6) replication rate of cells in culture and final
cell concentrations, 7) expression pattern of proinflammatory cytokine genes. The results show
that the expression of MuLV is much higher in SAMP8 than SAMR1 astrocyte cultures and that
there are physiological differences in astroglia from the 2 strains. These results raise the possibility
that the distinct physiological differences between SAMP8 and SAMR1 are a function of activation
of endogenous retrovirus.
Introduction
The group of SAM strains was derived from an inadvertent
cross between AKR mice and an unknown mouse strain.
Although the background of the original progeny was the
same, subsequent inbreeding from these progeny led to a
series of senescence-prone (SAMP) and senescence-resist-
ant strains (SAMR). Findings in the SAMP strains mani-
fested various phenotypes which are generally different
from SAMR strains [1]. Compared to the SAMR strains,
SAMP strains have shorter life spans, perioptic lesions,
ruffled coat and lordokyphosis. In addition to these gen-
eral signs, each of the SAMP strains shows specific abnor-
Published: 25 November 2008
Retrovirology 2008, 5:104 doi:10.1186/1742-4690-5-104
Received: 30 August 2008
Accepted: 25 November 2008
This article is available from: />© 2008 Kim et al; licensee BioMed Central Ltd.
This is an Open Access article distributed under the terms of the Creative Commons Attribution License ( />),
which permits unrestricted use, distribution, and reproduction in any medium, provided the original work is properly cited.
Retrovirology 2008, 5:104 />Page 2 of 18
(page number not for citation purposes)
malities [2-4]. For example, the SAMP8 strain used in the
current study shows early deficits in learning and memory
[5-7].
Many mouse strains have ancient genomic inserts, termed
proviruses, some of which have the capacity to produce
intact virions (MuLV)[8]. One of the progenitors of the
SAM strains, the AKR mouse strain, expresses high levels
of the prototype ecotropic endogenous retrovirus, murine
leukemia virus (MuLV), which is termed Akv; the AKR
strain exhibits life-long viremia with this virus [9,10]. Pre-
vious studies reported that the titer of MuLV in SAMP8
mice was higher than in SAMR1 mice, a difference that
was particularly pronounced in the brain [10,11]. The
capsid antigen of MuLV was seen in a number of cell types
in brain, and there was extensive activation of astroglial
cells [11]. The astrocytosis was seen in areas in which neu-
rons contained MuLV antigen, and there was extensive
vacuolation. Glial cells, which were once considered
merely supportive elements and were thought to be pas-
sive cells in the nervous system, have recently come to
central stage in efforts to understand the workings of the
brain. Astroglial cells, one of the glia cell types in the cen-
tral nervous system, are highly numerous and likely to
have many divergent roles [12]. Morphologically astro-
glial cells are in closely associated with neurons and have
extensive contacts with endothelial cells from capillaries
[13,14]. Therefore, astroglial cells are positioned to serve
as signaling pathways between neurons, between astro-
glial cells and between neurons and capillaries. It is also
known that astroglial cells are prone to persistent infec-
tion or viral transformation [15].
To analyze the contribution of astroglial cells in the differ-
ence in MuLV titers in brains of SAMP8 and SAMR1 mice,
we have established astroglial cell lines from SAMR1,
SAMP8, and ICR mice to investigate functional capacity to
produce MuLV particles and to provide in vitro cell models
for studying endogenous retroviruses and their effects.
Methods
Animals
SAMR1 and SAMP8 mice have been maintained as inbred
strains in the Institute for Basic Research animal colony
and the Ilsong Institute of Life Science animal colony.
Pathogen-free SAMR1, SAMP8, and ICR (Daehan Biolink,
Korea) animals have been housed in cages in a clean facil-
ity. All animals are on a 12-h light, dark cycle.
Cell culture
Zpl 2-1 and C6 cell lines were used for the neuronal cell
marker and the glial cell marker, respectively. The neuro-
nal cell line Zpl 2-1 was established from hippocampus of
Zürich I mice, as previously described [16]. The glial cell
line, C6, was cloned from a rat glial tumor (ATCC CCL-
107). Both cell lines were maintained in DMEM supple-
mented with 10% FBS, 100 unit/ml penicillin and 100 μg/
ml streptomycin (Gibco BRL), incubated at 37°C in 5%
CO
2
.
Establishment of astroglial cell lines from SAMR1, SAMP8
and ICR mice
Primary astrocyte cells were cultured from 1 day neonates
from SAMR1, SAMP8, and ICR mice [17]. Cells were
obtained from neonates in full compliance with the ethi-
cal guidelines of the National Institutes of Health (NIH).
Cells were cultured on 5 μg/ml poly-L-lysine (P-L-L;
Sigma)-coated dishes with culture media (DMEM with
10% FBS, 100 unit/ml penicillin and 100 μg/ml strepto-
mycin, Gibco BRL), incubated at 37°C in 5% CO
2
and
transfected with SV40 large T antigen containing vector
(φSV40; provided by Dr T. Onodera, Tokyo University)
using 8 μg/ml of hexadimethrine bromide (Sigma-
Aldrich, San Diego, CA, USA)[18]. After 24 h, cells were
detached from culture dishes to eliminate microglia cells
and oligodendrocytes and then transferred to new culture
dishes. The origin of the mouse lines and characteristics of
cell lines used in the present study are shown in Table 1.
Western blot analysis and immunocytochemistry
For Western blot analysis, 50 μg protein from brain
homogenates from each cell lysate and 40 μl of cell-free
cell culture medium obtained after centrifugation at
25000 × g, 4°C for 30 min were separated on 12% Tris-
glycine gels and transferred to nitrocellulose membrane
(Amersham) [19]. The membrane was blocked with 5%
nonfat dry milk in 0.1% TBST (Tris-buffered saline with
tween-20; 20 mM Tris-HCl, 140 mM NaCl, 0.1% Tween-
20) for 1 h at room temperature and then probed with
one of the following primary antibodies: rat-anti-GFAP
(glial fibrillary acidic protein) at dilution of 1:5000
(DAKO, Glostrup, Denmark), mouse-anti-NeuN (neu-
ron-specific nuclear protein) at 1: 1000 (Chemicon,
Temecula, California, USA), mouse-anti-CD11b (Integrin
α M) at 1:1000 (Serotec, Oxford, UK), mouse-anti-
CNPase (2',3'-cyclic nucleotide 3'-phosphodiesterase) at
1:1000 (Sigma-Aldrich, St. Louis, Missouri, USA), and
goat-anti-MuLV CAgag at 1:5000 (Quality Biotech,
Inc.)[11,16]. The primary antibody was incubated over-
night at 4°C, and the appropriate secondary antibodies
Table 1: Mouse origin and characteristics of cell lines.
Cell lines Mouse origin Cell line expression
MuLV mRNA and CAgag
R1A1, R1A2, R1A5 SAMR1 +
P8A1, P8A7, P8A9 SAMP8 +++
ICR-A1, ICR-A2, ICR-A3 ICR -
Retrovirology 2008, 5:104 />Page 3 of 18
(page number not for citation purposes)
conjugated with horseradish peroxidase (Zymed, San
Francisco, California, USA), anti-rat-HRP-conjugated at
1:3000, anti-mouse-HRP-conjugated at 1:5000, anti-goat-
HRP-conjugated at 1:3000, were then added. Bound anti-
bodies were visualized by chemiluminescence (Pierce,
Rockford, Illinois, USA). Mouse-anti-β-actin at 1:10000
(Sigma-Aldrich, St. Louis, Missouri, USA) was used as a
cellular marker. Expression levels of each protein were
quantified by densitometer (GS-800, Bio-Rad, California,
USA).
For immunocytochemistry, cells were plated on glass-
cover slips and cultured for 24 h. Cells were fixed with 4%
paraformaldehyde in PBS, permeabilized with 0.2% Tri-
ton X-100 (Sigma-Aldrich) at room temperature for 10
min, treated with 5% normal donkey serum (Jackson,
West Grove, Pennsylvania, USA) in PBS at room tempera-
ture for 1 h, and then rinsed with PBS. Cells were incu-
bated with primary antibodies against rabbit-anti-GFAP at
1:100 (DAKO) and rat-anti-GFAP at 1:100 as an astrocyte
marker, mouse-anti-MAP2 (microtubule-associated pro-
tein 2) at 1:50 (Upstate, Charlottesville, Virginia, USA) as
a neuronal marker, mouse-anti-CD11b at 1:50 (Serotec)
as a microglia marker and mouse-anti-CNPase at 1:50
(Sigma-Aldrich) as an oligodendrocyte marker, then
maintained overnight at 4°C. Appropriate secondary anti-
bodies conjugated with fluorochromes (Zymed), anti-rab-
bit-FITC at 1:200, anti-rat-FITC at 1:200, anti-goat-TRITC
at 1:200 and anti-mouse-TRITC at 1:200, were then
applied. After washing with PBS, cells were incubated with
10 μM DAPI (4',6-Diamidino-2-phenyindole, dilac-
tate)(Sigma-Aldrich) at 37°C for 1 min and observed
using confocal microscopy (Zeiss). DAPI staining was
used as a cellular marker. For double-staining, cells on
cover slips were prepared as noted above and then incu-
bated with each primary antibody at the dilution listed
above overnight at 4°C. After incubation, slides were
washed with PBS and then appropriate secondary anti-
bodies conjugated with fluorochromes (Zymed) were
applied at the appropriate dilution as noted above. After
washing with PBS, 10 μM DAPI staining was applied and
the cells observed using confocal microscopy (Zeiss). The
results were representative of at least three separate exper-
iments.
Reverse transcriptase polymerase chain reaction (RT-PCR)
Total mRNA was extracted using Trizol reagent (Invitro-
gen, Carlsbad, California, USA) and cDNA was synthe-
sized from 2 μg of total RNA by reverse transcription using
AMV reverse transcriptase (Promega, Madison WI) and
oligo (dT) primer. To test for integration of SV40 large T
antigen, genomic DNA was extracted from cultured cells
using a DNA extraction kit (Qiagen, Hilden, Germany).
PCR was performed with the following primers (Bioneer,
Daejon, Korea): SV40 large T antigen, sense: 5'-TGAG-
GCTACTGCTGACTCT-3'; antisense: 5'-GCATGACT-
CAAAAAACTTAGCAATTCTG-3'; Akv, sense: 5'-
ATGGAGAGTACAACGCT CTCA-3'; antisense: 5'-GAGGT-
TAGATTGTTGCTTACTG-3'. As a cellular marker GAPDH
(glyceraldehydes 3-phosphate dehydrogenase) was per-
formed with the following primers, sense: 5'-TGG-
TATCGTGGAAGGACTCATGAC-3'; antisense: 5'-
ATGCCAGTGAGCTTCCC GTTCAGC-3'. Expression levels
of Akv and GAPDH were quantified by densitometer (GS-
800, Bio-Rad, California, USA). Purified RNA (2 μg) was
used as a substrate for single-stranded cDNA synthesis. An
aliquot (5 μl) of the cDNA of each sample was used for
PCR with primers for IFNγ, TNF-α, TNF-β, IL-1α, IL-1β, IL-
6, and β-actin, a housekeeping gene. The PCR primers
used are shown in Table 2[20-22]. The DNA mixture was
amplified for 30 cycles (each consisting of denaturation
45 sec at 95°C, annealing for 45 sec at 58°C, extension for
1 min at 72°C), received a final extension for 10 min at
72°C and was stored at 4°C in a thermal cycler (Ampli-
fied Biosystem, USA) [21,22]. Products were analyzed by
1% agarose gel electrophoresis and visualized by ethid-
ium bromide staining under UV light.
Culture of cell lines for UV plaque assay
SC-1 cells (ATCC CRL-1404) were grown in Dulbecco's
modified eagle medium (DMEM) + 10% fetal bovine
serum (FBS) + 100 unit/mL penicillin + 100 μg/mL strep-
tomycin (DMEM10A). The XC cell line (ATCC CCL-165)
was grown in DMEM + 10% FBS without antibiotics
(DMEM10). SC-1 and XC cells were harvested for use in
plaque assays using trypsin and suspended in the appro-
priate medium for assay. All cell growth and plaque assays
were done at 37°C in a 5% CO
2
incubator.
Preparation of cell homogenates for UV plaque assay
Cells were harvested by trypsinization and kept on ice
until further processing by homogenization in DMEM
(10% w/v), using 20 strokes in a hand-operated tissue
homogenizer. Serial dilutions of cell homogenates were
prepared in DMEM + 5% FBS + penicillin-streptomycin +
25 μg/mL DEAE-dextran (DMEM5A-DEAE).
SC-1 UV plaque assay
Ecotropic MuLV was quantitated using the SC-1/UV
plaque assay [10]. SC-1 cells were plated onto 60 mm
dishes at 10
5
cells/dish in 4 mL DMEM10A. The next day,
1 h before the addition of cell homogenates, medium in
the dishes was discarded and replaced with 3 mL
DMEM5A-DEAE. One mL of sample (brain homogenate
or cell line homogenate) diluted in the same medium was
then added to plates. One to 2 days after addition of
homogenates, medium was removed and replaced with 4
mL/dish DMEM5A. After 5 days, medium was removed
and cultures were exposed to 30 s of UV irradiation.
Immediately after UV irradiation, 4 mL of a suspension
Retrovirology 2008, 5:104 />Page 4 of 18
(page number not for citation purposes)
containing 3.0 × 10
5
XC cells/mL in DMEM10 were pipet-
ted into each dish. After 24 h incubation, the medium was
discarded. Cultures were washed once with phosphate-
buffered saline (PBS), fixed with 100% methanol for 5
min and stained with hematoxylin (Fisher Scientific,
USA) for 5 min. Hematoxylin was discarded, the cultures
washed twice with tap water, and the plaques counted
under a dissecting microscope.
Electron microscopy
Cells were fixed in half-Karnovsky's fixative (1.66% glu-
taraldehyde, 1.6% paraformaldehyde buffered with 0.1 M
cacodylate buffer) for 2 h at 4°C. Post-fixation was done
in 1% osmium tetroxide buffered with cacodylate buffer
for 1.5 h at 4°C. Following fixation, cells were pelleted
and washed three times in 0.1 M cacodylate buffer. Cell
pellets were dehydrated through a graded ethanol-propyl-
ene oxide series and embedded in Epon 812 (Electronic
Microscopy Science). Ultra thin sections (75 nm) were cut
in a RMC MTXL ultramicrotome (Tucson, USA) and
stained with 2% uranyl acetate and lead citrate. The sec-
tions were observed using a transmission electron micro-
scope (Zeiss-EM109, Oberkochen, Germany).
For immuno-electron microscopy experiments, cells were
fixed for 3 h at 4°C with 3% paraformaldehyde and
0.25% glutaraldehyde in phosphate buffer (0.1 M, pH
7.4). Pellets were dehydrated in increasing concentrations
of ethanol and embedded in LR white (Electron Micros-
copy Sciences, Hatfield, PA, USA) and cured for 48 h at
50°C. Ultra thin sections (75 nm) were collected on
nickel grids and used for labeling with a goat antiserum
specific for the virus CAgag protein, followed by incuba-
tion with a rabbit anti-goat IgG conjugated to 15 nm gold
particles (Electron Microscopy Sciences, Hatfield, PA,
USA). Sections were post-stained with 2% uranyl acetate
and lead citrate and observed with a transmission electron
microscope (Zeiss-EM109, Oberkochen, Germany). The
viral particles were counted and their diameters measured
in 13 independent fields (85 μm
2
) of R1A and P8A cell
lines. The number of gold particles were counted in 18
independent fields (85 μm
2
) within the plasma mem-
brane.
To obtain negative staining images, cells were scraped
then frozen and thawed for three cycles. Supernatant and
disrupted cells were combined and centrifuged at 1000 ×
g for 10 min at 4°C. Supernatants were transferred to a
20% sucrose cushioned tube and centrifuged at 130000 ×
g for 3 h at 4°C (SW28 rotor, Beckman). Viral particles
were suspended in 30 μl of sterile phosphate-buffered
saline (PBS) then incubated at 37°C for 30 min. Fixation
and staining were done using 2% phosphotungustic acid
(PTA) solution.
Estimation of the cell growth cycle and morphological
analysis
Each of the cell lines was seeded at a density of 1 × 10
5
cells and incubated at 37°C in 5% CO
2
; a series of sepa-
rate cell cultures were stained with 0.4% trypan blue solu-
tion (Sigma-Aldrich, USA) and counted each day for 12
days using hemacytometer (Sigma-Aldrich, USA)(Kim et
al., 2005). Cell growth and morphological analysis was
assessed using inverted microscopy (Zeiss, Oberkochen,
Germany). Each cell count and microscopic analysis was
repeated at least three times.
Table 2: Primer sequences for RT-PCR analysis of cytokines.
Polarity Sequence Product size
IFN-γ sense 5-CATGAAAATCCTGCAGAGCC-3 304 bp
antisense 5-GGACAATCTCTTCCCCACCC-3
TNF-α sense 5-GGCAGGTCTACTTTGGAGTCATTGC-3 307 bp
antisense 5-ACATTCGAGGCTCCAGTGAATTC-3
TNF-β sense 5-TGGCTGGGAACAGGGGAAGGTTGAC-3 205 bp
antisense 5-GTGCTTTCTTCTAGAACCCCTTGG-3
IL-1α sense 5-CTCTAGAGCACCATGCTACAGAC-3 308 bp
antisense 5-TGGAATCCAGGGGAAACACTG-3
IL-1β sense 5-TTGACGGACCCCAAAAGATG-3 203 bp
antisense 5-AGAAGGTGCTCATGTAATCA-3
IL-6 sense 5-GCCAGAGTCCTTCAGAGAGAT-3 213 bp
antisense 5-CCGAGTAGATCTCAAAGTGAC-3
iNOS sense 5-GTCGACCTTCCGAAGTTTCTGGCAGCAGCG-3 470 bp
antisense 5-GTCGACGAGCCTCGTGGCTTTGGGCTCCTC-3
β-actin sense 5-TGTGATGGACTCCGGTGACGG-3 198 bp
antisense 5-ACAGCTTCTCTTTGATGTCACGC-3
IFN, interferon; TNF, tumor necrosis factor; IL, interleukin; iNOS, inducible nitric oxide synthase
Retrovirology 2008, 5:104 />Page 5 of 18
(page number not for citation purposes)
Statistical analysis
Statistical analyses were performed by appropriate one-
way ANOVA test. All data were reported as means ± SD. A
P value of less than 0.05 was considered significant.
Results
Analysis of expression of the MuLV gene and protein in the
brains of ICR, SAMR1 and SAMP8 mice
The expression levels of the MuLV gene and protein were
investigated in brains of 12 months ICR, SAMR1, and
SAMP8 mice. Using RT-PCR analysis of endogenous
MuLV gene expression, we have shown that the expression
of MuLV was not detected in ICR nor SAMR1 brains (R1B)
but was present in SAMP8 brains (P8B) (Fig. 1A). MuLV
gene expression level in P8B was significantly higher than
ICR and R1B (p < 0.01) (Fig. 1B). To analyze the expres-
sion level of the MuLV protein, CAgag, a Western blot was
performed. In agreement with RT-PCR data, MuLV protein
was neither detected in ICR nor R1B but was present in
P8B (p < 0.01) (Fig. 1C and 1D). GAPDH and β-actin were
included as concentration monitors for RT-PCR analysis
and Western blot, respectively.
Astroglial cell lines were established from SAMR1, SAMP8
and ICR mice
Three distinct astrocyte cell lines were established from
the cerebral region of SAMR1 (R1A cell lines: R1A1, R1A2
and R1A5), SAMP8 (P8A cell lines: P8A1, P8A7 and
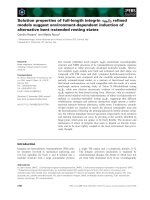
Expression levels of the MuLV gene and protein in ICR (n = 12), SAMR1 (n = 12) and SAMP8 (n = 10) brainsFigure 1
Expression levels of the MuLV gene and protein in ICR (n = 12), SAMR1 (n = 12) and SAMP8 (n = 10) brains. (A)
Analysis of genetic expression level of the MuLV, Akv gene (605 bp), by RT-PCR in the brains of ICR, SAMR1, and SAMP8 mice.
Levels of GAPDH served as a measure of sample concentration. (B) Densitometry analysis of Akv expression in A. *statistically
significant difference (p < 0.01). (C) Analysis of protein expression levels of the MuLV, CAgag (30 kDa), by Western blot in the
brains of ICR, SAMR1, and SAMP8 mice. 50 μg of brain homogenates were used. Levels of B-actin were used as a measure of
sample concentration. (D) Densitometry analysis of CAgag expression in C. *statistically significant difference (p < 0.01).
Retrovirology 2008, 5:104 />Page 6 of 18
(page number not for citation purposes)
P8A9), and ICR (ICR-A cell lines: ICR-A1, ICR-A2 and
ICR-A3) mice (Table 1). The presence of the gene for SV40
large T antigen was examined with PCR analysis using
GAPDH (glyceraldehyde-3-phosphate dehydrogenase) as
the housekeeping control gene. As shown in Fig. 2A,
established R1A, P8A, and ICR-A cell lines had similar
expression levels of SV40 large T antigen as an immortali-
zation marker. The cell-type marker antibodies described
in Materials and Methods were used to characterize the
transformed cell lines. SAMP8 mouse brain was positive
for both the astroglial (GFAP) and the neuronal (NeuN)
marker. Zpl 2-1 and C6 cell lines were used as positive
controls for the neuronal marker and the astroglial
marker, respectively. R1A, P8A, and ICR-A cell lines were
astroglial-positive in Western blot analysis using antibod-
ies against GFAP, a 50 kDa protein band which did not
react with Zpl 2-1 hippocampal neuronal cell lysates (Fig.
2B). Using anti-NeuN antibody, a 66 kDa protein band
was detected only in Zpl 2-1 cell lysates and SAMP8 brain
homogenates (Fig. 2B). Thus, the established cell lines
were shown to be composed of astroglial cells. The results
of immunofluorescence analysis were in accordance with
the Western blot findings: R1A, P8A, ICR-A, and C6 cell
lines were positive for GFAP staining but not MAP-2 stain-
ing, whereas Zpl 2-1 cells were positive for MAP-2 but not
GFAP (Fig. 3). All cultures were negative for the oli-
godendrocyte and microglial markers in both Western
blot and immunofluorescence experiments (data not
shown).
Expression of the MuLV gene and protein in R1A, P8A and
ICR-A cell lines
RT-PCR analysis was used to assess the level of endog-
enous MuLV expression in R1A, P8A and ICR-A cell lines.
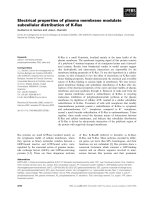
Establishment of astroglial cell lines immortalized by SV40 T antigenFigure 2
Establishment of astroglial cell lines immortalized by SV40 T antigen. (A) Confirmation of SV40 large T antigen (105
bp) in R1A, P8A, and ICR-A cell lines by PCR analysis. 100 bp M: 100 bp DNA ladder marker; Zpl 2-1: a positive control;
SAMR1 and SAMP8 brain: negative controls. (B) Characterization of cell types by Western blot analysis. SAMP8 brain: a posi-
tive control for GFAP (50.0 kDa) and NeuN (66.0 kDa); Zpl 2-1: a positive control for NeuN and a negative control for GFAP.
Retrovirology 2008, 5:104 />Page 7 of 18
(page number not for citation purposes)
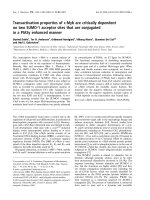
Confirmation of cell-type of established astroglial cell lines by immunocytochemistryFigure 3
Confirmation of cell-type of established astroglial cell lines by immunocytochemistry. Characterization of cell
types by immunofluorescence analysis. DAPI staining (blue fluorescence) was used as a cellular marker. Astroglial cell marker
GFAP: green fluorescence; neuronal cell marker MAP-2: red fluorescence. C6 and Zpl 2-1 cell lines were used for positive glial
cell control and positive neuronal cell control, respectively.
Retrovirology 2008, 5:104 />Page 8 of 18
(page number not for citation purposes)
Homogenate of SAMP8 brain was used as a positive con-
trol and Zpl 2-1 cell line and SAMR1 brain homogenate
served as negative controls. We found that MuLV expres-
sion was not detected in ICR-A or Zpl 2-1 cell lines, nor in
SAMR1 brain (R1B) but was present in R1A and P8A cell
lines and SAMP8 brain (P8B) tissue (Fig. 4A). The expres-
sion level of MuLV in P8A cell lines was significantly
higher than in R1A cell lines (p < 0.01) (Fig. 4B). In con-
trast, GAPDH was expressed to the same extent in all sam-
ples.
In order to analyze the expression of the MuLV protein,
CAgag, Western blot analysis was performed. CAgag was
detected in SAMP8 brains, R1A cell lines, P8A cell lines,
and in SC-1 cells which had been infected with P8A cell
line homogenate (labeled SC-1-Tf-P8A1), whereas CAgag
was not detected in the Zpl 2-1 cell lines, SAMR1 brains,
and ICR-A cell lines (Fig. 5A). The CAgag levels in P8B cell
lines were significantly higher (p < 0.01) than in R1A cell
lines (Fig. 5B). SAMR1 brain homogenate and Zpl 2-1 cell
homogenate served as negative controls and SAMP8 brain
homogenate was used as a positive control. The same
amount of total protein was analyzed as shown by the
similar levels of β-actin expression in all of the samples. In
agreement with the Western blot findings, the R1A and
P8A cell lines were positive for CAgag immunostaining,
whereas ICR-A cell lines were negative (Fig. 5C). Staining
for endogenous MuLV protein was detected in cytoplasm
Genetic expression level of the MuLV in R1A, P8A and ICR-A cell linesFigure 4
Genetic expression level of the MuLV in R1A, P8A and ICR-A cell lines. (A) mRNA expression of Akv (605 bp) in
R1A, P8A, and ICR-A cell lines. As a housekeeping gene GAPDH (200 bp) was used. 100 bp M: 100 bp DNA ladder marker;
Zpl 2-1 and R1B (12-month-old SAMR1 brain): negative controls; P8B (12-month-old SAMP8 brain): a positive control. (B)
Densitometry of Akv gene expression levels in the ICR-A, R1A and P8A cell lines. Expressed levels of MuLV in P8A cell lines
were significantly higher than in R1A cell lines. *statistically significant difference (p < 0.01).
Retrovirology 2008, 5:104 />Page 9 of 18
(page number not for citation purposes)
Expression levels of the MuLV protein, CAgag, in ICR-A, R1A and P8A cell linesFigure 5
Expression levels of the MuLV protein, CAgag, in ICR-A, R1A and P8A cell lines. (A) Western blot analysis for
expression of CAgag in cell lysates (50 μg) using anti-CAgag antibody. β-actin was used as a sample concentration marker. Zpl
2-1 and R1B (12-month-old SAMR1 brain): negative controls; P8B (12-month-old SAMP8 brain) and SC-1-Tf-P8A1 (SC-1 cells
infected with P8A1 cell homogenate): positive controls. (B) Densitometry of CAgag and β-actin in the ICR-A, R1A and P8A cell
lines. CAgag protein levels were significantly higher in the P8A cell lines than in the R1A cell lines. *statistically significant differ-
ence (p < 0.01). (C) Immunofluorescence analysis of CAgag in ICR-A, R1A and P8A cell lines. Expression of CAgag in R1A, P8A
and ICR-A cell lines was analyzed using anti-GFAP (green) and anti-CAgag (red) antibodies. DAPI staining (blue fluorescence)
was used as a cellular marker.
Retrovirology 2008, 5:104 />Page 10 of 18
(page number not for citation purposes)
where it was merged with GFAP staining. In accordance
with Western blot analysis, the amount of CAgag staining
was less in R1A cell lines than in P8A cell lines. The differ-
ence in color of the merge pictures seen for the R1A1 and
P8A9 is probably a function of the fact that the concentra-
tion of CAgag is higher in the P8 cell lines than in the R1
cell lines.
Release of CAgag protein and MuLV particles from R1A
and P8A cell lines and analysis of infectivity levels
To determine whether cell-associated CAgag detected in
homogenates of R1A and P8A cells was released from
cells, culture media of each cell line was harvested and
analyzed using anti-CAgag antibody in Western blots.
CAgag was detected in R1A cell lines at low levels and in
P8A cell lines at high levels (Fig. 6A). There was a signifi-
cant difference in the level of released CAgag between the
two types of cell lines (p < 0.01) (Fig. 6B). The level of
CAgag found in P8A9 cell lysate (P8A9-Cl in Fig. 6B) was
slightly less than that seen in the media from P8A9 cell
culture. Zpl 2-1 culture media was used as a negative con-
trol and SAMP8 brain homogenate was the positive con-
trol.
Using transmission electron microscopy (TEM), synthe-
sized virus particles budding from the plasma membrane
were observed in R1A and P8A cell lines (Fig. 7A and 7B);
similar particles were not observed in ICR-A cell lines
(data not shown). The concentration of MuLV particles
was significantly higher in P8A cell lines than in R1A cell
Immunoblot analysis of CAgag in culture media from ICR-A, R1A and P8A cell linesFigure 6
Immunoblot analysis of CAgag in culture media from ICR-A, R1A and P8A cell lines. (A) Western blot analysis for
expression of CAgag (40 μl of culture media) using anti-CAgag antibody. Zpl 2-1 culture media: a negative control; SAMP8
brain (12-month-old) and P8A9 cell lysate (P8A9-CL) (50 μg): positive controls. (B) Densitometry of CAgag in cell culture
media. CAgag protein levels in P8A cell culture media were significantly higher than in R1A cell culture media. *statistically sig-
nificant difference (p < 0.01).
Retrovirology 2008, 5:104 />Page 11 of 18
(page number not for citation purposes)
Figure 7 (see legend on next page)
Retrovirology 2008, 5:104 />Page 12 of 18
(page number not for citation purposes)
lines (p < 0.01), as determined by either uranyl acetate/
lead citrate staining or by gold-labeling (Fig. 7C). The
diameters of particles in the fixed tissues were measured in
13 independent fields (85 μm
2
), and each experiment was
repeated three times. Viral particles observed in R1A cell
lines averaged 70 nm including their envelope, whereas
particles from P8A cell lines averaged 80 nm.
For PTA-stained virus preparations derived from the dif-
ferent cultures, the different morphology seen in virus
particles from R1A and P8A shown in Fig. 7D is not a con-
sistent difference between the two cell cultures, but rather
reflects the variation seen in PTA preparations: the R1A
particle morphology shown in Fig. 7D can also be seen in
P8A preparations and vice-versa.
Testing of R1A, P8A, and ICR-A cell lines for ecotropic
MuLV infectivity showed striking differences in virus titer
among these cell lines (Table 3). R1A and ICR-A cell lines
exhibited no demonstrable virus in either cells or superna-
tants even using undiluted inoculum, whereas 10
4
~10
6
plaque-forming units (PFU)/ml of virus was found in P8A
cells and supernatants.
Different characteristics of astroglial cells in the R1, P8
and ICR cell lines
The cell morphology of the 3 types of cells is different: The
R1A cells have a long hexagonal shape with smooth
plasma membranes, P8A cells have a pentagonal shape
with ruffled plasma membranes, and ICR-A cells have a
pentagonal shape with smooth plasma membranes (Fig.
8).
R1A, P8A, and ICR-A cell lines also showed differences in
their growth rates. For the first 7 days, the proliferation
rates for the R1A cell lines were higher than those for the
P8A and ICR-A cell lines (Fig. 9A); this was reflected in an
analysis of the doubling times for the cell lines (Fig. 9B).
The growth rates for P8A and ICR-A cell lines were virtu-
ally identical prior to D7 and, therefore, their doubling
rates were similar. After D7, cell numbers for R1A and
ICR-A cell lines remained relatively constant, whereas the
P8A cell lines showed a dramatic increase in cell counts
until D10 and then decreased on Days 11 and 12 (Fig.
9A).
Expression profiles of genes coding for proinflammatory
cytokines in R1A, P8A and ICR-A cell lines
The levels of gene expression of the following inducible
cytokines were measured in the 3 cell types: IFN-γ, TNF-α/
β, IL-1α/β, IL-6 and iNOS. The results of RT-PCR analysis
showed marked induction of TNF-β, IL-β, and IL-6 in R1A
cell lines, IFN-γ, TNF-α, and IL-1α in P8A cell lines, and
IFN-γ, TNF-α and TNF-β in ICR-A cell lines (Fig. 10A).
Expression levels were quantitated and compared by den-
sitometry (Fig. 10B); iNOS was not activated in any astro-
glial cell lines used in this study (data not shown).
Significant differences in expression between R1A and
P8A cell lines were seen in IFN-γ, TNF-α and TNF-β, IL-1α,
IL-1β, and IL-6 (Fig. 10B). Significant differences between
P8A and ICR lines were seen for TNF-α and IL-1α.
Discussion
The extensive studies of endogenous retroviruses have
centered primarily on their dramatic effects as exemplified
Electron microscopy of viral-like particles generated by the R1A and P8A cell linesFigure 7 (see previous page)
Electron microscopy of viral-like particles generated by the R1A and P8A cell lines. (A) Images of virus particles
from R1A cell lines. Single virus-like particles were present at the cell membrane (left panel) and at an intracellular vacuole
(middle panel). Immuno-gold image was obtained after labeling with an antibody specific for the virus CAgag protein (right
panel) (Scale bar = 400 nm). (B) Images of the virus particles from P8A cell lines. Multiple virus-like particles were present at
the cell membrane (left panel) and in intracellular vacuoles (middle panel). Immuno-gold image was obtained after labeling with
anti-CAgag antibody (right panel) (Scale bar = 400 nm). (C) Quantification of virus particles and of labeling of viral particles
with gold beads. The average number of viral particles was 1.85/μm
2
and 8.85/μm
2
in the R1A and P8A cell lines, respectively.
The average number of gold particles was 9.98/μm
2
and 24.28/μm
2
in the R1A and P8A cell lines, respectively. *statistically sig-
nificant difference (p < 0.01). (D) Negative stain images of single viral particle from R1A and P8A cell lines. R1A-viral particle
size averaged 70 nm and P8A-viral particle averaged 80 nm large.
Table 3: Ecotropic MuLV in astrocyte cell lines and supernatant
of SAMR1, SAMP8 and ICR mice.
Cell lines Infectivity*
Cells Supernatant
R1A1 - -
R1A2 - -
R1A5 - -
P8A1 + +
P8A7 + +
P8A9 + +
ICR-A1 - -
ICR-A2 - -
ICR-A3 - -
* Plaque-forming units (PFU)/ml
+ indicates a titer higher than 10
4
/ml.
- indicates no demonstrable virus even in undiluted material.
Retrovirology 2008, 5:104 />Page 13 of 18
(page number not for citation purposes)
Characterization of morphology of established cell linesFigure 8
Characterization of morphology of established cell lines. Morphological appearance of the R1A, P8A, and ICR-A cell
lines were compared using an inverted microscope. P8A cells showed ruffled edges of plasma membranes in contrast to the
comparatively smooth edges seen in R1A and ICR-A cells.
Retrovirology 2008, 5:104 />Page 14 of 18
(page number not for citation purposes)
by the indication of leukemia-lymphoma in several
mouse strains, e.g. AKR [23]. The examination of cryptic
effects induced by endogenous retroviruses in other spe-
cies and in mice with different genetic characteristics has
received less attention. Recently, there have been several
studies aimed at understanding the expression of endog-
enous retroviruses and their pathological and physiologi-
cal effects [23,24]. In humans, it has been reported that
the human endogenous retrovirus (HERV-W) is highly
expressed in the central nervous system (CNS) glia of indi-
viduals with multiple sclerosis (MS) [23,25,26]. Endog-
enous retroviruses have been described in other mammals
and in birds; it was suggested that some types of cancers
are induced by endogenous retroviruses in these species
[27]. The SAMP8 mouse strain expresses MuLV and devel-
ops several pathophysiological changes including neuro-
degeneration that is characterized by astrocytosis and
neuronal loss [2,23,28].
The SAMR1 mouse that is characterized by low or no
MuLV infectivity, normal histological appearance, normal
life span and normal capacity for learning and memory
The difference in growth rates of R1A, P8A and ICR-A cell linesFigure 9
The difference in growth rates of R1A, P8A and ICR-A cell lines. (A) Comparison of the growth rates of R1A, P8A,
and ICR-A cell lines. (B) Representative doubling times of each cell line. Proliferation time was estimated from the growth rate
of each cell line. The numbers above each column represent the doubling time in hours of each cell line.
Retrovirology 2008, 5:104 />Page 15 of 18
(page number not for citation purposes)
RT-PCR analysis of inducible proinflammatory cytokine genes expressed in R1A, P8A and ICR-A cell linesFigure 10
RT-PCR analysis of inducible proinflammatory cytokine genes expressed in R1A, P8A and ICR-A cell lines. (A)
Proinflammatory cytokine genes, TNF-α, TNF-β, IL-1α, IL-1β and IL-6 plus the anti-viral cytokine gene, IFN-γ, were assessed in
each cell line. β-actin was used for analysis of cell protein concentration. 100 bp M, 100 bp DNA ladder marker. (B) Quantita-
tive analysis of proinflammatory cytokine genes and the gene for IFN-γ. Expression levels were measured by densitometry.
Expression of the housekeeping gene, β-actin, was measured in each preparation. *statistically significant difference (p < 0.05).
§Comparisons not showing a statistically significant difference.
Retrovirology 2008, 5:104 />Page 16 of 18
(page number not for citation purposes)
served as the contrasting strain for SAMP8. The ICR strain
was the virus negative control. Analysis of the transformed
astroglial cell lines derived from SAMR1, SAMP8 and ICR
mice revealed a number of differences: (1) The initial
(through day 6) growth of the 3 R1A cell lines exceeded
the rate for both the P8A and ICR-A lines, however, the
P8A cell lines replicated faster in the subsequent 6 days
and reached higher concentrations than the other cell
lines, (2) Although all of the cell lines were shown to be
composed of astroglia, there were morphological differ-
ences; of particular interest in this regard is the ruffled
plasma membranes of the P8A lines vs. the smooth mem-
branes of the R1A and ICR-A lines, (3) The expression of
a number of cytokines were significantly different in P8A
vs. R1A lines: IFN-γ, TNF-α and TNF-β, IL-1α, IL-1β, and
IL-6. For a number of these cytokines, the level of expres-
sion of RNA was not a function of MuLV titer, since
although there was a significant difference between P8A
lines and R1A lines, there was no difference between P8A
and the virus-free ICR-A lines; this was the finding for IFN-
γ, TNF-β, IL-1β and IL-6.
We postulate that one potential cause of different mor-
phological appearance and proliferation rates in the cell
lines derived from the 3 mouse strains is their different
expression levels of MuLV. The viral expression level could
affect control mechanisms in cells and their metabolic
activity. Subsequently, the different metabolism may
affect morphological appearance and cell proliferation
rates [29]. It is, of course, possible that other factors dur-
ing the development of the cell lines affect their morphol-
ogy and physiological characteristics.
The expression of MuLV with regard to the virus messen-
ger RNA and CAgag protein was highest in the P8A cell
lines and absent from ICR-A cell lines. Expression in R1A
cell lines was significantly less than in P8A lines. These
data correlate with the findings in SAMR1 and SAMP8
brains in which the latter reveal high expression com-
pared with the low level or absent expression seen in R1
brains.
Electron microscopy showed particles budding from
plasma membranes of both P8A and R1A. These particles
were similar in appearance although there was a small dif-
ference in size. There were, however, significantly higher
numbers seen in P8A cultures than in R1A cultures; these
findings correlated with the levels of released CAgag in the
P8A vs. R1A cell lines. Despite the observation of virus
particles in R1A cultures, there was no infectivity present
(nor was there in ICR-A cultures), however, high levels of
MuLV infectivity were found in P8A cultures. In order to
determine why there was no infectivity in R1A cultures
despite the presence of virus particles, an assessment of
the protein sequences of the envelope proteins of virus
produced in R1A and P8A cultures would be of interest.
A comparison of expression levels between cell cultures
and brain homogenates reveals a number of unexpected
findings. It is clear that expression levels in the trans-
formed SAMP8 cell cultures are higher than those found
in SAMP8 brain. As examples, CAgag in cell lysates (Fig. 5)
are higher than in SAMP8 brain; also, the expression of
MuLV RNA in SAMP8 cell lines is significantly greater than
in SAMP8 brain (Fig. 4). There are a number of possible
explanations for this result: the cell cultures are composed
of a single cell type; these cells have been transformed and
probably have an altered level of expression of various
macromolecules compared to normal brain cells in vivo.
Furthermore, cultured cells are harvested at a specific time
after subculturing so that the cells proceed in their cell
cycles at a comparable rate. In contrast, the brain is com-
posed of a variety of cell types which are not transformed
and are at various stages of replication or are quiescent.
Also, although all assayed samples contain similar levels
of housekeeping RNA (Fig. 4) and protein (Fig. 5), the
brain contains macromolecules such as myelin, which
would be inert with regard to retrovirus replication. The
above differences reduce the value of comparisons
between expressions in brain homogenate vs. cell culture
lysates.
SAMR1 mice do not contain the Emv11 provirus that
codes for the Akv1 virus present in AKR and SAMP8 mice.
In the current study, no expression of Akv1-specific RNA
was seen in brains of SAMR1 mice, however, there was
low level of expression in the R1A cell lines. The explana-
tion for this finding is not clear. We do know that there are
non-Emv11 proviruses in SAMR1 mice and some of these
yield low levels of infectious MuLV [2,10]. The transfor-
mation process might augment the expression of these
SAMR1 endogenous retroviruses which may share primer
sequences with the primers used in our PCR experiments.
A major consideration in this study was the role of MuLV-
expressing astroglial cells in the killing of neurons. Several
neurodegenerative changes in Alzheimer's disease (AD),
Parkinson's disease (PD), HIV-associated dementia
(HAD), and prion diseases are explained by generation of
neurotoxins, mainly inducible nitric oxide (iNOS) from
glial cells [30,31]. Astroglial cells in healthy brain do not
express iNOS however iNOS is induced in both mice and
humans following viral infections [31]. Many proinflam-
matory cytokines associated with the innate immune sys-
tem induce iNOS expression in astroglial and microglial
cells. IL-1β and IFN-γ can each induce iNOS in glial cells.
Other cytokines such as TNF-α/β usually induce iNOS in
conjunction with IL-1β or IFN-γ [32,33]. The failure to
observe iNOS induction in SAMP8 mice is surprising but
Retrovirology 2008, 5:104 />Page 17 of 18
(page number not for citation purposes)
is probably related to the variation seen in cytokines that
induce iNOS in different cell types and culture conditions
[31]. The fact that we did not observe expression of iNOS
in P8 indicates that induction of neurodegeneration in
this strain is accomplished via an alternate pathway. It is
possible that the physiological changes seen in P8A cell
lines are a function of the level of expression of either
TNF-α and/or IL-1α in that these are the cytokines in P8A
that differ significantly from levels found in both R1A and
ICR-A cell lines.
The fact that P8A astrocyte cultures express high levels of
MuLV antigen and infectivity is significant in that there is
strong astrocytic activation in the proximity of CAgag-pos-
itive neurons in SAMP8 mice [11]. The caveat concerning
this point is that the cell cultures are transformed, whereas
the in situ astrocytes are normal. However, if astrocytes in
brains of SAMP8 mice can express MuLV antigen and
infectivity, questions arise concerning the role of these
astrocytes in the pathology and clinical changes seen in
SAMP8 mice. The use of the SAMP-SAMR model system
has recently been applied to analysis of the pathogenesis
and treatment of neurodegenerative diseases [34,35] and
could prove useful in analysis of the relationship between
virus presence and various genetic factors that lead to dis-
eases such as Alzheimer's disease [36].
In future studies, we will examine neuronal cell cultures
derived from SAMR1, SAMP8 and ICR strains. The results
obtained with these neuronal cell lines will be compared
to the findings with the astrocyte cell lines from these
mouse strains.
Competing interests
The authors declare that they have no competing interests.
Authors' contributions
BHK performed the RNA manipulation, RT-PCR, cell cul-
ture, immunocytochemistry, and Western blot analysis.
HCM performed the viral plaque assay. HYS performed
the electronic microscopy. RIC provided the animals. BHJ
directed RT-PCR. EKC, RIC and YSK directed the whole
experiments and manuscript. All authors read and
approved the final manuscript.
Acknowledgements
We would like to thank Dr Takashi Onodera (Tokyo University, Japan) for
providing the βSV40 viral vector. This work was supported by the MRC
program of MOST/KOSEF (R13-2005-022-02001-0(2008)).
References
1. Takeda T, Hosokawa M, Higuchi K: Senescence-accelerated
mouse (SAM): A novel murine model of scenescence. Exp
Gerontol 1997, 32:105-109.
2. Carp RI, Meeker HC, Chung R, Kozak CA, Hosokawa M, Fujisawa H:
Murine leukemia virus in organs of senescence-prone and -
resistant mouse strains. Mech Ageing Dev 2002, 123:575-584.
3. Takeda T, Hosokawa M, Higuchi K: Senescence-accelerated
mouse (SAM): A novel murine model of accelerated senes-
cence. J Am Geriatr Soc 1991, 39(9):911-919.
4. Takeda T, Hosokawa M, Higuchi K: Senescence Accelerated
Mouse (SAM). A novel murine model of aging. In Arch Gerontol
Geriatr Volume 19. Issue 2 Edited by: Takeda T. Amsterdam: Elsevier;
1994:185-192.
5. Flood JF, Morley JE: Studies on genetic aspects of impaired
learning and memory in SAMP8 mice. In The SAM Model of
Senescence Edited by: Takeda T. Amsterdam: Elsevier; 1994:405-408.
6. Flood JF, Morley PMK, Morley JE: Age-related changes in learn-
ing, memory, and lipofuscin as a function of the percentage
of SAMP8 genes. Physiol Behav 1995, 58:819-822.
7. Yagi H, Irino M, Matsushita T, Katoh S, Umezawa M, Tsuboyama T,
Hosokawa M, Akiguchi I, Tokunaga R, Takeda T: Spontaneous
spongy degeneration of the brain stem in SAM-P8 mice, a
newly developed memory-deficient strain. J Neuropathol Exp
Neurol 1989, 48:577-590.
8. Dewannieux M, Harper F, Richaud A, Letzelter C, Ribet D, Pierron G,
Heidmann T: Identification of an infectious progenitor for the
multiple-copy HERV-K human endogenous retroelements.
Genome Res 2007, 16:1548-1556.
9. Lowry DR, Chattopadhyay SK, Teich NM, Rowe WP, Levine AS:
AKR murine leukemia virus genome: Frequency of
sequences in DNA of high, low and non-virus-yielding mouse
strains. Proc Natl Acad Sci USA 1974, 71:3555-3559.
10. Meeker HC, Carp RI: Titers of murine leukemia virus are
higher in brains of SAMP8 than SAMR1 mice. Neurobiol Aging
1997, 18:543-547.
11. Jeong BH, Jin JK, Choi EK, Lee EY, Meeker HC, Kozak CA, Carp RI,
Kim YS: Analysis of the expression of endogenous murine
leukemia viruses in the brains of senescence-accelerated
mice (SAMP8) and relationship between expression and
brain histopathology. J Neuropathol Exp Neurol 2002,
61:1001-1012.
12. Haydon PG: Glia: listening and talking to the synapse. Nat Rev
Neuroscience 2001, 2:185-193.
13. Grosche J, Matyash V, Moller T, Verkhratsky A, Reichenbach A, Ket-
tenmann H: Microdomains for neuron-glia interaction: parallel
fiber signaling to Bergmann glial cells. Nat Neurosci 1999,
2:139-143.
14. Ventura R, Harris KM: Three-dimensional relationships
between hippocampal synapses and astrocytes. J Neurosci
1999, 19:6897-6906.
15. Dubois-Dalcq M, Rentier B, Hooghe-Peters E, Haspel MV, Knobler
RL, Holmes K: Acute and persistent viral infections of differen-
tiated nerve cells. Rev Infect Dis 1982, 4:999-1014.
16. Kim BH, KIM JI, Choi EK, Carp RI, Kim YS: A neuronal cell line
that does not express either prion or doppel proteins. Neu-
roReport 2005, 16:425-429.
17. Marriott DR, Hirst WD, Ljungberg MC: CNS glia and non-neural
cells: Astrocytes. In Neural Cell Culture Edited by: Cohen J, Wilkin
GP. New York: Oxford University Press; 1995:85-96.
18. Kuwahara C, Takeuchi AM, Nishimura T, Haraguchi K, Kubosaki A,
Matsumoto Y, Yokoyama T, Itohara S, Onodera T: Prions prevents
neuronal cell-line death. Nature 1999, 400:225-226.
19. Lee KH, Jeong BH, Jin JK, Meeker HC, Kim JI, Carp RI, Kim YS:
Scrapie infection activates the replication of ecotropic,
xenotropic, and polytropic murine leukemia virus (MuLV) in
brains and spinal cords of senescence-accelerated mice:
Implication of MuLV in progression of scrapie pathogenesis.
Biochem Biophys Res Commun 2006, 349:122-130.
20. Kossodo SD, Grau GE: Profiles of cytokine production in rela-
tion with susceptibility to cerebral malaria. J Immunol 1993,
151:4811-4820.
21. Cantin EM, Hinton DR, Chen J, Openshaw H: Gamma interferon
expression during acute and latent nervous system infection
by herpes simplex virus type 1. J Virol 1995, 69:
4898-4905.
22. Kim JI, Ju WK, Choi JH, Kim J, Choi EK, Carp RI, Wisniewski HM, Kim
YS: Expression of cytokine genes and increased nuclear fac-
tor-kappa B activity in the brains of scrapie-infected mice.
Brain Res Mol Brain Res 1999, 73:17-27.
23. Carp RI, Meeker HC, Kozlowski P, Sersen EA: An endogenous ret-
rovirus and exogenous scrapie in a mouse model of aging.
Trends Microbiol 2000, 8:39-42.
Publish with Bio Med Central and every
scientist can read your work free of charge
"BioMed Central will be the most significant development for
disseminating the results of biomedical research in our lifetime."
Sir Paul Nurse, Cancer Research UK
Your research papers will be:
available free of charge to the entire biomedical community
peer reviewed and published immediately upon acceptance
cited in PubMed and archived on PubMed Central
yours — you keep the copyright
Submit your manuscript here:
/>BioMedcentral
Retrovirology 2008, 5:104 />Page 18 of 18
(page number not for citation purposes)
24. Antony JM, Ellestad KK, Hammond R, Imaizumi K, Mallet F, Warren
KG, Power C: The human endogenous retrovirus envelope
glycoprotein, syncytin-1, regulates neuroinflammation and
its receptor expression in multiple sclerosis: a role for endo-
plasmic reticulum chaperones in astrocytes. J Immunol 2007,
179:1210-1224.
25. Rasmussen HB, Geny C, Defroges L, Perron H, Tourtelotte W, Hel-
tberg A, Clausen J: Expression of endogenous retroviruses in
blood mononuclear cells and brain tissue from multiple scle-
rosis patients. Mult Scler 1995, 1:82-87.
26. Kim H, Crow TJ: Identification and phylogeny of novel human
endogenous retroviral sequences belonging to the HERV-W
family on the human X chromosome. Arch Virol 1999,
144:2403-2413.
27. Weiss RA: The discovery of endogenous retroviruses. Retrovi-
rology 2006, 3:67-77.
28. Flood JF, Morley JE: Early onset of age-related impairment of
aversive and appetitive learning in the SAM-P/8 mouse. J Ger-
ontol 1992, 47:B52-B59.
29. Tabernero A, Medina JM, Giaume C: Glucose metabolism and
proliferation in glia: role of astrocytic gap junctions. J Neuro-
chem 2006, 99:1049-1061.
30. Ju WK, Park KJ, Choi EK, Kim J, Carp RI, Wisniewski HM, Kim YS:
Expression of inducible nitric oxide synthase in the brains of
scrapie-infected mice. J Neurovirol 1998, 4(4):445-450.
31. Saha RN, Pahan K: Regulation of inducible nitric oxide synthase
gene in glial cells. Antioxid Redox Signal 2006, 8:929-947.
32. Hua LL, Zhao ML, Cosenza M, Kim MO, Huang H, Tanowitz HB, Bro-
snan CF, Lee SC: Role of mitogen-activated protein kinases in
inducible nitric oxide synthase and TNF alpha expression in
human fetal astrocytes. J Neuroimmunol 2002, 126:180-189.
33. Jana M, Anderson JA, Saha RN, Liu X, Pahan K: Regulation of induc-
ible nitric oxide synthase in proinflammatory cytokine-stim-
ulated human primary astrocytes. Free Radic Biol Med 2005,
38:655-664.
34. Pelegrí C, Canudas AM, Del Valle J, Casadesus G, Smith MA, Camins
A, Pallàs M, Vilaplana J: Increased permeability of blood-brain
barrier on the hippocampus of a murine model of senes-
cence. Mech Ageing Dev 2007, 128:522-528.
35. Tajes M, Gutierrez-Cuesta J, Folch J, Ferrer I, Caballero B, Smith MA,
Casadesus G, Camins A, Pallàs M: Lithium treatment decreases
activities of tau kinases in a murine model of senescence. J
Neuropathol Exp Neurol 2008, 67:612-623.
36. Urosevic N, Martins RN: Infection and Alzheimer's disease: The
APOEå4 connection and lipid metabolism. J Alzheimers Dis
2008, 13:421-435.