Báo cáo y học: "APOBEC3G induces a hypermutation gradient: purifying selection at multiple steps during HIV-1 replication results in levels of G-to-A mutations that are high in DNA, intermediate in cellular viral RNA, and low in virion RNA" pps
Bạn đang xem bản rút gọn của tài liệu. Xem và tải ngay bản đầy đủ của tài liệu tại đây (396.88 KB, 15 trang )
BioMed Central
Page 1 of 15
(page number not for citation purposes)
Retrovirology
Open Access
Research
APOBEC3G induces a hypermutation gradient: purifying selection
at multiple steps during HIV-1 replication results in levels of G-to-A
mutations that are high in DNA, intermediate in cellular viral RNA,
and low in virion RNA
Rebecca A Russell
1
, Michael D Moore
2
, Wei-Shau Hu
2
and Vinay K Pathak*
1
Address:
1
Viral Mutation Section, HIV Drug Resistance Program, Center for Cancer Research, National Cancer Institute at Frederick, Frederick,
Maryland 21702, USA and
2
Viral Recombination Section, HIV Drug Resistance Program, Center for Cancer Research, National Cancer Institute at
Frederick, Frederick, Maryland 21702, USA
Email: Rebecca A Russell - ; Michael D Moore - ; Wei-Shau Hu - ;
Vinay K Pathak* -
* Corresponding author
Abstract
Background: Naturally occurring Vif variants that are unable to inhibit the host restriction factor
APOBEC3G (A3G) have been isolated from infected individuals. A3G can potentially induce G-to-
A hypermutation in these viruses, and hypermutation could contribute to genetic variation in HIV-
1 populations through recombination between hypermutant and wild-type genomes. Thus,
hypermutation could contribute to the generation of immune escape and drug resistant variants,
but the genetic contribution of hypermutation to the viral evolutionary potential is poorly
understood. In addition, the mechanisms by which these viruses persist in the host despite the
presence of A3G remain unknown.
Results: To address these questions, we generated a replication-competent HIV-1 Vif mutant in
which the A3G-binding residues of Vif, Y
40
RHHY
44
, were substituted with five alanines. As
expected, the mutant was severely defective in an A3G-expressing T cell line and exhibited a
significant delay in replication kinetics. Analysis of viral DNA showed the expected high level of G-
to-A hypermutation; however, we found substantially reduced levels of G-to-A hypermutation in
intracellular viral RNA (cRNA), and the levels of G-to-A mutations in virion RNA (vRNA) were
even further reduced. The frequencies of hypermutation in DNA, cRNA, and vRNA were 0.73%,
0.12%, and 0.05% of the nucleotides sequenced, indicating a gradient of hypermutation.
Additionally, genomes containing start codon mutations and early termination codons within gag
were isolated from the vRNA.
Conclusion: These results suggest that sublethal levels of hypermutation coupled with purifying
selection at multiple steps during the early phase of viral replication lead to the packaging of largely
unmutated genomes, providing a mechanism by which mutant Vif variants can persist in infected
individuals. The persistence of genomes containing mutated gag genes despite this selection
pressure indicates that dual infection and complementation can result in the packaging of
hypermutated genomes which, through recombination with wild-type genomes, could increase viral
genetic variation and contribute to evolution.
Published: 13 February 2009
Retrovirology 2009, 6:16 doi:10.1186/1742-4690-6-16
Received: 23 December 2008
Accepted: 13 February 2009
This article is available from: />© 2009 Russell et al; licensee BioMed Central Ltd.
This is an Open Access article distributed under the terms of the Creative Commons Attribution License ( />),
which permits unrestricted use, distribution, and reproduction in any medium, provided the original work is properly cited.
Retrovirology 2009, 6:16 />Page 2 of 15
(page number not for citation purposes)
Background
The APOBEC3 proteins APOBEC3G (A3G) and
APOBEC3F (A3F) are potent inhibitors of Vif-deficient
HIV-1 [1-5]. However, in the presence of HIV-1 Vif the
A3G and A3F proteins are targeted for proteasomal degra-
dation, thereby protecting the progeny virions from their
antiviral effects [6-11]. The importance of the Vif-
APOBEC3 interaction in protecting HIV-1 therefore
makes it a very attractive target for antiviral therapy devel-
opment, as inhibiting the interaction would allow these
host restriction factors to inhibit HIV-1 replication. To fur-
ther elucidate the structural determinants of the Vif-
APOBEC3 interaction, we and others have identified the
domains of Vif that are involved in binding to A3G and
A3F [12-17]. Furthermore, as a proof of principle, work by
Mehle et al. has shown that Vif peptides overlapping the
A3G-binding domain were able to inhibit the Vif-A3G
interaction [13].
The mechanisms of action of the APOBEC3 proteins on
Vif-deficient HIV-1 have been the focus of a number of
studies [2,18-26] and recently reviewed in [27]. However,
the effect of extensive G-to-A hypermutation on the ongo-
ing replication of HIV-1 has not been studied in depth.
Recently, Mulder et al. have shown that a replication-com-
petent virus containing mutations in Vif residues involved
in interactions with A3G displayed reduced fitness in
PBMC cultures; furthermore, viral DNA in these cells con-
tained extensive G-to-A hypermutation indicative of A3G-
induced cytidine deamination [14]. In addition, among
these viral clones drug-resistant variants existed that could
be rescued through recombination with wild type (WT)
HIV-1 following dual infection.
The mechanisms by which mutant Vif HIV-1 clones are
able to maintain replication despite continued inhibition
by A3G are poorly understood. To elucidate these mecha-
nisms, we studied the growth kinetics of replication-com-
petent HIV-1 containing the YRHHY > A5 Vif mutation in
permissive CEM-SS cells and non-permissive CEM cells.
We have previously shown that the YRHHY > A5 mutation
renders Vif unable to efficiently bind to and inhibit A3G
[15] thereby allowing us to examine the effects of A3G on
replication-competent HIV-1 replication. Unlike previous
work studying the presence of G-to-A hypermutation, we
examined both the cellular viral and virion RNA as well as
the viral DNA. The results showed that the frequency of
hypermutation was highest in viral DNA, reduced in cel-
lular viral RNA (cRNA), and lowest in virion RNA (vRNA),
indicating a gradient of hypermutation. We surmise that
purifying selection at multiple steps during viral replica-
tion results in the generation of this hypermutation gradi-
ent. As a consequence, viral RNAs that are unmutated or
only slightly mutated are packaged in virions for the next
round of infection. These observations provide an expla-
nation for the persistence of Vif mutants defective in A3G
inhibition in HIV-1 infected individuals, such as those
previously reported by Simon et al [16]. We also observed
complementation between replication-competent virus
and virus containing stop codons in Gag, providing addi-
tional evidence that hypermutant genomes could contrib-
ute to viral variation through recombination with wild-
type viral genomes [14].
Results
Virus containing the YRHHY > A5 mutation is inhibited in
the presence of A3G and D128K-A3G but not A3F
Our previous studies showed that a Vif mutant (YRHHY >
A5), in which the Y
40
RHHY
44
residues were substituted
with five alanines, was unable to block the antiviral activ-
ity of A3G but was fully effective in blocking the antiviral
activity of A3F [15]. To assess the effects of this Vif mutant
in a multiple cycle system the YRHHY > A5 mutation was
introduced into a replication-competent virus (HIV-
YRHHY > A5). To confirm that HIV-YRHHY > A5 showed
the expected phenotype, the mutant and HIV WT were
first tested in a transient transfection system in the pres-
ence of A3G, A3F, and the D128K-A3G mutant which is
resistant to HIV-1 Vif-induced degradation [15,28-31]. As
expected, HIV WT was resistant to A3G and A3F but not
D128K-A3G, since WT Vif can inhibit both A3G and A3F
but not D128K-A3G (Fig. 1). In agreement with our previ-
ously published data [15], the HIV-YRHHY > A5 mutant
virus was inhibited by A3G and D128K-A3G but not A3F.
HIV-YRHHY > A5 is delayed in CEM cells but not CEM-SS
cells
Next, we compared the replication characteristics of HIV-
YRHHY > A5 and HIV WT in a multiple cycle assay in per-
missive CEM-SS cells and non-permissive CEM cells. We
also used as a control, NL4-3ΔVif, which contains two
stop codons resulting in the production of a truncated
protein consisting of only the first 29 amino acids of Vif.
To verify that the CEM cells expressed A3G and the CEM-
SS cells did not, we performed western blot analysis (Fig.
2A). The results showed that the A3G protein was detect-
able in CEM cell lysates but not CEM-SS cells; neither the
CEM nor the CEM-SS cells expressed detectable levels of
A3F.
Fig. 2B shows an outline of the infection protocol used.
The Round 1 input virus was produced in 293T cells and
each infection was carried out with 1000 RT units of each
virus and 1 × 10
6
CEM or CEM-SS cells. As the results in
Fig. 2C show, in the permissive CEM-SS cells the RT values
of HIV WT, NL4-3ΔVif (two independent infections), and
HIV-YRHHY > A5 (three independent infections; curves
labeled YA, YB, and YC) all peaked between days 9 and 11
and then declined, concomitant with increasing cell
death. These results indicated that in the absence of A3G,
Retrovirology 2009, 6:16 />Page 3 of 15
(page number not for citation purposes)
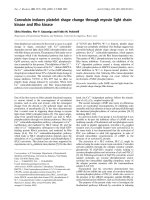
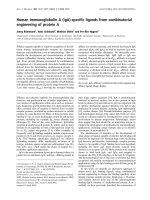
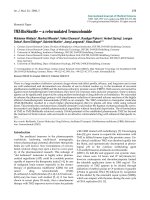
Mutation of the YRHHY domain of Vif in the context of replication-competent HIV-1 results in loss of Vif function against A3G but not A3FFigure 1
Mutation of the YRHHY domain of Vif in the context of replication-competent HIV-1 results in loss of Vif func-
tion against A3G but not A3F. HIV WT and pHIV-YRHHY > A5, a replication competent HIV-1 containing the YRHHY >
A5 mutation, were transfected into 293T cells in the presence of A3G, A3F, or D128K-A3G (a Vif-resistant mutant of A3G).
The infectivity of the virus produced from the transfected cells, harvested after 48 hours, was determined by infection of TZM-
bl indicator cells and quantitation of the resulting luciferase enzyme activity. The data shown are plotted as the infectivity rela-
tive to that produced in the absence of any APOBEC3 proteins which was set to 100%, with standard deviation from two inde-
pendent experiments.
0
20
40
60
80
100
120
140
160
no APOBEC3
A3G
A3F
D128K-A3G
HIV-YRHHY>A5WT HIV
Relative Infectivity (%)
Retrovirology 2009, 6:16 />Page 4 of 15
(page number not for citation purposes)
Figure 2 (see legend on next page)
E
0
5000
10000
15000
20000
25000
30000
35000
40000
45000
3 5 7 9 11 13 15
WT
YA
YB
YC
ΔVif A
ΔVif B
Counts/minute
Days post infection
CEM-SS
C
D
Days post infection
0
5000
10000
15000
20000
25000
30000
35000
40000
45000
357911131517
Counts/minute
CEM Round 1
YB
YA and YC
WT A
WT B
YA
YB
YC
YD
YE
YF
YG
YH
YI
YJ
ΔVif A
ΔVif B
0
5000
10000
15000
20000
25000
30000
35000
40000
45000
5 7 9 11 13 15 17 19 21 23 25 27
Counts/minute
CEM Round 2
YB
YA and YC
WT P2
YA P 2
YB P 2
YC P 2
Days post infection
F
0
5000
10000
15000
20000
25000
30000
35000
40000
45000
4 6 8 1012141618202225272932
WT P3
YA P 3
YB P 3
YC P 3
CEM Round 3
Counts/minute
Days post infection
YB
YC
YA
B
WT, ΔVif, or YRHHY>A5 DNA
Transfect
293T cells
Harvest virus
Determine RT activity
Infect with 1000 RT units
CEM cells (Round 1)
CEM cells (Round 2)
CEM cells (Round 3)
Determine RT activity
at each time point
Determine RT activity
at each time point
Determine RT activity
at each time point
Infect with 1000 RT units
from peak time point
Determine infectivity on TZM-bl
cells from peak time point
Infect with equal infectious units
Determine infectivity on TZM-bl
cells from peak time point
Analyze DNA
Analyze DNA,
cRNA, vRNA
Analyze DNA,
cRNA, vRNA
A
A3G in 293T cells
A3F in 293T cells
CEM cell lysate
CEM-SS cell lysate
A3G
A3F
a -tubulin
Retrovirology 2009, 6:16 />Page 5 of 15
(page number not for citation purposes)
HIV WT, HIV-YRHHY > A5, and NL4-3ΔVif exhibited sim-
ilar replication kinetics in a spreading infection.
Next, we compared the replication kinetics of HIV WT,
HIV-YRHHY > A5, and NL4-3ΔVif in the non-permissive
CEM cells (Fig. 2D). HIV WT replication, as determined by
RT activity, peaked at day 7 (two independent infections,
labeled WT A and WT B) whereas the NL4-3ΔVif replica-
tion did not reach above background levels for the dura-
tion of the experiment (15 days; two independent
infections, labeled as ΔVifA and ΔVifB); this observation
indicated that in the absence of Vif, HIV-1 cannot grow in
the presence of A3G. For the HIV-YRHHY > A5 mutant,
ten independent infections were carried out (labeled YA
through YJ); as the results in Fig. 2D show, HIV-YRHHY >
A5 mutant replication peaked between days 11 and 15,
indicating a 4 to 8 day delay compared to HIV WT. These
results indicated that in the presence of the YRHHY > A5
mutation, which results in suboptimal Vif function, the
A3G expressed in CEM cells is able to significantly delay
the kinetics of HIV-1 replication. We also noted that the
HIV-YRHHY > A5 viruses replicated with delayed kinetics
while the NL4-3ΔVif viruses completely failed to replicate.
We therefore hypothesized that the HIV-YRHHY > A5
mutant possessed a low level of Vif activity that allowed
some viruses to escape the inhibitory effects of A3G,
resulting in continued replication, albeit with delayed
kinetics.
No evidence of adaptive mutations in HIV-YRHHY > A5
virus passaged in CEM cells
To determine whether the HIV-YRHHY > A5 virus that
replicated in CEM cells contained adaptive mutations that
allowed it to inhibit A3G and thus grow in the non-per-
missive cells, 1000 RT unit aliquots of the HIV-YRHHY >
A5 viruses from the days of peak RT for samples YA (day
13), YB (day 11), and YC (day 13) were added to fresh
CEM cells (Round 2); these three samples were selected at
random as they appeared to be representative of the 10
cultures that were analyzed in Fig. 2D. As the results in Fig.
2E show, the HIV-YRHHY > A5 viruses in Round 2 were
further delayed, with the HIV WT (WT P2) peaking at day
7 and the mutant viruses (YA P2, YB P2, and YC P2) peak-
ing 14 to 16 days later between days 21 and 23; the
increased delay in the replication kinetics indicated that
the viruses from Round 1 had not acquired any escape
mutations.
We hypothesized that the increased delay seen between
Rounds 1 and 2 may have been due to the fact that the RT
units did not accurately reflect the level of infectious HIV-
YRHHY > A5 virus present in the Round 1 peak. To test
this hypothesis, 100 μl of the virus from the days of peak
RT at Round 1 was added to TZM-bl cells and the level of
luciferase expression measured 24 hours later. To detect
luciferase expression in this system, the incoming virus
must be capable of cell entry, reverse transcription, inte-
gration, and Tat expression, thus making it a more accu-
rate reflection of infectious virus levels than the RT assay.
As the results in Table 1 show, the HIV-YRHHY > A5
viruses taken from the peak RT values of Round 1 were
between 7- and 8.6-fold less infectious than the HIV WT
taken from the peak RT at day 7, possibly explaining the
increased delay seen between Rounds 1 and 2. Based on
this observation, the viruses from the days of peak RT of
Round 2 were also analyzed on TZM-bl cells and, as the
results in Table 1 show, equivalent volumes of the HIV-
YRHHY > A5 viruses were 9.5- to 21.7-fold less infectious
than the HIV WT virus. This difference was taken into con-
sideration when setting up Round 3 infections, and equiv-
alent amounts of infectious viruses, as quantified using
the TZM-bl cells line, were added to fresh CEM cells. Sur-
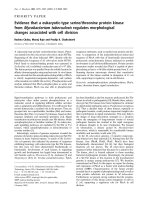
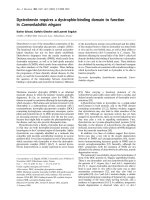
Delayed growth kinetics displayed by HIV-YRHHY > A5 in non-permissive cells but not in permissive cellsFigure 2 (see previous page)
Delayed growth kinetics displayed by HIV-YRHHY > A5 in non-permissive cells but not in permissive cells. (A)
Expression levels of A3G in CEM and CEM-SS cells. To confirm that the non-permissive CEM cells expressed A3G and the per-
missive CEM-SS cells did not, cell lysates were analyzed by western blotting for expression of both A3G and A3F. Expression of
α-tubulin in the cell lysates was also analyzed to control for the amount of cell lysate examined. As positive controls 293T cell
lysates transfected with FLAG-tagged A3G and A3F were also analyzed. (B) Schematic representation of the virus-passage pro-
tocol used. The different steps carried out at each round of infection are shown. (C) Virus growth in permissive CEM-SS cells.
To determine the growth kinetics of HIV-YRHHY > A5 in permissive CEM-SS cells, 1000 RT units were added to 1 × 10
6
CEM-
SS cells and the virus and cells were cultured at 37°C. At various time points virus-containing supernatant was removed and
the RT levels were determined. As controls, HIV WT and NL4-3ΔVif were also included. The results are plotted as the scintil-
lation counts/minute measured at each time point for 3 independent infections of HIV-YRHHY > A5 and two independent
infections of HIV WT and NL4-3ΔVif. (D) Virus growth in Round 1 infection of non-permissive CEM cells. The experiment was
carried out as described in FIG. 1C legend except that 10 independent infections were used for HIV-YRHHY > A5. (E) Virus
growth in Round 2 infections of non-permissive CEM cells. Virus from the peak of infection of HIV-YRHHY > A5 Round 1 sam-
ples YA, YB, and YC and HIV WT was added to fresh CEM cells and passaged as described in Fig. 2C legend. (F) Virus growth
in Round 3 infections of non-permissive CEM cells. Virus from the peak of infection of HIV-YRHHY > A5 Round 2 samples YA,
YB and YC and HIV WT A was added to fresh CEM cells and passaged as described in FIG. 2C legend.
Retrovirology 2009, 6:16 />Page 6 of 15
(page number not for citation purposes)
prisingly, the HIV-YRHHY > A5 viruses were delayed as
much in Round 3 as they were in Round 2 with HIV WT
peaking at day 8 and the HIV-YRHHY > A5 viruses peak-
ing between days 18 and 25 (Fig. 2F). Furthermore, anal-
ysis of the Round 3 mutant viruses on TZM-bl cells
showed a further drop in infectivity from 19.1- to 106.4-
fold compared to HIV WT (see Table 1). The fact that the
viruses from Round 2 were still delayed when added to
fresh CEM cells in Round 3 further confirmed that escape
mutations were not the cause of the observed virus
growth.
HIV-YRHHY > A5 viral DNA, cRNA, and vRNA exhibit a
gradient of hypermutation after replication in CEM cells
The observation that the HIV-YRHHY > A5 virus that rep-
licated with delayed kinetics was still delayed when added
to fresh CEM cells at equivalent levels of infectious units,
suggested the absence of adaptive mutations. Further-
more, sequence analysis of vif from individual clones of
Rounds 1, 2, and 3 did not show any consensus mutations
indicative of escape mutants (data not shown). We
hypothesized that because the YRHHY > A5 mutant pos-
sessed a low level of Vif activity, this allowed some viruses
to escape the inhibitory effects of A3G, resulting in contin-
ued replication with delayed kinetics. To test this hypoth-
esis, we first sequenced viral DNA from Rounds 2 and 3 to
determine whether any of the proviruses lacked G-to-A
hypermutation indicative of A3G-mediated inhibition.
Cellular DNAs were extracted, a 730-bp region spanning
the vif gene and a portion of the vpr gene was amplified,
cloned, and individual clones were sequenced. The results
in Fig. 3A and 3B show a representative set of sequences
obtained from Rounds 2 and 3, respectively, with the hor-
izontal lines depicting individual clones and the vertical
lines indicating G-to-A mutations; red vertical lines repre-
sent G-to-A mutations that would result in either a loss of
expression due to mutation of the start codon or a trun-
cated protein due to the formation of an early termination
codon. In addition to the G-to-A mutations, the viral
DNAs also had other mutations at a frequency that was
11.4-fold lower than the G-to-A mutations (0.06% per
nucleotide sequenced; data not shown). The mutation fre-
quency of non G-to-A changes was not altered between
HIV WT and HIV-RHHY > A5. The results showed that
most viral DNAs had extensive G-to-A hypermutation; 69
and 70 viral DNAs were sequenced from Rounds 2 and 3,
respectively; the G-to-A mutation frequencies for Round 2
and 3 were 0.44% and 1.02% per nucleotide sequenced,
respectively. In agreement with previously published data,
the G-to-A mutations predominantly occurred in GG
dinucleotides, in which the 5' G was mutated to A (Table
2) [19,32-35]. For the 139 viral DNA clones sequenced,
the overall G-to-A mutation frequency was 0.70% per
nucleotide sequenced. The mutation frequency in viral
DNAs from Rounds 2 and 3 was significantly higher than
the 0.02% mutation frequency (4 mutations in 23
sequences) observed in viral DNAs analyzed from HIV WT
infections (P < 10
-6
). An average of 5.12 G-to-A mutations
were observed per 730 nucleotides of sequence from the
Vif/Vpr region analyzed. Assuming a Poisson distribution,
we expected only 0.5% of the 139 sequences analyzed to
have no G-to-A substitutions. However, we observed that
26 of the 139 (18%) sequences lacked any G-to-A muta-
tions. This analysis supported our hypothesis and sug-
gested that these viruses escaped A3G-mediated
inhibition.
Table 1: Infectivity of HIV WT and HIV-YRRHHY > A5 virus-containing supernatants from samples with peak RT activities.
Virus Round of Infection
a
Relative Infectivity
b
(%) ± S.D.
c
Fold Decrease in Infectivity
WT 1 100 ± 4.5 -
YA 1 11.6 ± 0.2 8.6
YB 1 13.6 ± 0.1 7.4
YC 1 14.2 ± 0.1 7.0
WT 2 100 ± 3.0 -
YA 2 10.6 ± 0.5 9.5
YB 2 7.3 ± 0.5 13.7
YC 2 4.6 ± 0.7 21.7
WT 3 100 ± 4.2 -
YA 3 0.9 ± 0.0 106.4
YB 3 5.2 ± 1.0 19.1
YC 3 2.2 ± 0.4 44.7
a
Peak time points analyzed are shown in Fig. 2.
b
The infectivity of equivalent volumes of cell supernatants was assessed using TZM-bl cells. Luciferase activities in infected cell lysates were
measured 24 hours after infection.
c
S.D., standard deviation.
Retrovirology 2009, 6:16 />Page 7 of 15
(page number not for citation purposes)
Our hypothesis predicted that only viral genomes that
had escaped A3G-mediated inhibition and hypermuta-
tion would be present in viral RNA. To test this hypothe-
sis, we isolated cRNAs and vRNAs and obtained sequences
of clones generated from cDNAs. Representative results
obtained from Rounds 2 and 3 for cRNA-derived cDNAs
are shown in Figs. 3C and 3D, respectively, and the results
for vRNA-derived cDNAs are shown in Figs. 3E and 3F,
respectively. The analysis showed that the frequency of
clones that did not have any G-to-A mutations was
increased from 18% to 57% in cRNAs; the frequency of
clones without any G-to-A mutations was further
increased to 77% in vRNAs. The overall frequency of G-to-
A mutations in cRNAs and vRNAs was reduced to 0.12%
and 0.05% for total nucleotides sequenced, respectively
(Fig. 3G). In agreement with previously published data,
the G-to-A mutations predominantly occurred in GG
dinucleotides, in which the 5' G was mutated to A (Table
2) [19,32-35]. The G-to-A mutation frequency of all the vif
and vpr sequence data obtained from the viral DNA,
cRNA, and vRNA from each infection (YA, YB and YC) at
Rounds 2 and 3 are shown in Fig. 3G and Table 3. A total
of 139 sequences from viral DNA (101,470 nucleotides),
108 sequences from cRNA (78,840 nucleotides), and 127
sequences from vRNA (92,710 nucleotides) were ana-
lyzed. The differences in the G-to-A mutation frequency
between viral DNA and cRNA were highly significant (P =
0.0038 and P = 0.0139 for Rounds 2 and 3, respectively;
Student's t-test). Similarly, the differences in the hypermu-
tation frequency between cRNA and vRNA were also
highly significant (P = 0.0074 and P = 0.0089 for Rounds
2 and 3, respectively). These observations establish that
there is a gradient of hypermutation, with the frequency of
G-to-A mutations being the highest in viral DNA, interme-
diate in cRNA, and lowest in vRNA.
We also determined the frequency of G-to-A mutations
present in vRNA obtained from HIV WT virus infections.
We found 22 G-to-A mutations in 74 sequences (54,020
nucleotides), providing a mutation frequency of 0.04%;
unlike the G-to-A mutations observed in the HIV-YRHHY
> A5 samples, the mutations did not predominantly occur
in the GG dinucleotide context (Table 2). The G-to-A
mutation frequency in Rounds 2 and 3 vRNAs obtained
from HIV-YRHHY > A5 (0.05%) was not significantly dif-
ferent from that observed for HIV WT vRNAs (P = 0.5535).
An in-depth analysis of the G-to-A mutations was per-
formed to analyze the impact of the mutations on vif and
vpr gene products (Fig. 3H and Table 4). A high propor-
tion of the viral DNA clones (60%) had G-to-A mutations
that resulted in the formation of early termination codons
or mutation of the start codon; the frequency of these
mutations that would result in the loss of a functional Vif
or Vpr protein was reduced to 22% and 10% in cRNA and
vRNA, respectively (P = 1.43 × 10
-5
and P = 2.97 × 10
-4
;
Student's t test). In contrast, the frequency of clones with
no G-to-A mutations was 18% in viral DNA, and
increased to 57% and 77% in cRNAs and vRNAs, respec-
tively. Although we do not expect the loss of Vif or Vpr
proteins to affect transcription of the viral DNA, it is likely
that some G-to-A mutations would result in the loss of the
viral transcriptional activator Tat protein, or that some G-
to-A mutations would occur in the viral promoter regions,
interfering with transcription. These observations strongly
suggest that purifying selection pressure results in provi-
ruses with no mutations (or those with fewer detrimental
G-to-A mutations) being transcribed into cellular RNA.
We considered two possible explanations for the reduc-
tion in G-to-A mutations observed in vRNA compared to
Table 2: Dinucleotide context of G-to-A mutations in Vif/Vpr and DIS/Gag regions.
Virus (Region sequenced) Dinucleotide context of G-to-A Mutations
GG
a
(%) GA (%) GC (%) GT (%) Total
WT (Vif/Vpr)
DNA 1 (25%) 3 (75%) 0 0 4
Cellular viral RNA 0 0 0 0 0
Virion RNA 7 (32%) 11 (50%) 1 (5%) 3 (14%) 22
HIV-YRHHY>A5 (Vif/Vpr)
DNA 620 (87%) 83 (12%) 6 (1%) 3 (0.4%) 712
Cellular viral RNA 81 (86%) 9 (10%) 3 (3.2%) 1 (1%) 94
Virion RNA 34 (69%) 10 (20%) 3 (6%) 2 (4%) 49
HIV-YRHHY>A5 (DIS/Gag)
DNA 54 (87%) 8 (13%) 0 0 62
Cellular viral RNA 74 (89%) 3 (4%) 3 (4%) 3 (4%) 83
Virion RNA 20 (74%) 4 (15%) 0 3 (11%) 27
a
The first G nucleotide in the GG dinucleotide is the target of G-to-A mutation.
Retrovirology 2009, 6:16 />Page 8 of 15
(page number not for citation purposes)
Figure 3 (see legend on next page)
H
0
20
40
60
80
100
120
DNA cRNA vRNA
Frequency of G to A mutation
types (%)
no mutations
other G to A mutations
total stop/start codon
mutations
Nucleotide position
DNA Round 2
A
vif vpr
Cellular viral RNA Round 2
Nucleotide position
0 200 400 600
1
2
3
4
5
6
7
8
9
10
11
12
13
14
15
16
17
18
19
20
21
C
vif vpr
Virion RNA Round 2
Nucleotide position
0 200 400 600
1
2
3
4
5
6
7
8
9
10
11
12
13
14
15
16
17
18
E
vif vpr
Nucleotide position
0
1
2
3
4
5
6
7
8
9
10
11
12
13
14
15
16
17
D
Cellular viral RNA Round 3
Nucleotide position
200 400 600
vif vpr
Nucleotide position
Virion RNA Round 3
0 200 400 600
1
2
3
4
5
6
7
8
9
10
11
12
13
14
15
16
17
F
vif vpr
0
0.2
0.4
0.6
0.8
1
1.2
1.4
1.6
Round 2 Round 3
G to A hypermutation
frequency (%)
DNA
cRNA
vRNA
G
**
**
**
**
0 200 400 600
1
2
3
4
5
6
7
8
9
10
11
12
13
14
15
16
17
18
19
20
21
22
23
24
25
26
DNA Round 3
0 200 400 600
1
2
3
4
5
6
7
8
9
10
11
12
13
14
15
16
17
18
B
vif vpr
Retrovirology 2009, 6:16 />Page 9 of 15
(page number not for citation purposes)
cRNA. Firstly, we hypothesized that G-to-A mutations in
the viral packaging sequence and/or dimer initiation site
(DIS) would prevent the packaging of extensively hyper-
mutated RNAs. However, analysis of the 5' untranslated
region did not reveal the presence of a high number of G-
to-A mutations in these regions; only 1 G-to-A mutation
was found in the DIS region and that was in the cRNA and
a total of 6 mutations were found in the packaging
sequence (2 in each of the DNA [2 out of 24], cRNA [2 out
of 116] and vRNA [2 out of 96]). Furthermore, there did
not appear to be a gradient of hypermutation between the
cellular and viral RNA suggesting that this area is not
under selection pressure, although the numbers of muta-
tions in this region are too small to draw definitive con-
clusions. Secondly, we hypothesized that inactivating
mutations in HIV-1 gag would result in the loss of func-
tional proteins that are essential for virus production. To
test these hypotheses, we carried out sequencing analysis
of the viral untranslated leader and the beginning of the
gag gene. Representative results obtained from viral
DNAs, cRNA, and vRNA from Round 2 are shown in Fig.
4A, B, and 4C, respectively. The frequencies of G-to-A
mutations are summarized in Fig. 4D and Table 3; 24
sequences (9,000 nucleotides) were analyzed from provi-
ral DNA, 116 sequences (43,500 nucleotides) were ana-
lyzed from cRNA, and 96 sequences (36,000 nucleotides)
were analyzed from vRNA. In agreement with the results
obtained with sequences acquired from the vif/vpr genes,
there was a gradient of G-to-A mutations, with the highest
G-to-A mutation frequencies in viral DNA (0.68%), inter-
mediate mutation frequencies in cRNA (0.19%), and the
lowest mutation frequencies in vRNA (0.08%). Further-
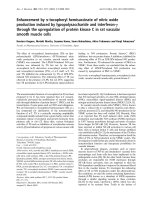
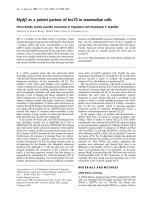
Gradient of A3G-induced hypermutation across proviral DNA, cellular viral RNA (cRNA), and virion RNA (vRNA) observed in the vif of HIV-YRHHY > A5Figure 3 (see previous page)
Gradient of A3G-induced hypermutation across proviral DNA, cellular viral RNA (cRNA), and virion RNA
(vRNA) observed in the vif of HIV-YRHHY > A5. (A and B) Schematic representation of a sample of proviral DNA
sequences of individual clones from Rounds 2 and 3. Genomic DNA was extracted from infected CEM cells at the peak of
infection (as determined by RT activity). A 730 bp region including the vif gene and a portion of the vpr gene was amplified,
cloned, and sequenced. Each horizontal line represents an individual clone. Each vertical line represents a G-to-A mutation.
Red vertical lines represent G-to-A mutations that would result in a loss of Vif production due to either mutation of the start
codon or insertion of a premature stop codon. Red vertical lines in the Vif/Vpr overlapping region are mutations that altered
the Vpr start codon or generated stop codons in the Vif or Vpr open reading frames. Some vertical lines appear to be thick
because two or more thin lines are very close to each other. (C and D) Schematic representation of a sample of cRNA
sequences of individual clones from Rounds 2 and 3. The layout is as described above except that each clone originates from
cRNA extracted from infected CEM cells at the peak of virus infection. (E and F) Schematic representation of a sample of
vRNA sequences of individual clones from Rounds 2 and 3. The layout is as described above except that each clone originates
from vRNA extracted from virus-containing supernatant at the peak of virus infection. (G) Graphical representation of the G-
to-A hypermutation frequency from each round of infection. The frequency of G-to-A hypermutation in the proviral DNA,
cRNA, and vRNA across each individual infection (YA, YB and YC) for Rounds 2 and 3 was determined. Statistical significance
was calculated using the t-test assuming equal variance with a one-tailed analysis. (H) Graphical representation of the type of
G-to-A mutations observed in each individual clone in the proviral DNA, the cRNA, and the vRNA. The sequences from
Rounds 2 and 3 were separated into 3 different groups – those that had G-to-A mutations that would destroy expression of
either Vif, Vpr, or both; those that had G-to-A mutations that did not destroy protein production and those that had no G-to-
A mutations within the region sequenced. For the proviral DNA 139 sequences were analyzed, for the cRNA 108 sequences
were analyzed, and for the vRNA 127 sequences were analyzed.
Table 3: Analysis of mutations in the Vif/Vpr and DIS/Gag regions.
Vif/Vpr Region DIS/Gag Region
HIV-1 WT HIV-YRHHY>A5 HIV-YRHHY>A5
G-to-A Mutations/
Total G nts
a
Other Mutations/
Total nts
b
G-to-A Mutations/Total
G nts
Other Mutations/
Total nts
G-to-A Mutations/
Total G nts
c
Other Mutations/
Total nts
d
DNA 4/3910 0/16,790 712/23,630 66/101,470 62/2856 14/9000
Cellular Viral RNA 0/2550 3/10,950 94/18,360 43/78,840 83/13,804 37/43,500
Virion RNA 22/12,580 14/54,020 49/21,590 82/92,710 27/11,424 15/36,000
a
Total G nucleotides (nts) in the Vif/Vpr region were 170 per sequence.
b
Total nucleotides in the Vif/Vpr region were 730 per sequence.
c
Total G nucleotides in the DIS/Gag region were 119 per sequence.
d
Total nucleotides in the DIS/Gag region were 375 per nucleotide.
Retrovirology 2009, 6:16 />Page 10 of 15
(page number not for citation purposes)
more, in agreement with previously published data, the
dinucleotide context of the G-to A-changes was predomi-
nantly GG (Table 2) [19,32-35].
A more detailed analysis of the G-to-A mutations is shown
in Fig. 4E and Table 4. The frequency of clones with no G-
to-A mutations was approximately 21% in viral DNAs,
which was increased to approximately 57% and 81% in
cRNAs and vRNAs, respectively. The differences in the G-
to-A mutation frequencies between viral DNA and cRNA
were significant (P = 0.004), as were differences between
cRNA and vRNA (P = 0.008). The frequency of G-to-A
mutations that inactivated the gag gene by generating pre-
mature stop codons or mutating the start codon was 71%
in the viral DNA, and was decreased to 22% and 6% in
cRNA and vRNA, respectively. These results indicated that
purifying selection pressure was operating against
genomes that had inactivating mutations in the gag gene.
The observation that a few of the viral RNA-derived
sequences had inactivating mutations in the gag gene
strongly indicated that these genomes were packaged by
co-infection of the virus producing cell with another virus
and complementation.
Discussion
To overcome the effects of the antiviral A3G protein, the
HIV-1 Vif protein binds to A3G and targets it for degrada-
tion using the cellular proteasomal degradation pathway
[6-11]. However, in some infected individuals, HIV-1 var-
iants with Vif mutations that inhibit the Vif-A3G interac-
tion have been identified [16]. In these individuals, it is
unclear how the Vif variants persist in the population
since they are expected to be inhibited by the A3G protein.
The work described here presents mechanisms by which
these Vif variants may survive in the population by show-
ing, for the first time, that a gradient of hypermutation
exists for the integrated proviral DNA, the cellular viral
RNA, and the virion RNA. Based on these observations, we
hypothesize that purifying selection is occurring at each
stage of virus production, including transcription, mRNA
stability, nuclear-cytoplasmic transport, translation, and
virion assembly. The integrated genomes with extensive
hypermutation may not be transcribed, possibly due to
mutations in the promoter regions or in the tat gene,
thereby preventing the extensively hypermutated
genomes from contributing to the gene pool of the viral
population. Mutations in the transcribed RNA may reduce
their stability and they may be degraded before they can
be translated; for example, the RNAs may be rapidly
degraded through a nonsense-mediated RNA decay mech-
anism due to the generation of premature stop codons
[36]. Additionally, in the absence of co-infection with a
wild-type virus, transcribed genomes encoding gag genes
with early termination codons or mutated start codons
will not be able to assemble virus particles, thereby allow-
ing only unmutated genomes or minimally mutated
genomes to both produce, and be packaged into, progeny
virions. Despite this purifying selection at multiple steps,
we were able to detect viral genomes containing stop
codons in gag; the presence of these genomes in vRNA
indicates dual infection and complementation of the gag
defect. Thus, hypermutated genomes can be packaged in
viral particles, and the G-to-A mutations could contribute
to viral variation through recombination. Recombination
allowing drug resistance mutations to jump from 'dead'
hypermutated genomes to WT HIV-1 has recently been
observed by Mulder et al [14]. The frequency of G-to-A
mutations in vRNAs derived from Vif-defective HIV-1 was
not significantly different from the vRNAs derived from
HIV WT even after 61 days in culture, suggesting that
hypermutation does not increase, or only moderately
increases, the overall mutation rate of the replicating viral
Table 4: Vif/Vpr and Gag sequences containing G-to-A mutations that resulted in Stop/Start codon mutations, other mutations, or no
mutations.
Sample Total Sequences with
Stop/Start Codon Mutations (%)
Total Sequences w/
Other Mutations (%)
Total Sequences w/
No Mutations (%)
Vif/Vpr
DNA
(Round 2 +3)
83 (59.7%) 30 (21.6%) 26 (18.2%)
Cellular Viral RNA
(Round 2+3)
24 (22.2%) 22 (20.4%) 62 (57.4%)
Virion RNA
(Round 2+3)
13 (10.2%) 16 (12.6%) 98 (77.2%)
Gag
DNA
(Round 2)
17 (70.8%) 2 (8.3%) 5 (20.8%)
Cellular Viral RNA
(Round 2)
26 (22.4%) 24 (20.7%) 66 (56.9%)
Virion RNA
(Round 2)
6 (6.3%) 12 (12.5%) 78 (81.3%)
Retrovirology 2009, 6:16 />Page 11 of 15
(page number not for citation purposes)
population. The strong purifying selection and the signif-
icantly reduced levels of G-to-A mutations in the vRNA
observed in this study reduces the probability of hyper-
mutation contributing to viral variation; however, the
extent to which hypermutated genomes, packaged by
complementation, undergo recombination with wild-
type genomes during the course of natural HIV-1 infec-
tion, is not known.
We observed that 18% of the viral DNAs did not have G-
to-A mutations in the 730 nucleotide Vif/Vpr region
sequenced. It is possible that these viral DNAs contained
mutations in the approximately 9000 nucleotides of their
genome that we did not sequence. It is also possible that
a proportion of the 18% of the viral DNAs without G-to-
A mutations did not package A3G, and as a result escaped
G-to-A hypermutation. We observed that the virions pro-
duced in Round 3 had an average infectivity of 2.76% of
wild-type virus, suggesting that a small proportion of the
virions either had no mutations or had few mutations that
did not prevent virus production, infection, and expres-
sion of the Tat protein. One possible mechanism to
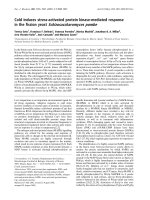
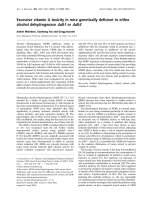
Gradient of A3G-induced hypermutation across proviral DNA, cellular viral RNA (cRNA), and virion RNA (vRNA) observed in the untranslated leader region (UTR) and the beginning of gag of HIV-YRHHY > A5Figure 4
Gradient of A3G-induced hypermutation across proviral DNA, cellular viral RNA (cRNA), and virion RNA
(vRNA) observed in the untranslated leader region (UTR) and the beginning of gag of HIV-YRHHY > A5. (A)
Schematic representation of a sample of proviral DNA sequences of individual clones from Round 2. (B) Schematic representa-
tion of a sample of cRNA sequences of individual clones from Round 2. (C) Schematic representation of a sample of vRNA
sequences of individual clones from Round 2. Samples were extracted as described in FIG. 3A–F legend. (D) Graphical repre-
sentation of the G-to-A hypermutation frequency from Round 2 of infection. The frequency of G-to-A hypermutation in the
proviral DNA, cRNA, and vRNA across each individual infection (YA, YB and YC) for Round 2 was determined and presented
as described in FIG. 3G legend. (E) Graphical representation of the type of G-to-A mutations observed in each individual clone
in the proviral DNA, the cRNA, and the vRNA. The analysis was carried out as described in FIG. 3H legend. For the proviral
DNA, 24 sequences were analyzed, for the cRNA 116 sequences were analyzed, and for the vRNA 96 sequences were ana-
lyzed.
0
20
40
60
80
100
120
DNA cRNA vRNA
E
Frequency of G to A mutation
types (%)
no mutations
other G to A mutations
total stop/start codon
mutations
0
50 100 150 200 250 300 350
1
2
3
4
5
6
7
8
9
10
11
12
13
14
15
16
17
18
19
20
21
22
23
24
Nucleotide position
DNA Round 2
A
UTR Gag
1
2
3
4
5
6
7
8
9
10
11
12
13
14
15
16
17
18
19
20
21
22
23
24
25
26
27
28
29
30
31
32
33
34
35
36
37
0 50 100 150 200 250 300 350
Cellular viral RNA Round 2
Nucleotide position
B
UTR Gag
1
2
3
4
5
6
7
8
9
10
11
12
13
14
15
16
17
18
19
20
21
22
23
24
25
26
27
28
29
30
31
32
0
50 100 150 200 250 300 350
Nucleotide position
Virion RNA Round 2
C
UTR Gag
0
0.1
0.2
0.3
0.4
0.5
0.6
0.7
0.8
0.9
DNA cRNA vRNA
D
G to A hypermutation
frequency (%)
**
*
Retrovirology 2009, 6:16 />Page 12 of 15
(page number not for citation purposes)
explain how these viruses retained their infectivity is the
low or absent levels of A3G expression in a subset of the
CEM cells, leading to production of virions that do not
contain A3G. Another possible mechanism is that a small
percentage of virions are produced from A3G-expressing
cells but did not package A3G and thereby escaped inhibi-
tion. We previously estimated that 7 ± 4 A3G molecules
are packaged in virions [37]; if we assume a Poisson dis-
tribution, we estimate that only 0.09% of the virions
would fail to package A3G. We have also observed that
A3G inhibits viral DNA synthesis and integration, and the
efficiency of integration in the presence of A3G is only
about 3% [24]. Thus, in the integrated viral DNA pool, the
frequency of non-mutated viral genomes would increase
from 0.09% to 3.0%. This predicted frequency of non-
mutated genomes is close to the 2.76% infectivity of the
Round 3 virions; however, additional experiments are
needed to verify the hypothesis that some virions retain
infectivity because they do not package A3G and therefore
are not subjected to hypermutation.
Interestingly, we were unable to detect the presence of any
Vif-based escape variants despite a total of up to 61 days
in culture. This observation does not exclude the possibil-
ity that mutations elsewhere in the genome compensated
for the defects in Vif, resulting in restoration of the repli-
cative capacity as recently observed by Hache et al [38].
However, the fact that the mutant Vif virus continued to
show delayed growth kinetics, and indeed was more
delayed with each round of replication, argues against the
presence of any escape variants in our experiments.
The observed reductions in the frequencies of G-to-A
mutations in the Vif/Vpr region could be the result of
either direct or indirect purifying selection. The reductions
in the frequencies of G-to-A mutations in the cRNAs are
most likely due to mutations elsewhere in the genome
that affect transcription, mRNA stability, and mRNA
transport. The purifying selection against these mutations
could indirectly reduce the frequency of mutations in the
Vif/Vpr region by selecting for viral genomes with lower
levels of hypermutation. On the other hand, the HIV-
YRHHY > A5 mutant possessed some Vif function since it
replicated with delayed kinetics while the NL4-3ΔVif
mutant failed to replicate. Thus, there could be direct puri-
fying selection against more deleterious mutations in Vif.
Finally, the observation that the HIV-YRHHY > A5 mutant
exhibited a significant delay in replication kinetics for
over two months, with no evidence of adaptive muta-
tions, suggests that the Vif-A3G interaction could be a
promising target for antiviral drug development.
Conclusion
These results show for the first time that HIV-1 genomes
that have been hypermutated by APOBEC3 proteins are
subjected to purifying selection at multiple steps during
viral replication, including transcription, mRNA stability,
mRNA transport, and virus production. As a result of this
purifying selection, a gradient of hypermutation exists,
with the viral DNAs containing the highest levels of muta-
tions, cellular viral RNAs containing intermediate levels of
mutations, and viral RNAs containing low levels of muta-
tions. The frequency of G-to-A mutations in vRNAs
derived from Vif-deficient HIV-1 was not significantly dif-
ferent from the vRNAs derived from HIV WT even after 61
days in culture, suggesting that hypermutation does not
increase, or only moderately increases, the overall muta-
tion rate of the replicating viral population.
Methods
Plasmid construction and cell culture
The YRHHY > A5 mutation that renders HIV-1 Vif unable
to efficiently bind to A3G was inserted into the replica-
tion-competent HIV-1 plasmid pNL4-3 [39] using over-
lapping PCR to generate pHIV-YRHHY > A5. The forward
primer VifF, 5'CAGGGAGATTCTAAAAG3', and the
reverse primer YRHHYmutR, 5'CTTATTTTTGGATTAGTAC
TTTCAGCGGCAGCTGCAGCAAACCAGTCCTTAGCTTTC
C3', were used to amplify the N-terminal region of Vif.
The C-terminal portion of Vif was amplified using the for-
ward primer YRHHYmutF, 5'GGAAAGCTAAGGACTGGT
TTGCTGCAGCTGCCGCTGAAAGTACTAATCCAAAAATA
AG3', and the reverse primer VifR, 5'GGATAAACAGCAGT
TGTTGC3'. The resulting amplicons were then combined
in a second round PCR using the primers VifF and VifR.
The final product was digested with AgeI plus EcoRI and
cloned into AgeI plus EcoRI digested pNL4-3, displacing
the WT Vif and replacing it with Vif containing the
YRHHY > A5 mutation to create pHIV-YRHHY > A5.
The modified human embryonic kidney cell line, 293T
[40] and the HeLa-derived HIV-1 reporter cell line, TZM-
bl [41,42], which encodes the firefly luciferase gene under
the control of the HIV-1 Tat-responsive promoter, were
maintained in complete medium (CM) which consisted
of Dulbecco's modified Eagle's medium (DMEM) supple-
mented with 10% fetal calf serum, 1% penicillin/strepto-
mycin, and 1% glutamine. The lymphoid cells CEM and
CEM-SS [43,44] were maintained in CEM-CM which con-
sisted of RPMI supplemented with 10% fetal calf serum,
1% penicillin/streptomycin, and 1% glutamine.
Virus production and titration
For virus production, 293T cells, seeded at 4 × 10
6
per 100-
mm diameter dish were transfected using polyethylen-
imine (PEI; 25 kDa, Sigma) with modification of a previ-
ously described procedure [45]. For each transfection, 20
Retrovirology 2009, 6:16 />Page 13 of 15
(page number not for citation purposes)
μg of either HIV WT or pHIV-YRHHY > A5 were cotrans-
fected with 1.2 μg pGL, which expresses the green fluores-
cent protein from a cytomegalovirus immediate early
promoter (Invitrogen); the proportion of GFP-positive
cells was determined to estimate the transfection effi-
ciency. The virus-containing supernatant was harvested 48
hours after transfection, filtered through a 0.45 μm filter,
and diluted in CM. TZM-bl cells were seeded at 4 × 10
3
cells per well in white flat-bottomed 96-well plates, and
24 hours later infected with virus supernatant containing
5 ng of p24 capsid protein, as determined using the p24
ELISA kit (Perkin Elmer). Another 24 hours later, the cul-
ture medium was removed and replaced with 100 μl of
CM without phenol red, and 100 μl of britelite luciferase
solution (Perkin Elmer). After 1 minute incubation, the
level of luciferase activity was measured using a LUMIstar
Galaxy luminometer. Virus made by infection of CEM
cells was added undiluted to the TZM-bl cells.
To determine whether the YRHHY > A5 Vif mutation dis-
played the expected phenotype in the presence of the dif-
ferent APOBEC3 proteins, 293T cells, seeded at 8 × 10
5
cells per well of a 6-well plate, were transfected using PEI
with 6 μg of either pNL4-3 or pHIV-YRHHY > A5 and 0.5
μg of either A3G [46,47], A3F [1] or the D128K-A3G
mutant [31]. At 48 hours post-transfection, the virus-con-
taining supernatant was harvested and filtered through a
0.45 μm filter. The virus titers were then determined using
TZM-bl cells as described above.
RT assay
To determine the RT activity of virus made by transient
transfection, 20 μl of virus-containing supernatant were
analyzed using the Quan-T-RT assay system (Amersham).
The samples were then analyzed using the 1600 TR Liquid
Scintillation Analyzer (Packard). To determine the RT
activity of virus made by infection of CEM cells, 1 ml of
virus-containing supernatant was centrifuged at 82,000 ×
g for 1 hour to pellet the virus. The supernatant was
removed and the virus pellet resuspended in 40 μl of
phosphate buffered saline before being analyzed as
described above.
CEM and CEM-SS cell infection
CEM and CEM-SS cells were seeded at 1 × 10
6
cells in 1 ml
CEM-CM in 25 cm
3
flasks and combined with an aliquot
of virus that corresponded to 1000 scintillation counts/
minute (referred to in the remainder of the text as 1000 RT
units) in a final volume of 200 μl CEM-CM on day one of
infection. The virus-cell solution was incubated at 37°C
with 5% CO
2
for 5 hours, after which an additional 5 ml
CEM-CM was added. At two day intervals (days 3, 5, 7 etc.
post-infection), the virus and cell suspension was mixed
by pipetting, and 4 ml of cells and virus-containing super-
natant was removed and centrifuged at 400 × g for 3 min-
utes. The virus-containing supernatant was then removed
and filtered through a 0.45 μm filter and a 1 ml aliquot
was stored at -70°C for RT assays. The remaining superna-
tant was stored at -70°C for reinfection. The virus-infected
cells were resuspended in 300 μl of PBS and stored at -
70°C for DNA and RNA extraction. A 4 ml aliquot of fresh
CEM-CM was then added to the remaining 2 ml cell and
virus suspension and the sample incubated for another 2
days.
DNA extraction and PCR
DNA was extracted from 1 × 10
6
virus-infected cells using
the FlexiGene DNA kit (Qiagen) and resuspended in 100
μl of buffer (FG3). A 2 μl aliquot of the extracted DNA was
then used in a PCR reaction with 1 μl High Fidelity Plati-
num Taq (Invitrogen) and 20 pmoles each of the forward
and reverse primers. The primers VifF and VifR were used
to amplify the Vif gene. The dimer initiation site and
beginning of gag was amplified using the primers DIS-F
(5'GTCTGTTGTGTGACTCTGGTAAC3') and DIS-R
(5'CCTGTCTGAAGGGATGGTTGTAG3').
RNA extraction, DNase treatment, and RT-PCR
Viral RNA was extracted using the QIAamp viral RNA mini
kit (Qiagen). Briefly, a 140 μl aliquot of unconcentrated
virus at the peak of infection (as determined using the RT
assay) was combined with 560 μl Buffer AVL containing
carrier RNA and the extracted RNA was eluted from the
column in 60 μl of Buffer AVE. A 25 μl aliquot of the
extracted RNA was then combined with 1 μl Turbo DNase
(Ambion), 5 μl 10× Buffer and 19 μl RNase-free dH
2
O.
The DNase digestion was performed at 37°C for 30 min-
utes, after which 5 μl Inactivation reagent (Ambion) was
added and incubated at room temperature for 2 minutes
with regular mixing. The Inactivation reagent was
removed by centrifugation at 10,000 × g for 2 minutes and
a 2 μl aliquot of the DNase-treated RNA was amplified in
an RT-PCR reaction using Superscript III One-step RT-PCR
mix (Invitrogen). Briefly, the DNase-treated RNA was
combined with 25 μl 2× Buffer, 1 μl superscript III RT-Taq
mix, 20 μl RNase-free dH
2
O and 10 pmoles each of the
forward and reverse primers. To amplify the Vif gene, the
forward primer NL43-seq-3911F
(5'GCAGGATATGTAACTGACAG3') and the reverse
primer VifR were used. To amplify the dimer initiation site
and beginning of gag, the primers DIS-F and DIS-R were
used. As a control for the efficiency of the DNase treat-
ment, each reaction was also set up with High Fidelity
Platinum Taq without RT.
Cellular RNA was extracted from 1 × 10
6
virus-infected
cells using the RNAqueous-4PCR kit (Ambion) and eluted
from the column in 50 μl of Elution solution. A 25 μl aliq-
uot of the extracted RNA was then DNase-treated and used
in an RT-PCR reaction as described above.
Retrovirology 2009, 6:16 />Page 14 of 15
(page number not for citation purposes)
Cloning of PCR products in TA vectors
Following PCR or RT-PCR, the resulting PCR amplicons
were resolved on a 1% agarose gel, the relevant products
were extracted using the PureLink Quick gel extraction kit
(Invitrogen), and eluted in 50 μl TE Buffer prewarmed to
65°C. The eluted PCR product was then used in the TOPO
TA cloning reaction (Invitrogen). The resulting white col-
onies were grown in Luria broth and the plasmid DNA
extracted using the QIAprep Turbo kit (Qiagen). The indi-
vidual clones were then sequenced; for Vif sequencing, the
primer NL43-seq-4921F
(5'GAGATCCAGTTTGGAAAGGAC3') was used; for
sequencing of the dimer initiation site and the beginning
of gag, the primer DIS-R was used.
Western blot for detection of endogenous A3G and A3F
An aliquot of 2 × 10
7
CEM and CEM-SS cells were lysed in
500 μl of lysis buffer (50 mM Tris-HCl, pH 7.4 with 150
mM NaCl, 1 mM EDTA and 1% Triton X-100), containing
Protease Inhibitor Cocktail (Roche), by incubation with
gentle agitation for 10 min. The cellular debris was
removed by centrifugation at 10,000 × g for 10 min. The
cell lysates were then analyzed by polyacrylamide gel elec-
trophoresis and western blotting. For detection of A3G,
the rabbit anti-A3G antiserum ApoC17 [48,49] at a dilu-
tion of 1:5,000 was used, followed by a horseradish per-
oxidase (HRP)-labeled goat anti-rabbit secondary
antibody (Sigma) at a 1:10,000 dilution; for detection of
A3F, a rabbit anti-human A3F antibody (Immunodiag-
nostics) at a dilution of 1:5,000 was used, followed by the
same secondary antibody as above at a dilution of
1:10,000. As a control for the amount of total protein, α-
tubulin was detected using mouse anti-α-tubulin anti-
body (Sigma) at a 1:5,000 dilution, followed by an HRP-
labeled goat anti-mouse secondary antibody (Sigma) at a
1:10,000 dilution. The proteins were visualized using the
Western Lighting Chemiluminescence Reagent Plus kit
from PerkinElmer. As positive controls, 293T cell lysates
containing N-terminally FLAG-tagged A3G and A3F were
analyzed.
Abbreviations
HIV-1: human immunodeficiency virus type 1; Vif: viral
infectivity factor; APOBEC3G and A3G: apolipoprotein B
mRNA-editing enzyme catalytic polypeptide-like 3G;
APOBEC3F and A3F: apolipoprotein B mRNA-editing
enzyme catalytic polypeptide-like 3F.
Competing interests
The authors declare that they have no competing interests.
Authors' contributions
RAR performed all experiments. VKP and RAR designed
the studies and carried out data analysis. MDM and WSH
provided valuable intellectual input in the design and
analysis of the experiments. VKP supervised and directed
the studies and data analysis. All authors approved and
contributed to the preparation of the final manuscript.
Acknowledgements
The authors would like to thank John Coffin and Frank Maldarelli for critical
reading of the manuscript and valuable suggestions. We would also like to
thank Wei Bu, Ryan Burdick, Yeshitila Friew, and Jessica Smith for critical
reading of the manuscript. TZM-bl cells were obtained through the NIH
AIDS Research and Reference Reagent Program, Division of AIDS, NIAID,
NIH from Dr. John C. Kappes and Dr. Xiaoyun Wu and Tranzyme Inc. This
research was supported by the Intramural Research Program of the NIH,
National Cancer Institute, Center for Cancer Research. The content of this
publication does not necessarily reflect the views or policies of the Depart-
ment of Health and Human Services, nor does mention of trade names,
commercial products, or organizations imply endorsement by the U.S.
Government.
References
1. Liddament MT, Brown WL, Schumacher AJ, Harris RS: APOBEC3F
properties and hypermutation preferences indicate activity
against HIV-1 in vivo. Curr Biol 2004, 14:1385-1391.
2. Mangeat B, Turelli P, Caron G, Friedli M, Perrin L, Trono D: Broad
antiretroviral defence by human APOBEC3G through lethal
editing of nascent reverse transcripts. Nature 2003,
424:99-103.
3. Sheehy AM, Gaddis NC, Choi JD, Malim MH: Isolation of a human
gene that inhibits HIV-1 infection and is suppressed by the
viral Vif protein. Nature 2002, 418:646-650.
4. Wiegand HL, Doehle BP, Bogerd HP, Cullen BR: A second human
antiretroviral factor, APOBEC3F, is suppressed by the HIV-
1 and HIV-2 Vif proteins. Embo J 2004, 23:2451-2458.
5. Zennou V, Bieniasz PD: Comparative analysis of the antiretro-
viral activity of APOBEC3G and APOBEC3F from primates.
Virology 2006, 349:31-40.
6. Conticello SG, Harris RS, Neuberger MS: The Vif protein of HIV
triggers degradation of the human antiretroviral DNA
deaminase APOBEC3G. Curr Biol 2003, 13:2009-2013.
7. Liu B, Yu X, Luo K, Yu Y, Yu XF: Influence of primate lentiviral
Vif and proteasome inhibitors on human immunodeficiency
virus type 1 virion packaging of APOBEC3G. J Virol 2004,
78:2072-2081.
8. Marin M, Rose KM, Kozak SL, Kabat D: HIV-1 Vif protein binds
the editing enzyme APOBEC3G and induces its degradation.
Nat Med 2003, 9:1398-1403.
9. Sheehy AM, Gaddis NC, Malim MH: The antiretroviral enzyme
APOBEC3G is degraded by the proteasome in response to
HIV-1 Vif. Nat Med 2003, 9:1404-1407.
10. Stopak K, de Noronha C, Yonemoto W, Greene WC: HIV-1 Vif
blocks the antiviral activity of APOBEC3G by impairing both
its translation and intracellular stability. Mol Cell 2003,
12:591-601.
11. Yu X, Yu Y, Liu B, Luo K, Kong W, Mao P, Yu XF: Induction of
APOBEC3G ubiquitination and degradation by an HIV-1 Vif-
Cul5-SCF complex.
Science 2003, 302:1056-1060.
12. He Z, Zhang W, Chen G, Xu R, Yu XF: Characterization of Con-
served Motifs in HIV-1 Vif Required for APOBEC3G and
APOBEC3F Interaction. J Mol Biol 2008, 381(4):1000-1011.
13. Mehle A, Wilson H, Zhang C, Brazier AJ, McPike M, Pery E, Gabuzda
D: Identification of an APOBEC3G binding site in human
immunodeficiency virus type 1 Vif and inhibitors of Vif-
APOBEC3G binding. J Virol 2007, 81:13235-13241.
14. Mulder LC, Harari A, Simon V: Cytidine deamination induced
HIV-1 drug resistance. Proc Natl Acad Sci USA 2008,
105:5501-5506.
15. Russell RA, Pathak VK: Identification of two distinct human
immunodeficiency virus type 1 Vif determinants critical for
interactions with human APOBEC3G and APOBEC3F. J Virol
2007, 81:8201-8210.
16. Simon V, Zennou V, Murray D, Huang Y, Ho DD, Bieniasz PD: Nat-
ural Variation in Vif: Differential Impact on APOBEC3G/3F
Publish with BioMed Central and every
scientist can read your work free of charge
"BioMed Central will be the most significant development for
disseminating the results of biomedical research in our lifetime."
Sir Paul Nurse, Cancer Research UK
Your research papers will be:
available free of charge to the entire biomedical community
peer reviewed and published immediately upon acceptance
cited in PubMed and archived on PubMed Central
yours — you keep the copyright
Submit your manuscript here:
/>BioMedcentral
Retrovirology 2009, 6:16 />Page 15 of 15
(page number not for citation purposes)
and a Potential Role in HIV-1 Diversification. PLoS Pathog 2005,
1:e6.
17. Tian C, Yu X, Zhang W, Wang T, Xu R, Yu XF: Differential
requirement for conserved tryptophans in human immuno-
deficiency virus type 1 Vif for the selective suppression of
APOBEC3G and APOBEC3F. J Virol 2006, 80:3112-3115.
18. Bishop KN, Holmes RK, Malim MH: Antiviral potency of
APOBEC proteins does not correlate with cytidine deamina-
tion. J Virol 2006, 80:8450-8458.
19. Harris RS, Bishop KN, Sheehy AM, Craig HM, Petersen-Mahrt SK,
Watt IN, Neuberger MS, Malim MH: DNA deamination mediates
innate immunity to retroviral infection. Cell 2003,
113:803-809.
20. Harris RS, Sheehy AM, Craig HM, Malim MH, Neuberger MS: DNA
deamination: not just a trigger for antibody diversification
but also a mechanism for defense against retroviruses. Nat
Immunol 2003, 4:641-643.
21. Holmes RK, Koning FA, Bishop KN, Malim MH: APOBEC3F can
inhibit the accumulation of HIV-1 reverse transcription
products in the absence of hypermutation. Comparisons
with APOBEC3G. J Biol Chem 2007, 282:2587-2595.
22. Lecossier D, Bouchonnet F, Clavel F, Hance AJ: Hypermutation of
HIV-1 DNA in the absence of the Vif protein. Science 2003,
300:1112.
23. Luo K, Wang T, Liu B, Tian C, Xiao Z, Kappes J, Yu XF: Cytidine
deaminases APOBEC3G and APOBEC3F interact with
human immunodeficiency virus type 1 integrase and inhibit
proviral DNA formation. J Virol 2007, 81:7238-7248.
24. Mbisa JL, Barr R, Thomas JA, Vandegraaff N, Dorweiler IJ, Svarovskaia
ES, Brown WL, Mansky LM, Gorelick RJ, Harris RS, Engelman A,
Pathak VK: Human immunodeficiency virus type 1 cDNAs
produced in the presence of APOBEC3G exhibit defects in
plus-strand DNA transfer and integration. J Virol 2007,
81:7099-7110.
25. Simon JH, Malim MH: The human immunodeficiency virus type
1 Vif protein modulates the postpenetration stability of viral
nucleoprotein complexes. J Virol 1996, 70:5297-5305.
26. von Schwedler U, Song J, Aiken C, Trono D: Vif is crucial for
human immunodeficiency virus type 1 proviral DNA synthe-
sis in infected cells. J Virol 1993, 67:4945-4955.
27. Goila-Gaur R, Strebel K: HIV-1 Vif, APOBEC, and intrinsic
immunity. Retrovirology 2008, 5:51.
28. Bogerd HP, Doehle BP, Wiegand HL, Cullen BR: A single amino
acid difference in the host APOBEC3G protein controls the
primate species specificity of HIV type 1 virion infectivity fac-
tor. Proc Natl Acad Sci USA 2004, 101:3770-3774.
29. Mangeat B, Turelli P, Liao S, Trono D: A single amino acid deter-
minant governs the species-specific sensitivity of
APOBEC3G to Vif action. J Biol Chem 2004, 279:14481-14483.
30. Schrofelbauer B, Chen D, Landau NR: A single amino acid of
APOBEC3G controls its species-specific interaction with vir-
ion infectivity factor (Vif). Proc Natl Acad Sci USA 2004,
101:3927-3932.
31. Xu H, Svarovskaia ES, Barr R, Zhang Y, Khan MA, Strebel K, Pathak
VK: A single amino acid substitution in human APOBEC3G
antiretroviral enzyme confers resistance to HIV-1 virion
infectivity factor-induced depletion. Proc Natl Acad Sci USA 2004,
101:5652-5657.
32. Harris RS, Petersen-Mahrt SK, Neuberger MS: RNA editing
enzyme APOBEC1 and some of its homologs can act as
DNA mutators. Mol Cell 2002, 10:1247-1253.
33. Beale RC, Petersen-Mahrt SK, Watt IN, Harris RS, Rada C, Neu-
berger MS: Comparison of the differential context-depend-
ence of DNA deamination by APOBEC enzymes:
correlation with mutation spectra in vivo. J Mol Biol 2004,
337:585-596.
34. Bishop KN, Holmes RK, Sheehy AM, Davidson NO, Cho SJ, Malim
MH: Cytidine deamination of retroviral DNA by diverse
APOBEC proteins. Curr Biol 2004, 14:1392-1396.
35. Langlois MA, Beale RC, Conticello SG, Neuberger MS: Mutational
comparison of the single-domained APOBEC3C and double-
domained APOBEC3F/G anti-retroviral cytidine deaminases
provides insight into their DNA target site specificities.
Nucleic Acids Res 2005, 33:1913-1923.
36. Wen J, Brogna S:
Nonsense-mediated mRNA decay. Biochem
Soc Trans 2008, 36:514-516.
37. Xu H, Chertova E, Chen J, Ott DE, Roser JD, Hu WS, Pathak VK:
Stoichiometry of the antiviral protein APOBEC3G in HIV-1
virions. Virology 2006, 360(2):247-256.
38. Hache G, Shindo K, Albin JS, Harris RS: Evolution of HIV-1 iso-
lates that use a novel Vif-independent mechanism to resist
restriction by human APOBEC3G. Curr Biol 2008, 18:819-824.
39. Adachi A, Gendelman HE, Koenig S, Folks T, Willey R, Rabson A, Mar-
tin MA: Production of acquired immunodeficiency syndrome-
associated retrovirus in human and nonhuman cells trans-
fected with an infectious molecular clone. J Virol 1986,
59:284-291.
40. Yang S, Delgado R, King SR, Woffendin C, Barker CS, Yang ZY, Xu L,
Nolan GP, Nabel GJ: Generation of retroviral vector for clinical
studies using transient transfection. Hum Gene Ther 1999,
10:123-132.
41. Derdeyn CA, Decker JM, Sfakianos JN, Wu X, O'Brien WA, Ratner
L, Kappes JC, Shaw GM, Hunter E: Sensitivity of human immun-
odeficiency virus type 1 to the fusion inhibitor T-20 is modu-
lated by coreceptor specificity defined by the V3 loop of
gp120. J Virol 2000, 74:8358-8367.
42. Wei X, Decker JM, Liu H, Zhang Z, Arani RB, Kilby JM, Saag MS, Wu
X, Shaw GM, Kappes JC: Emergence of resistant human immu-
nodeficiency virus type 1 in patients receiving fusion inhibi-
tor (T-20) monotherapy. Antimicrob Agents Chemother 2002,
46:1896-1905.
43. Foley GE, Handler AH, Lynch PM, Wolman SR, Stulberg CS, Eagle H:
Loss of neoplastic properties in vitro. II. Observations on KB
sublines. Cancer Res 1965, 25:1254-1261.
44. Nara PL, Fischinger PJ: Quantitative infectivity assay for HIV-1
and-2. Nature 1988, 332:469-470.
45. Boussif O, Lezoualc'h F, Zanta MA, Mergny MD, Scherman D, Deme-
neix B, Behr JP: A versatile vector for gene and oligonucleotide
transfer into cells in culture and in vivo: polyethylenimine.
Proc Natl Acad Sci USA 1995, 92:7297-7301.
46. Kao S, Khan MA, Miyagi E, Plishka R, Buckler-White A, Strebel K: The
human immunodeficiency virus type 1 Vif protein reduces
intracellular expression and inhibits packaging of
APOBEC3G (CEM15), a cellular inhibitor of virus infectivity.
J Virol 2003, 77:11398-11407.
47. Russell RA, Smith J, Barr R, Bhattacharyya D, Pathak VK: Distinct
domains within APOBEC3G and APOBEC3F interact with
separate regions of human immunodeficiency virus type 1
Vif. J Virol 2009, 83:1992-2003.
48. Kao S, Miyagi E, Khan MA, Takeuchi H, Opi S, Goila-Gaur R, Strebel
K: Production of infectious human immunodeficiency virus
type 1 does not require depletion of APOBEC3G from virus-
producing cells. Retrovirology 2004, 1:27.
49. Khan MA, Kao S, Miyagi E, Takeuchi H, Goila-Gaur R, Opi S, Gipson
CL, Parslow TG, Ly H, Strebel K: Viral RNA is required for the
association of APOBEC3G with human immunodeficiency
virus type 1 nucleoprotein complexes. J Virol 2005,
79:5870-5874.