Báo cáo y học: " The HIV RNA setpoint theory revisited" pps
Bạn đang xem bản rút gọn của tài liệu. Xem và tải ngay bản đầy đủ của tài liệu tại đây (341.85 KB, 9 trang )
BioMed Central
Page 1 of 9
(page number not for citation purposes)
Retrovirology
Open Access
Research
The HIV RNA setpoint theory revisited
Ronald B Geskus*
1,3
, Maria Prins
1,2
, Jean-Baptiste Hubert
4,5,9
,
Frank Miedema
6
, Ben Berkhout
7
, Christine Rouzioux
8
, Jean-
Francois Delfraissy
9
and Laurence Meyer
4,5,6
Address:
1
Department of Clinical Epidemiology, Biostatistics and Bioinformatics, Academic Medical Center, Meibergdreef 15, 1105 AZ,
Amsterdam, The Netherlands,
2
Department of Internal Medicine, Academic Medical Center, Meibergdreef 15, 1105 AZ, Amsterdam, The
Netherlands,
3
Cluster Infectious Diseases, Department of Research, Amsterdam Health Service, Nieuwe Achtergracht 100, 1018 WT, Amsterdam,
The Netherlands,
4
Inserm, U822, Le Kremlin-Bicêtre, F-94276, France,
5
AP-HP, Hopital Bicêtre, Epidemiology and Public Health Service, F-94276,
France,
6
Department of Immunology, University Medical Center, Utrecht, The Netherlands,
7
Department of Human Retrovirology, Academic
Medical Center, Meibergdreef 15, 1105 AZ, Amsterdam, The Netherlands,
8
Department of Virology, Hôpital Necker, Paris, France and
9
Univ Paris-
Sud, Faculté de Médecine Paris-Sud, Le Kremlin-Bicêtre, F-94276, France
Email: Ronald B Geskus* - ; Maria Prins - ; Jean-Baptiste Hubert - ;
Frank Miedema - ; Ben Berkhout - ; Christine Rouzioux -
paris.fr; Jean-Francois Delfraissy - ; Laurence Meyer -
* Corresponding author
Abstract
Background: The evolution of plasma viral load after HIV infection has been described as reaching
a setpoint, only to start rising again shortly before AIDS diagnosis. In contrast, CD4 T-cell count is
considered to show a stable decrease. However, characteristics of marker evolution over time
depend on the scale that is used to visualize trends. In reconsidering the setpoint theory for HIV
RNA, we analyzed the evolution of CD4 T-cell count and HIV-1 RNA level from HIV
seroconversion to AIDS diagnosis. Follow-up data were used from two cohort studies among
homosexual men (N = 400), restricting to the period before highly active antiretroviral therapy
became widely available (1984 until 1996). Individual trajectories of both markers were fitted and
averaged, both from seroconversion onwards and in the four years preceding AIDS diagnosis, using
a bivariate random effects model. Both markers were evaluated on a scale that is directly related
to AIDS risk.
Results: Individuals with faster AIDS progression had higher HIV RNA level six months after
seroconversion. For CD4 T-cell count, this ordering was less clearly present. However, HIV RNA
level and CD4 T-cell count showed qualitatively similar evolution over time after seroconversion,
also when stratified by rate of progression to AIDS. In the four years preceding AIDS diagnosis, a
non-significant change in HIV RNA increase was seen, whereas a significant biphasic pattern was
present for CD4 T-cell decline.
Conclusion: HIV RNA level has more setpoint behaviour than CD4 T-cell count as far as the level
shortly after seroconversion is concerned. However, with respect to the, clinically more relevant,
marker evolution over time after seroconversion, a setpoint theory holds as much for CD4 T-cell
count as for HIV RNA level.
Published: 21 September 2007
Retrovirology 2007, 4:65 doi:10.1186/1742-4690-4-65
Received: 16 April 2007
Accepted: 21 September 2007
This article is available from: />© 2007 Geskus et al; licensee BioMed Central Ltd.
This is an Open Access article distributed under the terms of the Creative Commons Attribution License ( />),
which permits unrestricted use, distribution, and reproduction in any medium, provided the original work is properly cited.
Retrovirology 2007, 4:65 />Page 2 of 9
(page number not for citation purposes)
Background
CD4 T-cell count and HIV RNA level (viral load) are the
most widely used markers of progression to AIDS and
death in HIV-1 infected persons. Investigating their natu-
ral course after infection and the effect of covariates on
this natural course is of great importance for prognosis,
deciding when to start highly active antiretroviral therapy
(HAART), and the understanding of marker dynamics
after HAART interruption. It is generally agreed that CD4
T-cell count shows a consistent decline after HIV infec-
tion. For the evolution of viral load, the setpoint theory
was introduced soon after the implementation of HIV
RNA assays [1,2]. Three components describe the setpoint
behaviour after the high peak reached in the first few
weeks after infection: viral load remains relatively stable
for a certain period (the "setpoint"); individuals who have
a higher setpoint level have faster AIDS progression; and
shortly before the development of AIDS, viral load rises
again. A U-shaped curve has been another way to describe
the same phenomenon [3]. As a consequence, individuals
with faster AIDS progression have a shorter duration of
the plateau phase. The definition of the plateau phase has
not been consistent and departure from the plateau phase
has been defined as an increase of 0.5 to 1 units from
baseline level on the base-10 logarithmic scale [1,4,5].
Aspects of the setpoint theory have been criticized [6-10].
Alternative reasons have been suggested for the apparent
stable level of viral load, including lack of sensitivity and
precision of the assay used [6] or selection of specific sub-
groups and short follow-up [8].
The predictive value of the level in viral load reached
shortly after seroconversion has been shown convincingly
before [11,12]. The aim of this study was to reconsider the
two other aspects of the HIV RNA setpoint theory by using
a method that allows for a direct comparison of the evo-
lution of two or more markers. By evaluating marker evo-
lution on a scale that is related to progression to AIDS,
changes in a marker that do not lead to a change in AIDS
risk were considered as clinically irrelevant and therefore
seen as stable. The evolution of both markers was mod-
eled and compared from seroconversion onwards and
also during the last four years prior to AIDS diagnosis.
Results
General characteristics
The 400 persons contributed 2192 person-years of follow-
up and 166 AIDS events. Average follow-up time was 6.0
years for the Amsterdam cohort (maximum 14.0 years)
and 5.4 years for the French cohort (maximum 9.3 years).
We had 6761 CD4 and 3807 HIV RNA measurements. Of
the latter, 9% (n = 344) were below the detection limit.
Only 183 individuals had HIV RNA measurements in the
first six months after seroconversion (with a maximum of
four per individual). For individuals who started ART dur-
ing follow-up (n = 202), the average time from serocon-
version to ART administration was 4.1 years. Six percent of
the records were obtained from individuals receiving ART
with at least two drugs (mainly Zidovudine (AZT), Dida-
nosine (ddI) or Zalcitabine (ddC) and 0.5% from patients
receiving more than two drugs); 22% were obtained
under monotherapy (mainly AZT), and the remaining
72% were obtained from persons while not on ART. ART
had no significant effect on CD4 T-cell count, but did
affect HIV RNA level (table 1). The estimated effect is
slightly lower than the one presented by Hubert et al. [7].
Marker evolution from seroconversion onwards
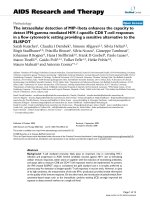
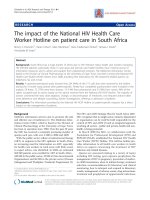
The evolution of CD4 T-cell count and viral load over time
after seroconversion is shown graphically in the figures 1
and 2. Since the effects of cube root of CD4 T-cell count
and base-10 logarithm of viral load on AIDS risk showed
almost no deviations from linearity, this scale is used in
the graphs. However, corresponding backtransformed
CD4 T-cell counts are shown on the y-axis. Since the effect
of changes in CD4 count on AIDS risk is much larger at
low counts than at high counts, changes at high counts
give smaller changes in the graph.
Individuals with faster AIDS progression have higher HIV
RNA level six months after seroconversion. For CD4 T-cell
count, this ordering is less clearly present. However, the
averaged individual patterns for both markers, as derived
from the longitudinal approach, are similar after the first
six months following seroconversion (thick black lines,
with 95% confidence intervals), but of course they trend
in opposite directions. Both curves remain fairly stable
during the first few years after seroconversion, but curves
become increasingly steeper over time. Similarly, for both
markers, evolution differs by subgroup as classified by
their disease progression: AIDS occurring <3.5 years (N =
40), 3.5 to 7 years (N = 103), >7 years after seroconversion
(N = 23), and AIDS-free for more than 9 years after sero-
conversion (N = 36). Individuals with fast progression to
AIDS – i.e., within 3.5 years after seroconversion and, to a
lesser extent, between 3.5 and 7 years – do not have a sta-
Table 1: Estimates of ART effects on base-10 logarithm of HIV
RNA level and cube root of CD4 T-cell count
HIV RNA CD4
effects 95% CI effects 95% CI
monotherapy
(first 6 months)
-0.32 -0.39 -0.24 0.02 -0.05 0.08
monotherapy
(next 6 months)
-0.12 -0.21 -0.02 -0.02 -0.11 0.06
dual therapy
(first 6 months)
-0.33 -0.47 -0.18 0.05 -0.06 0.15
dual therapy
(next 9 months)
-0.25 -0.42 -0.08 -0.08 -0.22 0.06
Retrovirology 2007, 4:65 />Page 3 of 9
(page number not for citation purposes)
ble plateau phase for either marker. The trends in average
value, derived from the repeated cross-sectional approach
(thin grey lines), are very different from the averaged pat-
terns. Only a modest decrease in CD4 T-cell count is seen,
which levels off at a value of around 300 cells/
μ
L after
eight years. For viral load, a very small increase in average
value is seen (from 4.32 to 4.54). However, the estimated
curve at later time points suffers from survivorship bias,
since individuals with fast disease progression do not con-
tribute to the estimate.
The effects of time-updated marker values on AIDS risk are
used to directly compare average patterns of CD4 T-cell
count and HIV RNA level on a common scale (figure 3).
Numbers on the y-axis are interpreted as follows. Table 2
gives the change in relative AIDS risk per unit change in
cube root of CD4 T-cell count and base-10 logarithm in
viral load, based on a time-dependent Cox proportional
hazards model. Changes in both marker patterns over
time after seroconversion correspond to changes in AIDS
risk, as shown on the left y-axis. Marker levels at serocon-
version (excluding the initial peak for HIV RNA level)
have been chosen as reference values (i.e. relative risk 1).
Note that a logarithmic scale is used, since this describes
the linear effects in a Cox proportional hazards model. For
example, over the first four years following seroconver-
sion, the average CD4 T-cell count pattern shows a decline
from 656 cells/
μ
L to 364 cells/
μ
L, which implies a drop of
656
1/3
– 364
1/3
= 1.55 on the cube root scale. This corre-
sponds to a exp(0.5801 × 1.55) = 2.46-fold increase in
AIDS risk. The average viral load over the same time span
shows an increase by 0.19, corresponding to an exp(1.422
× 0.19) = 1.3-fold increase in risk. In order to double the
AIDS risk, the cube root of the CD4 T-cell count should
decrease by log(2)/0.5801 = 1.19 (since exp(0.5801 ×
1.19) = 2), whereas the base-10 logarithm of viral load
should increase by log(2)/1.422 = 0.49. On the right y-
axis, the values of CD4 count (on original scale) and viral
load (on base-10 logarithmic scale) corresponding with
changes in relative risk are shown (again with fitted
marker values at seroconversion as reference value). It is
seen that the average decrease in CD4 T-cell count over the
first ten years induces a much stronger increase in AIDS
risk than does the average increase in viral load. Since
average viral load remains more stable than CD4 T-cell
count on the AIDS-risk scale, one may say that it exhibits
more setpoint behavior. However, this difference between
the curves actually increases over time after seroconver-
sion: the relative risk ratio RR(CD4)/RR(RNA) increases
from exp(0.5801 × 1.55)/exp(1.422 × 0.19) = 1.88 at four
years to exp(4.126)/exp(1.919) = 9.09 at ten years after
seroconversion.
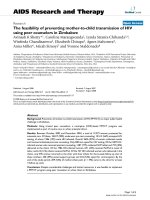
CD4 count patterns over time after seroconversionFigure 1
CD4 count patterns over time after seroconversion. Scatterplot of CD4 T-cell count values after seroconversion (grey
points), together with the fitted least squares curve (i.e. average CD4 T-cell count values; thin grey line) and the fitted curve
from the random effects model (i.e. average CD4 T-cell count patterns; thick black line, with 95% confidence intervals). Average
patterns for the groups defined by progression times (in years) are shown as well (dashed grey lines).
•
•
•
•
•
•
•
•
•
•
•
•
•
•
••
•
•
•
•
•
•
•
•
•
•
•
•
•
••
•
•
•
••
••
•
•
•
•
••
•
•
•
•
•
•
•
•
•
•
•
•
•
•
•
•
•
•
•
•
•
•
•
•
•
•
•
•
•
•
•
•
•
•
•
•
•
•
•
•
•
•
•
•
•
•
•
•
•
•
•
•
•
•
•
•
•
•
•
•
•
•
•
•
•
•
•
•
•
•
•
•
•
•
•
•
•
•
•
•
•
•
•
•
•
•
•
•
•
•
•
•
•
•
•
•
•
•
•
•
•
•
•
•
•
•
••
•
•
••
•
•
•
•
•
•
•
•
•
•
•
•
•
•
•
•
•
•
•
•
•
•
•
•
•
•
•
•
•
•
•
•
•
•
•
•
•
•
•
•
•
••
•
•
•
•
•
•
•
•
•
•
•
•
•
•
•
•
•
•
•
•
••
•
•
•
•
••
•
•
•
•
•
•
•
•
•
•
••
•
•
•
•
•
•
•
•
•
•
•
•
•
•
•
•
•
••
•
•
•
•
•
••
•
•
•
••
•
•
••
•
••
•
•• •
•
•
•
•
•
•
•
•
•
•
•
•
•
•
•
•
•
•
•
•
•
•
•
•
•
•
•
•
•
•
•
•
•
•
•
•
•
•
•
•
•
•
•
•
•
•
•
•
•
•
•
•
•
•
•
•
•
•
•
•
•
•
•
•
•
•
•
•
•
•
•
•
•
•
•
•
•
•
•
•
•
•
•
•
••
•
•
•
•
•
•
•
•
•
•
•
•
•
•
•
•
•
•
•
•
•
•
•
•
•
•
•
•
•
•
••
•
•
•
•
•
•
•
•
•
•
•
•
•
•
•
•
•
•
•
•
•
•
•
••
•
•
•
•
•
•
•
•
•
•
•
•
•
•
•
•
•
•
•
•
•
•
•• •
•
•
•
•
•
•
•
•
•
•
•
•
•
•
•
•
•
•
•
•
•
•
•
•
•
•
•
•
•
•
•
•
•
•
•
•
•
•
•
•
•
•
•
•
•
•
•
••
•
•
•
•
•
•
•
•
•
•
•
•
•
•••
•
•
••
••
•
•
•
•
•
•
•
•
•
•
•
•
•
•
•
•
•
•
•
•
•
•
•
•
•
•
•
•
•
•
•
•
•
•
•
•
•
•
•
•
•
•
•
•
•
•
•
•
•
•
•
•
•
••
•
•
•
•
•
••
•
•
•
•
•
•
•
•
•
•
•
•
•
•
•
•
•
•
•
•
•
•
•
•
•
•
•
•
•
•
•
•
•
•
•
•
•
•
•
•
•
•
•
•
•
•
•
•
•
•
•
•
•
••
•
•
•
•
•
•
•
•
•
•
•
•
•
•
•
•
•
•
•
•
•
•
•
•
•
•
••
•
•
•
•
•
•
•
•
•
•
•
•
•
•
•
•
•
•
•
•
•
••
•
•
•
•
•
•
•
•
•
•
•
•
•
•
•
•
•
•
•
•
•
•
•
•
•
•
•
•
•
•
•
•
•
•
•
•
•
•
•
•
•
•
•
•
•
•
•
•
•
•
•
•
•
•
•
•
•
•
•
•
•
•
•
•
•
•
•
••
•
•
•
•
•
•
•
•
•
•
•
•
•
•
•
•
•
•
•
••
•
•
•
•
•
•
•
•
•
•
•
•
•
•
•
•
•
•
•
•
•
•
•
•
•
•
•
•
•
•
•
•
•
•
•
•
•
•
•
•
•
••
•
•
•
•
•
•
•
•
•
•
•
•
•
•
•
•
•
•
•
•
•
•
•
•
•
•
•
•
•
•
•
•
•
•
•
•
•
•
•
•
••
•
•
•
•
•
•
•
•
•
•
•
•
•
•
•
•
•
•
•
•
•
•
•
•
•
•
•
•
••
•
•
•
•
•
•
•
•
•
••
•
•
•
•
•
•
•
•
•
•
•
•
•
•
•
•
•
•
•
•
•
•
•
••
•
•
•
•
•
•
•
•
•
•
•
•
•
•
•
•
•
•
•
•
•
•
•
•
•
•
•
•
•
•
•
•
••
•
•
•
•
•
••
•
•
•
•
•
•
•
•
•
•
•
•
•
•
•
•
•
•
•
•
••
•
•
•
•
•
•
•
•
•
•
•
•
•
•
•
•
•
•
•
•
•
•
•
•
•
•
•
•
•
•
•
•
••
•
•
•
•
•
•
•
•
••
•
•
•
•
•
•
•
•
•
•
•
•
•
•
•
••
•
•
•
•
•
•
•
•
•
•
•
•
•
•
••
•
••
•
•
•
•
•
••
•
•
•
•
•
•
•
•
•
•
•
•
•
•
•
•
•
•
•
•
•
•
•
•
•
•
•
•
•
•
•
•
•
•
•
•
•
•
•
•
•
•
•
•
•
•
•
•
••
•
•
•
•
•
•
••
•
•
•
•
•
•
•
•
•
•
•
•
•
•
•
•
•
•
•
•
•
•
•
•
•
•
•
•
••
•
•
•
•
•
•
•
•
•
•
•
•
•
•
•
•
••
••••
•
•
•
•
•
•
•
•
•
•
•
•
•
•
•
•
•
•
•
•
•
•
•
••
•
•
•
•
•
•
•
•
•
•
•
•
•
•
•
••
•
•
•
•
•
•
••
•
•
•
•
•
•
•
•
•
•
•
•
•
•
•
•
•
•
••
•
•
•
•
•
•
•
•
•
•
•
•
•
•
•
•
•
•
•
••
•
•
•
•
•
•
••
•
•
•
•
•
•
•
•
•
•
•
•
•
•
•
•
•
•
•
•
•
•
•
•
•
•
•
•
•
•
•
•
•
•
•
•
•
•
•
•
•
•
•
•
•
•
•
•
••
•
•
•
••
•
••
•
•
•
•
•
•
•
•
•
•
•
•
•
•
•
•
•
•
•
•
•
•
•
•
•
•
•
•
•
•
•
•
•
•
•
•
•
••
•
•
•
•
•
•
•
•
•
•
•
•
•
•
•
•
•
•
•
•
•
•
•
•
•
•
•
•
•
•
•
•
•
•
•
•
•
•
•
•
•
•
•
•
•
•
•
••
•
•
•
•
•
•
•
•
•
•
•
•
•
•
•
•
•
•
•
•
•
•
•
•
•
•
•
•
•
•
•
•
•
•
•
•
•••
•
•
•
•
•
•
•
•
•
•
•
•
•
•
•
•
•
•
•
•
•
•
•
•
•
•
•
•
•
•
•
•
••
•
•
•
•
•
•
•
•
•
•
•
•
•
•
•
•
•
•
•
•
•
•
•
•
•
•
•
•
•
•
•
•
•
•
•
•
•
•
••
••
•
•
••
•
•
•
•
••
•
•
•
•
•
•
•
•
•
•
•
•
•
••
•
•
•
•
•
•
•
•
•
•
•
•
•
•
•
•
•
•
•
•
•
•
•
•
•
•
•
•
•
•
•
•
•
•
•
•
•
•
•
•
•
•
•
•
•
•
•
•
•
•
•
•
•
•
•
•
•
•
•
•
•
•
•
•
•
•
•
•
•
•
•
•
•
•
•
•
•
••
•
•
••
•
•
•
•
•
•
•
•
•
•
•
•
•
•
•
•
•
•
•
•
•
•
•
•
•
•
•
•
•
•
•
•
•
•
•
•
•
•
•
•
•
•
•
•••
•
•
•
•
•
•
•
•
•
•
•
•
•
•
•
•
•
•
•
•
•
•
•
•
•
•
•
•
•
•
•
•
•
•
•
•
•
•
•
•
•
•
•
•
•
•
•
•
••
•
••
•
•
•
•
•
•
•
•
•
•
•
•
•
•
•
•
•
•
•
•
•
•
•
•
•
•
•
•
•
••
•
•
•
•
•
•
•
•
•
•
•
•
•
•
••
••
•
•
•
•
•
•
•
•
•
•
•
•
•
•
•
•
•
•
•
•
•
•
•
•
•
•
•
•
•
•
•
•
•
•
•
•
•
•
•
•
•
•
•
•
•
••
•
•
•
•
•
•
•
•
•
•
•
•
•
•
•
•
•
•
•
•
•
•
•
•
•
•
•
•
•
•
•
•
•
•
•
•
•
•
•
•
•
•
•
•
•
•
•
•
•
•
•
•
•
•
•
•
•
•
•
•
•
•
•
•
•
•
•
•
•
•
•
•
•
•
•
•
•
•
•
•
•
•
•
•
•
•
•
•
•
•
•
•
••
•
•
•
•
•
•
•
•
•
•
•
•
•
••
•
•
•
•
•
•
•
•
•
•
•
•
•
•
•
•
•
••
••
•
•
•
•
•
•
•
•
••
•
•
•
•
•
•
••
•••
•
•
•
•
•
•
•
•
•
•
•
•
•
•
•
•
•
•
•
•
•
•
•
•
•
•
•
•
•
•
•
•
•
•
•
•
•
•
•
•
•
•
•
•
•
•
•
•
•
•
•
•
•
•
•
•
•
•
•
•
•
•
•
•
•
•
•
•
•
•
•
••
•
•
•
•
•
•
•
•
•
•
••
•
•
•
•
•
•
•
•
•
•
•
•
•
•
•
•
•
•
•
•
•
•
•
•
•
•
•
•
•
•
•
•
•
•
•
•
•
•
•
•
•
•
•
•
•
•
•
•
•
•
•
•
•
•
•
•
•
•
•
•
•
•
•
•
•
•
•
•
•
•
•
•
••
•
•
•
•
•
•
•
•
•
•
•
•
•
•
•
•
•
••
•
•
•
•
•
•
•
•
•
•
•
•
•
•
•
•
•
•
•
•
•
•
•
•
•
•
•
•
•
•
•
•
•
•
•
•
••
•
•
•
•
••
•
•
•
•
•
•
•
•
•
•
•
•
•
•
•
•
•
•
•
•
•
•
•
•
•
•
•
•
•
•
••
•
•
•
•
•
•
••
•
•
•
•
•
•
•
•
•
•
•
•
•
•
•
•
•
•
•
•
•
•
•
•
•
•
•
•
•
•
•
•
•
•
•
•
•
•
•
••
•
•
•
•
•
•
•
•
•
•
•
•
•
•
•
•
•
•
•
•
•
•
•
•
•
•
•
•
•
•
•
•
•
•
•
•
•
•
•
•
•
•
•
•
•
•
•
•
•
•
•
•
•
•
•
•
•
•
•
•
•
•
•
•
•
••
•
•
•
•
•
•
•
•
•
•
•
•
•
•
•
•
•
•
•
•
•
•
•
•
•
•
•
•
••
•
•
•
•
•
••
••
•
•
••
•
•
•
•
•
•
•
•
•
•
•
•
•
•
•
•
•
••
•
••
••
•
•
•
•
•
•
•
•
•
•
•
•
•
•
•
•
•
•
•
•
•
•
•
•
•
•
•
•
•
•
•
•
•
••
•
•
•
•
•
•
•
•
•
•
•
•
•
••
•
•
•
•
•
•
•
•
•
•
•
•
•
•
•
•
•
•
•
•
•
•
•
•
•
•
•
•
•
•
•
•
•
•
••
•
••
•
•
•
•
•
•
•
•
•
•
•
•
••
•
•
•
•
•
•
•
•
•
•
•
•
•
••
•
•
•
•
•
•
•
•
•
•
•
•
•
•
••
•
•
•
••
•
•
•
•
•
••
•
•
•
•
•
•
•
•
•
•
•
•
•
•
•
•
•
•
•
•
•
•
•
•
•
••
•
••
•
••
•
••
•• •
•••
•
•• ••
•
••
•
•
•
•
•
••
•
•
•
•
•
•
•
•
•
•
•
•
•
•
•
•
•
•
•
•
•
•
•
••
•
•
•
•
•
•
•
•
•
•
•
•
•
•
•
•
•
•
•
•
•
•
•
•
•
•
•
•
•
•
•
•
•
•
•
•
•
•
•
•
•
•
•
•
•
•
•
•
•
•
•
•
•
•
•
•
•
•
•
•
•
•
•
•
•
•
•
•
•
•
•
•
•
•
•
•
••
•
•
•
•
•
•
•
•
•
•
•
•
•
•
•
•
•
•
•
•
•
•
•
•
•
•
•
•
•
••
•
•
•
•
•
••
•
•
•
•
•
•
•
•
•
•
•
•
•
•
•
•
•
•
•
•
•
•
•
•
•
•
•
•
••
•
•
•
•
•
•
•
•
•
•
•
•
•
•
•
•
•
•
•
•
•
••
•
•
••
•
•
•
•
•
•
•
•
•
•
•
•
•
•
•
•
•
•
•
•
•
•
•
•
•
•
•
•
•
•
•
•
•
•
•
•
•
•
•
•
•
•
•
•
•
•
•
•
•
•
•
•
•
•
•
•
•
•
•
•
•
•
•
•
•
•
•
•
•
••
•
•
•
•
•
•
•
•
•
•
•
•
••
•
•
•
•
•
•
•
•
•
•
•
•
•
•
•
•
•
•
•
•
•
•
•
•
•
•
•
•
•
•
•
•
•
•
•
•
•
•
•
•
•
•
•
•
••
•
•
•
•
•
•
•
•
•
•
•
•
•
•
•
•
•
•
•
•
•
•
•
•
•
•
•
•
•
•
•
•
•
•
•
•
•
•
•
•
•
•
•
••
•
•
•
•
•
•
•
•
•
•
•
•
•
•
•
•
•
•
•
•
•
•
•
•
•
•
•
•
•
•
•
•
•
•
•
•
•
•
•
•
•
•
•
•
•
•
•
•
•
•
•
•
•
•
•
•
•
•
•
•
•
•
•
•
•
•
•
•
•
•
•
•
•
•
•
•
•
•
•
•
•
•
••
•
•
•
•• •
•
•••••••
•
•••• •
•
•
•
•
•
•
•
•
•
•
•
•
•
•
•
•
•
•
•
•
•
•
•
•
•
•
•
•
•
•
•
•
•
•
•
•
•
•
•
•
•
•
•
•
•
•
•
•
•
•
•
•
•
•
•
•
•
•
•
•
•
•
•
•
•
•
••
•
••
•
•
•
•
•
•
•
•
•
•
•
•
•
•
•
•
•
•
••
•
•
•
•
•
•
•
•
•
•
•
•
•
••
•
•
•
•
•
•
•
•
•
•
•
••
•
•
•
•
•
•
•
•
•
•
•
•
•
•
•
•
•
•
•
•
•
•
•
•
•
•
•
•
•
•
•
•
•
•
••
•
•
••
•
•
•
•
•
•
•
•
•
•
•
•
•
•
•
••
•
•
•
•
•
•
•
•
•
•
•
•
•
•
•
•
•
•
•
•
•
•
•
•
•
•
•
•
•
•
•
•
•
•
•
•
•
•
•
•
•
••
•
•
•
•
•
••
•
•
•
•
•
•
•
•
•
•
•
•
•
•
•
•
•
•
•
•
•
••
•
•
•
•
•
•
•
•
•
•
•
•
•
•
•
••
•
•
•
•
•
•
•
•
•
•
•
•
•
•
•
•
•
•
•
•
•
•
•
•
•
•
•
•
•
•
•
•
•
•
•
•
•
•
•
•
•
•
•
•
•
•
•
•
••
•
•
•
•
••
•
•
•
•
•
•
•
•
•
•
•
•
•
•
•
•
•
•
•
•
•
•
••
•
•
•
•• •
•
•
•
•
•
•
•
•
•
•
•
••
•
•
•
•
•
•
•
•
•••
•
••
•
•
•
••••
•
•
•
•
•
•
•
•
•
•
•
•
•
•
•
••
•
•
•
•
•
•
•
•
••
••
•
•
•
••
•
•
•
•
•
•
•
•
•
•
•
••
•
•
•
•
•
•
•
•
•
•
•
•
•
•
•
•
•
•
•
•
•
•
•
•
•
•
•
•
•
•
•
•
•
•
•••
••
•
••
•
•
•
•
•
•
•
•
•
•
•
•
•
•
•
•
•
•
•
•
•
•
••
••
•
•
•
•
•
•
•
•
•
•
•
•
•
•
•
•
•
•
•
•
•
•
•
•
•
•
•
•
•
•
•
•
•
•
•
•
•
•
•
•
•
•
•
•
•
•
•
•
•
•
•
•
•
•
•
•
•
•
•
•
•
•
•
•
•
•
•
•
•
•
•
•
•
•
•
•
•
•
•
•
•
•
•
•
•
•
•
•
•
•
•
•
•
•
•
•
•
•
•
•
•
•
•
•
•
•
•
•
•
•
•
•
•
•
•
•
•
•
•
•
•
•
•
•
•
•
•
•
•
•
•
•
•
••
•
•
•
•
•
•
•
••
•
•
•
•
•
•
•
•
•
•
•
•
•
•
•
•
•
•
•
•
•
•
•
•
•
•
•
•
•
•
•
•
•
•
•
•
•
•
•
•
•
•
•
•
•
•
•
•
•
•
•
•
•
•
•
•
•
•
•
•
•
•
•
•
•
•
•
•
•
•
•
•
•
•
•
•
•
•
•
•
•
•
•
•
•
•
•
•
•
•
•
•
•
•
•
•
•
•
•
•
•
•
•
•
•
•
•
•
•
•
•
•
•
•
•
•
•
•
•
•
•
•
•
•
•
•
•
•
•
•
•
•
•
•
•
•
•
•
•
•
•
•
•••
•
•
•
•
•
•
•
•
•
•
•
•
•
•
•
•
•
•
•
•
••
•
•
•
•
•
•
•
•
•
•
•
•
•
•
•
•
•
•
•
•
•
•
•
•
•
•
•
•
•
•
•
•
•
•
•
•
•
•
•
•
•
•
•
•
•
•
•
•
•
•
•
•
•
•
•
•
•
•
•
•
•
•
•
•
•
•
•
•
••
•
•
•
•
•
•
•
•
•
•
•
•
•
•
•
•
•
•
••
•
•
•
•
•
•
•
•
•
•
•
•
•
•
•
•
•
•
•
•
•
•
•
•
•
•
•
•
•
•
•
•
•
•
•
•
•
•
•
•
•
•
•
•
•
•
•
•
•
•
•
•
•
•
•
•
•
•
•
•
•
•
•
•
•
•
•
•
•
•
•
•
•
•
•
•
•
•
•
•
•
•
•
•
•
•
•
•
•
•
•
•
•
•
•
•
•
•
•
•
•
•
•
•
•
•
•
•
•
•
•
•
•
•
•
•
•
•
•
•
•
•
•
•
•
•
•
•
•
•
•
•
•
•
•
•
•
•
•
•
•
•
•
•
•
•
•
•
•
•
•
•
•
•
•
•
•
•
•
•
•
•
•
•
•
•
•
•
•
•
•
•
•
•
•
•
•
•
•
•
•
•
•
•
•
•
•
•
•
•
•
•
•
•
•
•
•
•
•
•
•
•
•
•
•
•
•
•
•
•
•
•
•
•
•
•
••
•
•
•
•
•
•
•
•
•
•
•
•
•
•
•
•
•
•
•
•
•
•
•
•
•
•
•
•
•
•
•
•
•
•
•
•
•
•
•
•
•
•
•
•
•
•
•
•
•
•
•
•
•
•
•
•
•
•
•
•
•
•
•
•
•
•
•
•
•
•
•
•
••
•
•
•
•
•
•
•
•
•
•
•
•
•
•
•
•
•
•
•
•
•
•
•
•
•
•
•
•
•
•
•
•
•
•
•
•
•
•
•
•
•
•
•
•
•
•
•
•
•
•
•
•
•
•
•
•
•
•
•
•
•
•
•
•
•
•
•
•
•
•
•
•
•
•
•
•
•
•
•
•
•
•
•
•
•
•
•
•
•
•
•
•
•
•
•
•
•
•
••
•
•
•
•
•
•
•
••
•
•
•
•
•
•
•
•
•
•
•
•
••
•
•
•
•
•
•
•
•
•
•
•
•
•
•
•
•
•
•
•
•
•
•
•
•
•
•
•
•
•
•
•
•
•
•
•
•
•
•
••
•
•
•
•
•
•
•
•
•
•
•
•
•
•
•
•
•
•
•
•
•
•
•
•
•
•
•
•
•
•
•
•
•
•
•
•
•
•
•
•
•
•
•
•
•
•
•
•
•
•
•
•
•
•
•
•
•
•
•
•
•
•
•
•
•
•
•
•
•
•
•
•
•
•
•
•
•
•
•
•
•
•
•
•
•
•
•
•
•
•
•
•
•
•
•
•
•
•
•
•
•
•
•
•
•
•
•
•
•
•
•
•
•
•
•
•
•
•
•
•
•
•
•
•
•
•
•
•
•
•
•
•
•
•
•
•
•
•
•
•
•
•
•
•
•
•
•
•
•
•
•
•
•
•
•
•
•
•
•
•
•
•
•
•
•
•
•
•
•
•
•
•
•
•
•
•
•
•
•
•
•
•
•
•
•
•
•
•
•
•
•
•
•
•
•
•
•
•
•
•
•
•
•
•
•
•
•
•
•
•
•
•
•
•
•
•
•
•
•
•
•
•
•
•
•
•
•
•
•
•
•
•
•
•
•
•
•
•
•
•
•
•
•
•
••
•
•
•
•
•
•
•
•
•
•
•
•
•
•
•
•
•
•
•
•
•
•
•
•
•
•
•
•
•
•
•
•
•
•
•
•
•
•
•
•
•
•
•
•
•
•
•
•
•
••
•
•
•
•
•
•
•
•
•
•
•
•
•
•
•
•
•
•
•
•
•
•
•
•
•
•
•
•
•
•
•
•
•
•
•
•
•
•
•
•
•
•
•
•
•
•
•
•
•
•
•
•
•
•
•
•
•
•
•
•
•
•
•
•
•
•
•
•
•
•
•
•
•
•
•
•
•
•
•
•
•
•
•
•
•
•
•
•
•
•
•
•
•
•
•
•
•
•
•
•
•
•
•
•
•
•
•
•
•
•
•
•
•
•
•
•
•
•
•
••
•
•
•
•
•
•
•
•
••
•
•
•
•
•
•
•
•
•
•
•
•
•••
•
•
•
•
•
•
•
•
•
•
•
•
•
•
•
•
•
•
••
•
•
•
•
•
•
•
•
•
•
•
•
•
•
•
•
•
•
••
•
•
•
•
•
•
•
•
•
•
•
•
•
•
•
•
•
•
•
•
••
•
•
•
•
•
•
•
•
•
•
•
•
•
•
•
•
•
•
•
•
•
•
•
•
•
•
•
•
•
•
•
•
•
•
•
•
•
•
•
•
•
•
•
•
•
•
•
•
•
•
•
•
•
•
•
•
•
•
•
•
•
•
•
•
•
••
•
•
•
••
•
•
•
•
•
•
•
•
•
•
•
•
•
••
•
•
•
•
•
•
•
•
••
•
•
•
•
•
•
•
•
•
•
•
•
•
•
•
•
•
•
•
•
•
•
•
•
•
•
•
•
•
•
•
•
•
•
•
•
•
•
•
•
•
•
•
•
•
•
•
•
•
•
•
•
•
•
•
•
•
•
•
•
•
•
•
•
•
•
•
•
•
•
•
•
•
•
•
•
•
•
•
•
•
•
•
•
•
•
•
•
•
•
•
••
•
•
•
•
•
•
•
•
•
•
•
•
•
•
•
•
•
•
•
•
•
•
•
•
•
•
•
•
•
•
•
•
•
•
••
•
•
•
•
•
•
•
•
•
•
•
•
•
•
•
•
•
•
•
•
•
•
•
•
•
••
•
•
•
••
•
•
•
•
•
•
•
•
•
•
•
•
•
•
•
•
•
•
•
•
•
•
•
•
•
•
•
•
•
•
•
•
•
•
•
•
•
•
•
•
•
•
•
•
•
•
••
•
•
•
•
•
•
•
•
•
•
•
•
•
•
•
•
•
•
•
•
•
•
•
•
•
•
•
•
•
•
•
•
•
•
•
•
•
•
•
•
•
•
•
•
•
•
•
•
•
•
•
•
•
•
•
•
•
•
•
•
•
•
•
•
•
•
•
•
•
•
•
•
•
•
•
•
•
•
•
•
•
•
•
•
•
•
•
•
•
•
•
•
•
•
•
•
•
•
•
•
•
•
•
•
•
•
•
•
•
•
•
•
•
•
•
•
•
•
•
•
•
•
•
•
•
•
•
•
•
•
•
•
•
•
•
•
•
•
•
•
•
•
•
•
•
•
•
•
•
•
•
•
•
•
•
•
•
•
•
•
•
••
•
•
•
•
•
•
•
•
•
•
•
•
•
•
•
•
•
•
•
•
•
•
•
•
•
•
•
•
•
••
•
•
•
•
•
•
•
•
•
•
•
•
•
•
•
•
•
•
•
•
•
•
•
•
•
•
•
•
•
•
•
•
•
•
•
•
•
•
•
•
•
•
•
•
•
•
•
•
•
•
•
•
•
•
•
•
•
•
•
•
•
•
•
•
•
•
•
•
•
•
•
•
•
•
•
•
•
•
•
•
•
•
•
•
•
•
•
•
•
•
•
•
•
•
•
•
•
•
•
•
•
•
•
•
•
•
•
•
•
•
•
•
•
•
•
•
•
•
•
•
•
•
•
••
•
•
•
•
•
•
•
•
•
•
•
•
•
•
•
•
•
•
•
•
•
•
•
•
•
•
•
•
•
•
•
•
•
•
•
•
•
•
•
•
•
•
•
•
•
•
•
•
•
•
•
•
•
•
•
•
•
•
•
•
•
•
•
•
•
•
•
•
•
•
•
•
•
•
•
•
•
•
•
•
•
•
•
•
•
•
•
•
•
•
•
•
•
•
•
•
•
•
•
•
•
•
•
•
•
•
•
•
•
•
•
•
•
•
•
•
•
•
•
•
•
•
•
•
•
•
•
•
•
•
•
•
•
•
•
•
•
•
•
••
•
•
•
•
•
•
•
•
•
•
•
•
•
•
•
•
•
•
•
•
•
•
•
•
•
•
•
•
•
•
•
•
•
•
•
•
•
•
•
•
•
•
•
•
•
•
•
•
•
•
•
•
•
•
•
•
•
•
•
•
•
•
•
•
•
•
•
•
•
•
•
•
•
•
•
•
•
•
•
•
•
•
•
•
•
••
•
•
•
•
•
•
•
•
•
•
•
•
•
•
•
•
•
•
•
•
•
•
•
•
•
•
•
•
•
•
•
•
•
•
•
•
•
•
•
•
•
•
•
•
•
•
•
•
•
•
•
•
•
•
••
•
•
•
•
•
•
•
•
•
•
•
•
•
•
•
•
•
•
•
•
•
•
•
•
•
•
•
•
•
••
•
•
•
•
•
•
•
•
•
•
•
•••
•
•
•
•
•
•
•
•
•
•
•
•
•
•
•
•
•
•
•
•
•
•
•
•
•
•
•
•
•
•
•
•
•
•
•
•
•
•
•
•
•
•
•
•
•
•
•
•
•
•
•
•
•
•
•
•
•
•
•
•
•
•
•
•
•
•
•
•
•
•
•
•
•
•
•
•
•
•
•
•
•
•
•
•
•
•
•
•
•
•
•
•
•
•
•
•
•
•
•
•
•
•
•
•
•
•
•
•
•
•
•
•
•
•
•
•
•
•
•
•
•
•
•
•
•
•
••
•
•
•
•
•
•
•
•
•
•
•
•
•
•
•
•
•
•
•
•
•
•
•
•
•
•
•
•
•
•
•
•
•
•
•
•
•
•
•
•
•
•
•
•
•
•
•
•
•
•
•
•
•
•
•
•
•
•
•
•
•
•
•
•
•
•
•
•
•
•
•
•
•
•
•
•
•
•
•
•
•
•
•
•
•
•
•
•
•
•
•
•
•
•
•
•
•
•
•
•
•
•
•
•
•
•
•
•
•
•
•
•
•
•
•
•
•
•
•
•
•
•
•
•
•
•
•
•
•
•
•
•
•
•
••
•
•
•
•
•
•
•
•
•
•
•
•
•
•
•
•
•
•
•
•
•
•
•
•
•
•
•
•
•
•
•
•
•
•
•
•
•
•
•
•
•
•
••
•
•
•
•
•
•
•
•
•
•
•
•
•
•
•
•
•
•
•
•
•
•
•
•
••
•
•
•
•
•
•
•
•
•
•
•
•
•
•
•
•
•
•
•
•
•
•
•
•
•
•
•
•
•
•
•
•
•
•
•
•
•
•
•
•
•
•
•
•
•
•
•
•
•
•
•
•
•
•
•
•
•
•
•
•
•
•
•
•
•
•
•
•
•
•
•
•
•
•
•
•
•
•
••
•
•
•
•
•
•
•
•
••
•
•
•
•
•
•
•
•
•
•
•
•
•
•
•
•
•
•
•
•
•
•
•
•
•
•
•
•
•
•
•
•
•
•
•
•
•
•
•
•
•
•
•
•
•
•
•
•
•
•
•
•
•
•
•
•
•
•
•
•
•
•
•
•
•
•
•
•
•
•
•
•
•
•
•
•
•
•
•
•
•
•
•
•
•
•
•
•
•
•
•
•
•
•
•
•
•
•
•
•
•
•
•
•
•
•
•
•
•
•
•
•
•
•
•
•
•
•
•
•
•
•
•
•
•
•
•
•
•
•
•
•
•
•
•
•
•
•
•
•
•
•
•
•
•
•
•
•
•
••
••
•
•
•
•
•
•
•
•
•
•
•
•
•
•
•
•
•
•
•
•
•
•
•
•
•
•
•
•
•
•
•
•
•
•
•
•
•
•
•
•
•
•
•
•
•
•
•
•
•
•
•
•
•
•
•
•
•
•
•
•
•
•
•
•
•
•
•
•
•
•
•
•
•
•
•
•
•
•
•
•
•
•
•
•
•
•
•
•
•
•
•
•
•
•
•
•
•
•
•
•
•
•
•
•
•
•
•
•
•
•
•
•
•
•
•
•
•
•
•
•
•
•
•
•
•
•
•
•
•
•
•
•
•
•
•
•
•
•
•
•
•
•
•
•
•
•
•
•
•
•
•
•
•
•
•
•
•
•
•
•
••
•
•
•
•
•
•
•
•
•
•
•
•
•
•
•
•
•
•
•
•
•
•
•
•
•
•
•
•
•
•
•
•
•
•
•
•
•
years since seroconversion
CD4 count (cells/microL)
0246810
0
50
100
200
400
600
800
1000
1200
1400
AIDS < 3.5
AIDS 3.5 to 7
AIDS > 7
no AIDS > 9
Retrovirology 2007, 4:65 />Page 4 of 9
(page number not for citation purposes)
For a direct comparison of the form of both curves, we
also show the CD4 trajectory, standardized to the HIV
RNA level ten years after seroconversion (i.e. the values in
the CD4 curve are divided by 9.09 on the relative risk
scale, such that values are the same at ten years after sero-
conversion). It is seen that, during the first years, average
standardized CD4 T-cell count increases a little bit more
than average viral load does, but differences are small and
far from significant (confidence intervals overlap in figure
3).
The variance of the residual error term for CD4 T-cell
count ranged from 0.91 before 1988 to 0.54 after 1991
(on the cube root scale). For viral load, the variance of the
residual error term was 0.49 (on the base-10 logarithmic
scale). Hence, using that 95% of the short term variation
and measurement error is between the range -1.96 ×
standard deviation and +1.96 × standard deviation, on the
logarithmic relative AIDS risk scale, this corresponds to
1.422 × 2 × 1.96 × 0.49 = 3.9 for viral load and 0.5801 ×
2 × 1.96 × 0.54 = 1.7 to 0.5801 × 2 × 1.96 × 0.91 = 2.2 for
CD4 T-cell count. Hence, CD4 T-cell count can be meas-
ured more reliably than viral load.
Marker evolution before AIDS diagnosis
In the model of marker evolution during the four years
preceding AIDS diagnosis, the fitted HIV RNA increase
(on the base-10 logarithmic scale) was 0.167 (95% CI
0.101 to 0.231) per year from 4 to 1.5 years before AIDS
diagnosis, and 0.223 (95% CI 0.138 to 0.314) per year for
the last 1.5 years before AIDS diagnosis. The 0.057 change
in slope between the two periods was not statistically sig-
nificant (95% CI – 0.065 to 0.182). For CD4 T-cell count,
on the other hand, the decline (on cube root scale)
changed from -0.43 to -1.27 per year at 1.5 years before
AIDS diagnosis, and this change in slope was significant
(95% CI 0.66 to 1.02). When evaluated on the logarith-
mic relative AIDS risk scale, the RNA slope changes from
0.167 × 1.422 = 0.24 to 0.223 × 1.422 = 0.32, whereas the
CD4 slope changes from 0.43 × 0.5801 = 0.25 to 1.27 ×
0.5801 = 0.74. Hence, CD4 T-cell count and HIV RNA
level show similar trends from 4 to 1.5 years before AIDS
diagnosis, but during the last 1.5 years CD4 T-cell count
changes more rapidly.
HIV RNA patterns over time after seroconversionFigure 2
HIV RNA patterns over time after seroconversion. Scatterplot of HIV RNA values after seroconversion (grey points),
together with the fitted least squares curve (i.e. average HIV RNA values; thin grey line) and the fitted curve from the random
effects model (i.e. average HIV RNA patterns; thick black line, with 95% confidence intervals). Average patterns for the groups
defined by progression times (in years) are shown as well (dashed grey lines).
•
•
•
•
•
•
•
•
•
•
•
•
•
•
•
•
•
•
•
•
•
•
•
•
•
•
•
•
••
•
•
•
•
•
•
•
•
•
•
•
•
•
•
•
•
•
••
•
•
•
•
•
•
•
•
•
•
•
•
•
•
•
•
•
•
•
•
•
•
•
•
•
•
•
•
•
•
•
•
•
•
•
•
•
•
•
••• •
•
•
•
•
•
•
•
••
•
•
•
••
•
•
•
•
•••
•
•
•
•
•
•
•
•
•
•
•
•
•
•
•
•
•
•
•
•
•
•
•
•
•
•
••
•
•
•
•
•
•
•
•
•
•
•
•
•
•
•
•
•
••
•
•
•
•• •• • •
•
•
•••
•
•
•
•
•
•
•
•
•
•
•
•
•
•
•
•
•
•
•
•
•
•••
•
•
•••• ••• ••• • • • • • ••••• • • • •••
•
•
•
•
•
•
•
•
•
•
•
•
•
•
•• •
•
•
•
•
•
•
•••
•
•
•
•
•
•
•
•
•
•
•
•
•
•
•
•
•
•
•
•
•
•
•
•
•
•
•
•
•
•
•
•
•
•
•
•
•
•
•
•
•
•
•
•
•
•
•
•
•
•
••
•
•
•
•
•
•
•
•
•
•
•
•
•
•
•
•
•
•
•
•
•
•
•
•
•
•
•
•
•
•
•
•
•
•
•
•
•
•
•
•
•
•
•
•
•
•
•
•
•
•
•
•
•
•
•
•
•
•
•
•
•
•
•
•
•
•
•
•
•
•
•
•
•
•
•
••••
•
•
•
•
•
•
•
•
•
•
••
•
•
•
•
•
•
•
•
•
•
•
•
•
•
•
•
•
•
•
•
•
•
•
•
•
•
•
•
•
•
•
•
•
•
•
•
•
•
•
•
•
•
•
•
•
•
•
•
•
•• ••
•
•
•
•
•
•
••
•
•
•
•
•
•
•
•
•
•
•
•
•
•
•
•
•
•
•
•
•••• •
•
•
•
•
•
•
•
•
•
•
•
•
•
•
•
•
•
•
•
•
•
•
•
•
•
•
•
•
•
•
•
•
••
•
•
•
•
•
•
•
•
•
•
•
•
•
•
•
•
•
•
•
•
•
•
•
•
•
•
•
••
•
•
•
•
•
•
•
•
•
•
•
•
•
•
•
•
•
•
•
•
•
•
•
•
•
•
•
•
•
•
•
•
•
•
•
•
•
•
•
•
•
•
•• • • •
•
•
•
•
•
•
•
•
•
•
•
•
•
•
•
•
•
•
•
•
•
•
•
•
•
•
•
•
•
•
•
•
•
•
•
•
•
•
•
•
•
•
•
•
•
•
•
•
•
•
•
•
•
•
•
•
•
•
•
•
•
•
•
•••
•
•
•
•
•
•
•
•
•
•
•
•
•
•
•
•
•
•
•
•
•
•
•
•
•
•
•
•
•
•
•
•
•
•
•
•
•
•
•
•
•
•
•
•
••
•
••
•
•
•
•
•
•
•
•
•
•
•
•
•
•
•
•
•
•
•
•
•
••• •
•
•
•
•
•
•
•
•
•
•
•
•
•
•
•
•
•
•
•
•
•
•
•
•
•
•
•
•
•• •
•
•
•
•
•
••
•
•
•
•
•
•
•
•
•
•
•
•
•
•
•
•
••
•
•
•
•
•
•
•
•
•
•
•
•
•
•
•
•
•
•
•
•
•
•
•
•
•
•
•
•
•
•
•
•
•
••
•
•
•
•
•
•
•
•
•
•
•
•
•
•
•
•
•
•
•
•
••
•
•
•
•
•
•
•
•
•
•
•
•
•
•
•
•
•
•
•
•
•
•
•
•
•
•
•
•
•
•• ••
•
•
•
•
•
•
•
•
•
•
•
•
•
•
•
•
•
•
•
•
•
•
•
•
•
•
•
•
•
•
•
•
•
•
•
•
•
•
•
•
•
•
•
•
•
•
•
•
•
•
•
•
•
•
•
•
•
•
•
••
•
•
•
•
•
•
•
•
••
•
••
•
•
•
•
•
•
•
•
••
•
•
•
•
•
•
•
•
•
••
•
•
•
•
•
•
•
••
•
•
•
•
•
•
•
•
•
•
•
•
•
•
•
•
•
•
•
•
•
•
•
•
•
•
•
•
•
•
•
•
•
•
•
•
•
•
•
•
•
•
•
•
•
•
•
•
•
•
•
•
•
•
•
•
•
•
•
•
•
•
•
•
•
•
•
•
•
•
•
•
•
•
•
•
•
•
•
•
•
•
•
•
•
•
•
•
•
•
•
•
•
•
•
•
•
•• • • • •
•
•
•
•
•
•
•
•
•
•
•
•
•
•
•
•
•
•
•
•
•
•
•
•
•
•
•
•
•
•
•
•
•
•
•
•
•
•
•
•
•
•
•
•
•
•
•
•
•
•
•
••••
•
•
•
••
•
•
•
•
•
•
••
•
•
•
•
•
•
•
•
•
•
•
•
•
•
•
•
••
•
•
•
•
•
•
•
•
•
•
•
•
•
••
•
•
•
•
•
•
•
•
••• • ••• •
•
•
•
•
•
•
•
•
•
•
•
•
•
•
•
•
•
•
•
•
•
••
•
•
•
••
•
•
•
•
•
•
•
•
•
•
•
•
•
•
•
•
•
•
•
•
•
•
•
•
•
•
•
•
•• •
•
•
•
•
•
•
•
••
•
•
•
•
•
•
•
•
•
•
•
•
•
•
•
•
•
•
•
•
•
•
•
•
•
•
•
•
•
••
•
•
•
•
•
•
•
••
•
•
•
•
•
•
•
•••••
•
•
•
•
•
•
•
•
•
•
•
•
•
•
•
•
•
•
•
•
•
•
•
•
•
•
•
•
•
•
•
•
•
•
•
•
•
•
•
•
•
•
•
•••
•
•
•
•
•
•
•
•
•
••
•
•
•
•
•
•
•
•
•• •
•
•
•
•
•
•
•
•
•
•
•
•
•
•
•
•
•
•
•
•
•
•
•
•
•
•
•
•
•
•
•
•
•
•
•
•
•
•• ••
•
•
••
•
•
•
•
•
•
•
•
••
••
•
•
•
•
•
•
•
•
•
•
••
•
•
•
•
•
•
•
•
•
•
•
•
•
•
•
•
•
•
•
•
•
•
•
•
•
•
•
•
•
•
•
•
•
•
•
•
•
•
•
•
•
•
•
•
•
•
•
•
•
•
•
•
•
•
•
•
•
•
•
•
•
•
•
•
•
•
•
•
•
•
•
•
•
•• ••
•
•
•
•
••
•
•
•
•
•
•
•
•
•
•
•
•
•
•
•
•
•
•
•
•
•
•
•
•
•
•
•
•
•
•
•
•
•
•• • •
•
••
•
••
•
•
•
•
•
•
•
•
•
•
•
•
•
•
•
•
•
•
•
•
•
•
•
•
•
•••• ••• •••••
•
•
•
•
•
•
•
•
•
•
•
•
•
•
•
•
•
•
•
•
•
•
•
•
•
•
•
•
•
•
•
•
•
•
•
•
•
•
•
••
•
•
•
•
•
•
•
•
•
•
•
•
•
•
•
•
•
•
•
•
•
•
•
•
•
•
•
•
•
•
•
•
•
•
•
•
•
•
••
•
•
•
•
•
•
•
•
•
•
•
•
•
•
•
••
••
•
•
•
•
•
•
•
•
••
•
•
•
•
•
•
•
•
•
•
••• • • • • • •
•
•
•
•
•
•
•
•
•
•
•
•
•
•
•
•
•
•
•
•
•
•
•
•
•
•
•
•
•
•
•
•
•
•
•
•
•
•
•
•
•
•
•
•
•
•
•
•
•
•
•
••
•
•
•
•
•
•
•
•
•
•
•
•
•
•
•
•
• • •• ••
•
•
•
•
•
•
•
•
•
•
•
•
•
•
•
•
•
•
•
•
•
•
•
•
•
•
•
•
•
•
•
•
•
•
•
•
•
•
•
•
•
•
•
•
•
•
•
•
•
•
•
•
•
•
••
•
•
•
•
•
•
•
•
•
•
•
•
•
•
•
•
••
•
•
•
•
•
•
•
•
•
•
•
•
•
•
•
•
•
•
•
•
•
•
•
•
•
•
•
•
•
•
•
•
•
•
•
•
•
•
•
•
•
•
•
•
•
•
•
•
•
•
•
•
•
•
•
•
•
•
•
•
•
•
•
•
•
•
•
•
•
•
•
•
•
•
•
•
•
•
•
•
•
•
•
•
•
•
•
•
•
•
•
•
•
•
•
•
•
•
•
•
•
•
•
•
•
•
•
•
•
•
•
•
•
•
•
•
•
•
•
•
•
•
•
•
•
•
•
•
•
•
•
•
•
•
•
•
•
•
•
•
•
•
•
•
••
•
•
•
••
•
•
•
•
•
•
•
•
•
•
•
•
•
•
•
•
•
•
•
•
•
•
•
•
•
•
•
•
•
•
•
•
•
•
•
•
•
•
•
•
•
•
•
•
•
•
•
•
•
•
•
•
•
•
•
•
•
•
•
•
•
•
•
•
•
•
•
•
•
•
•
•
•
•
•
•
•
•
•
•
•
•
•
•
•
•
•
•
•
•
•
•
•
•
•
•
•
•
•
•
•
•
•
•
•
•
•
•
•
•
•
•
•
•
•
•
•
•
•
•
•
•
•
•
•
•
•
•
•
•
•
•
•
•
•
•
•
•
•
•
•
•
•
••
•
•
•
•
•
•
•
•
•
•
•
•
•
•
•
•
•
•
•
•
•
•
•
•
•
•
•
•
•
•
•
•
•
•
•
•
•
•
•
•
•
•
•
•
•
•
•
•
•
•
•
•
•
•
•
•
•
•
•
•
•
•
•
•
•
•
•
•
•
•
•
•
•
•
•
•
•
•
•
•
•
•
•
•
•
•
•
•
•
•
•
•
•
•
•
•
•
•
•
•
•
•
•
•
•
•
•
•
•
•
•
•
•
•
•
•
•
•
•
•
•
•
•
•
•
•
•
•
•
•
•
•
•
•
•
•
•
•
•
•
•
•
•
•
•
•
•
•
•
•
•
•
•
•
•
•
•
•
•
•
•
•
•
•
•
•
•
•
•
•
•
••
•
•
•
•
•
•
•
•
•
•
•
•
•
•
•
•
•
•
•
•
•
•
•
•
•
•
•
•
•
•
•
•
•
•
•
•
•
•
•
•
•
•
•
•
•
•
•
•
•
•
•
•
•
•
•
•
•
•
•
•
•
•
•
•
•
•
•
•
•
•
•
•
•
•
•
•
•
•
•
•
•
•
•
•
•
•
•
•
•
•
•
•
•
•
•
•
•
•
•
•
•
•
••
•
•
•
•
•
•
•
•
•
•
•
•
•
•
•
•
•
•
•
•
•
•
•
•
•
•
•
•
•
•
•
•
•
•
•
•
•
•
•
•
•
•
•
•
•
•
•
•
•
•
•
•
•
•
•
•
•
•
•
•
•
•
•
•
•
•
•
•
•
•
•
•
•
•
•
•
•
•
•
•
•
•
•
•
•
•
•
•
•
•
•
•
•
•
•
•
•
•
•
•
•
•
•
•
•
•
•
•
•
•
•
•
•
•
•
•
•
•
•
•
•
•
•
•
•
••
•
•
•
•
•
•
•
•
•
•
•
•
•
•
•
•
•
•
•
•
•
•
•
•
•
•
•
•
•
•
•
•
•
•
•
•
•
•
•
•
•
•
•
•
•
•
•
•
•
•
•
•
••
•
•
•
•
•
•
•
•
•
•
•
•
•
•
•
•
•
•
•
•
•
•
•
•
•
•
•
•
•
•
•
•
•
•
•
•
•
•
•
•
•
•
•
•
•
•
•
•
•
•
•
•
•
•
•
•
•
•
•
•
•
•
•
•
•
•
•
•
•
•
•
•
•
•
•
•
••
•
•
•
•
•
•
•
•
•
•
•
•
•
•
•
•
•
•
•
•
•
•
•
•
•
•
•
•
•
•
•
•
•
•
•
•
•
•
•
•
•
•
•
•
•
•
•
•
•
•
•
•
•
•
•
•
•
•
•
•
•
•
•
•
•
•
•
•
•
•
•
•
•
•
•
•
•
•
•
•
•
•
•
•
•
•
•
•
•
•
•
•
•
•
•
•
•
•
•
•
•
•
•
•
•
•
•
•
•
•
•
•
•
•
•
•
•
•
•
•
•
•
•
•
•
•
•
•
•
•
•
•
•
•
•
•
•
•
•
•
•
•
•
•
•
•
•
•
•
•
•
•
•
•
•
•
•
•
•
•
•
•
•
•
•
•
•
•
•
•
•
•
•
•
•
•
•
•
•
•
•
•
•
•
•
•
•
•
•
•
•
•
•
•
•
•
•
•
•
•
•
•
•
•
•
•
•
•
•
•
•
•
•
•
•
•
•
•
•
•
•
•
•
•
•
•
•
•
•
•
•
•
•
•
•
•
•
•
•
•
•
•
•
•
•
•
•
•
•
•
•
•
•
•
•
•
•
•
•
•
•
•
•
•
•
•
•
•
•
•
•
•
•
•
•
•
•
•
•
•
•
•
•
•
•
•
•
•
•
•
•
•
•
•
•
•
•
•
•
•
•
•
•
••
•
•
•
•
•
•
•
•
•
•
•
•
•
•
•
•
•
•
•
•
•
•
•
•
•
•
•
•
•
•
•
•
•
•
•
•
•
•
•
•
•
•
•
•
•
•
•
•
•
•
•
•
•
•
•
•
•
•
•
•
•
•
•
•••• • • ••
•
•
•
•
•
•
•
•
•
•
•
•
•
•
•
•
•
•
•
•
•
•
•
•
•
•
•
•
•
•
•
•
•
•
•
•
•
•
•
•
•
•
•
•
•
•
•
•
•
•
•
•
•
•
•
•
•
•
•
•
•
•
•
•
•
•
•
•
•
•
•
•
•
•
•
•
•
•
•
•
•
•
•
•
•
•
•
•
•
•
•
•
•
•
•
•
•
•
•
•
•
•
•
•
•
•
•
•
•
•
•
•
•
•
•
•
•
•
•
•
•
•
•
•
•
•
•
•
•
•
•
•
•
•
•
•
•
•
•
•
•
•
•
•
•
•
•
•
•
•
•
•
•
•
•
•
•
•
• ••• • •
•
•
•
•
•
•
•
•
•
•
•
•
•
•
•
•
•
•
•
•
•
•
•
••
•
•
•
•
•
•
•
•
•
•
•
•
•
•
•
•
•
•
•
•
•
•
•
•
•
•
•
•
•
•
•
•
•
•
•
•
•
•
•
•
•
•
•
•
•
•
•
•
•
•
•
•
•
•
•
•
•
•
•
•
•
•
•
•
•
•
•
•
•
•
•
•
•
•
•
•
•
•
•
•
•
•
•
•
•
•
•
•
•
•
•
•
•
•
•
•
•
•
•
•
•
•
•
•
•
•
•
•
•
•
•
•
•
•
•
•
•
•
•
•
•
•
•
•
•
•
•
•
•
•
•
•
•
•
•
•
•
•
•
•
•
•
•
•
•
•
•
•
•
•
•
•
•
•
•
•
•
•
•
•
•
•
•
•
•
•
•
•
•
•
•
•
•
•••
•
•
•
•
•
•
•
•
•
•
•
•
•
•
•
•
•
•
•
•
•
•
•
•
•
•
•
•
•
•
•
•
•
•
•
•
•
•
•
•
•
•
•
•
•
•
•
•
•
•
•
•
•
•
•
•
•
•
•
•
•
•
•
•
•
•
•
•
•
•
•
•
•
•
•
•
•
•
•
•
•
•
•
•
•
•
•
•
•
•
•
•
•
•
•
•
•
•
•
•
•
•
•
•
•
•
•
•
•
•
•
•
•
•
•
•
•
•
•
•
•
•
•
•
•
•
•
•
•
•
•
•
•
•
•
•
•
•
•
•
•
•
•
•
•
•
•• •
•
•
•
•
•
•
•
•
•
•
•
•
•
•
•
•
•
•
•
•
•
•
•
•
•
•
•
•
•
•
•
•
•
•
•
•
•
•
•
•
•
•
•
•
•
•
•
•
•
•
•
•
•
•
•
•
•
•
•
•
•
•
•
•
•
•
•
••
•
•
•
•
•
•
•
•
•
•
•
•
•
•
•
•
•
•
•
•
•
•
•
•
•
•
•
•
•
•
•
•
•
•
•
•
•
•
•
•
•
•
•
•
•
•
•
•
•
•
•
•
•
•
•
•
•
•
•
•
•
•
•
•
•
•
•
•
•
•
•
•
•
•
•
•
•
•
•
•
•
•
•
•
•
•
•
•
•
•
•
•
•
•
•
•
•
•
•
•
years since seroconversion
HIVRNA (log-10 copies/mL)
0246810
2
3
4
5
6
AIDS < 3.5
AIDS 3.5 to 7
AIDS > 7
no AIDS > 9
Table 2: Parameter estimates for time-updated marker effects
on AIDS risk, based on bivariable model for both markers
-CD4
1/3
95% CI log10 RNA 95% CI
β
0.58 0.46–0.70 1.42 1.05–1.79
exp(
β
) 1.79 1.59–2.02 4.15 2.85–5.98
Retrovirology 2007, 4:65 />Page 5 of 9
(page number not for citation purposes)
Discussion
The aim of the study was to reconsider the existence of a
viral load setpoint and compare it with CD4 T-cell evolu-
tion after HIV seroconversion. This was done by modeling
average trajectories for both markers and presenting
results on a common scale as determined by AIDS risk.
The HIV RNA setpoint theory has been characterized by
three aspects: levels after the initial peak are predictive for
subsequent disease progression, a stable plateau phase
and an increase shortly before AIDS diagnosis.
Higher predictive value of viral load shortly after serocon-
version was not analysed here, since this has been shown
convincingly before [11,12]. Note that also in the current
analysis average HIV RNA level six months after serocon-
version was more clearly associated with time to AIDS
than CD4 T-cell count was. However, this result was based
on a stratification of marker evolution by progression
time to AIDS. In a genuine prediction model, stratification
cannot be based on the future.
We modelled the longitudinal evolution of the markers
using a scale that is related to AIDS progression. Our anal-
ysis showed that both markers revealed similar patterns
over time after seroconversion: after a very gradual change
in the first few years, the slope became increasingly steeper
longer after seroconversion. The same similarity between
both markers was found when patients were stratified by
progression time. Persons with slower AIDS progression
had more stable values for both markers during the first
years. Although shapes were similar, the average decline
in CD4 count corresponded to a much larger change in
AIDS risk than the average increase in viral load did. This
difference does not mean that CD4 count has the larger
predictive value for AIDS progression. In our model, the
markers were used as dependent variables and their evo-
lution was modelled over time. Marker patterns were aver-
aged over all individuals, also the ones who developed
AIDS shortly after seroconversion. In a predictive model,
a future AIDS event is the dependent variable, and predic-
tion at some point after seroconversion is based on
marker values for individuals who are still AIDS free. In
the time-dependent Cox analysis (table 2), the markers
were used as predictors, but this model was only used to
determine an appropriate scale for the longitudinal
marker analysis. Actually, except for the first two years
after seroconversion, during which viral load had higher
predictive value, the markers have been shown to have
similar predictive value for the probability to develop
AIDS within three years [12].
Marker evolution on the AIDS hazard scaleFigure 3
Marker evolution on the AIDS hazard scale. Average marker evolution after seroconversion, represented on AIDS risk
scale (grey area: 95% CI). Left y-axis shows effects of fitted average marker patterns on AIDS hazard, relative to hazard at aver-
age values at seroconversion (656 cells/
μ
L for CD4 T-cell count and 10
4.3
= 19952 copies/mL for HIV RNA level). Right y-axis
shows corresponding fitted marker values over time after seroconversion. Dashed grey line shows CD4 effect standardized to
HIV RNA value ten years after seroconversion (i.e. the CD4 curve is moved downward, such that it corresponds with the HIV
RNA curve at ten years after seroconversion; the 95% CI is rescaled as well).
years since seroconversion
hazard ratio
0246810
1
2
5
10
20
CD4
RNA
CD4 / RNA
656 / 4.3
421 / 4.8
207 / 5.4
105 / 5.9
44 / 6.4
Retrovirology 2007, 4:65 />Page 6 of 9
(page number not for citation purposes)
With respect to the third part of the setpoint theory, an
increase in HIV RNA level was present already several
years before AIDS diagnosis, and this slope did not change
significantly at 1.5 years before AIDS diagnosis. On the
other hand, a strong biphasic pattern was present for CD4
T-cell count.
For the modeling of the CD4 trajectories, the cube root
transformation was chosen for its better fit with the ran-
dom effects model we used. As the same scale turned out
to be useful when modeling AIDS risk as a function of
CD4 count, it was employed also to present results in fig-
ure 1. With different clinically relevant end points, like
death risk or probability to develop AIDS within a certain
time span, a different scale might be more appropriate to
present results. However, any clinically relevant scale that
represents AIDS or death risk will reflect that changes in
CD4 count are more important at low counts than at high
counts (see also Geskus et al. [12], in which a fourth root
transformation was used).
We argue against the use of cross-sectional methods and
scatterplots to describe the marker evolution in situations
where marker values affect dropout rate. Results were
strikingly different from the longitudinal approach. Since
HIV infected individuals with low CD4 T-cell count or
high viral load have a higher probability to die of AIDS,
slow progressors are overrepresented later after infection,
such that curves are biased upwards for CD4 T-cell count
and biased downwards for viral load. Also, for studies on
the effects of cofactors on marker evolution, the longitu-
dinal random effects approach is preferred. For example,
the cross-sectional approach may find no difference in
CD4 values between two groups due to cancellation of
effects: AIDS mortality at low CD4 count may be higher in
the group with the steepest decline, such that the average
CD4 value is equal in both groups. Although statistical
analyses of marker patterns usually use some sort of lon-
gitudinal model, the cross-sectional approach has been
applied as well. This holds not only for natural history
studies, but also for studies of treatment effect in which
part of the study group dies during the trial [13].
We modeled the simultaneous evolution of CD4 and viral
load using follow-up data from seroconversion until AIDS
diagnosis. The total follow-up is about equal to the
median time to AIDS (18 individuals had more than ten
years of follow-up). Hence, our results show marker evo-
lution only during the first half of the time-to-AIDS distri-
bution. However, the setpoint theory for viral load was
based on data with similar follow-up and introduction of
HAART has prevented study of longer-term evolution in a
natural history setting.
Conclusion
In summary, by using a common event (AIDS), we were
able to directly compare evolution of CD4 T-cell count
and HIV RNA level after HIV-1 seroconversion. Shortly
after seroconversion, HIV RNA level is more predictive
than CD4 T-cell count. However, a definition of setpoint
based on the level reached shortly after the primary infec-
tion phase has little clinical relevance, since a date of sero-
conversion is unknown for most diagnosed HIV infected
individuals. Also, the effect of sequential treatment inter-
ruptions cannot be evaluated based on the return to the
personal setpoint level, if such level only exists shortly
after seroconversion. Since both markers are frequently
monitored as part of clinical care, more recent informa-
tion on marker evolution is available. A setpoint, if
defined as a stable level for several years, holds as much
for CD4 T-cell count as for viral load, and only for a sub-
group of HIV infected individuals. Such a setpoint does
not preclude the need for frequent monitoring of viral
load in making the decision to start HAART, since the sta-
ble phase may end at any time. Since CD4 T-cell count can
be measured more reliably than viral load (a maximum of
2.2 versus 3.9), the end of the stable phase may be more
dificult to detect for viral load, which makes frequent
monitoring even more important for viral load than for
CD4 T-cell count. The third aspect of the setpoint con-
cerns the change from a stable phase to an increase in viral
load shortly before AIDS diagnosis. We did not find a sta-
ble phase for any of the markers in the last four years
before AIDS, but the evolution of CD4 T cell count is more
biphasic than the evolution of HIV RNA.
Methods
Data
We used data from two different sources, the Amsterdam
Cohort Study (ACS) among homosexual men and the
French ANRS SEROCO Cohort Study. Informed consent
was obtained from all participants.
Started in 1984, the ACS has required that participants be
free of AIDS-defining conditions at entry. In our analysis,
we included those with a period between the last HIV-
seronegative test and the first HIV-seropositive test of not
more than two years; we imputed their seroconversion
date via conditional mean imputation [14]. Follow-up
data from hospitals was added to ACS data.
The French SEROCO cohort started in 1988, has enrolled
HIV-infected, non-haemophiliac adults referred from 17
hospitals and a network of private practitioners. For rea-
sons of homogeneity, we analyzed only homosexual men
from the cohort. Like the ACS men, they had no more
than two years between the date of last HIV-seronegative
test and date of first HIV-seropositive test. Their date of
Retrovirology 2007, 4:65 />Page 7 of 9
(page number not for citation purposes)
seroconversion had been imputed as described in Hubert
et al. [15].
Data was drawn from the start of each study until HAART
was widely introduced in the two countries: July 1st, 1996
in the Netherlands and February 1st, 1996 in France. In
total, we used data from 400 persons (126 from Amster-
dam and 274 from France). The same data were previ-
ously used to investigate the causal pathways of the effects
of age and three genetic cofactors on AIDS development
[16].
Laboratory methods
All CD4 lymphocyte counts were obtained prospectively.
In Amsterdam, they were measured in one laboratory,
where single indirect immunofluorescence staining on
Ficoll-isolated peripheral blood mononuclear cells was
used until May 1988 and thereafter a double direct stain-
ing method. The Coulter Epics flow cytometer was used
until 1991, then replaced by a FASCAN. Each day, CD4
samples were compared with values from healthy HIV-
negative controls. In France, CD4 T-cell count measure-
ments originated from 17 laboratories, so changes in
method occurred more gradually. All HIV-1 RNA levels
were determined retrospectively from stored sera. In
France, the three participating university labs used reverse
transcriptase-polymerase chain reaction (Amplicor HIV-1
Monitor assay, Roche Molecular Systems, Neuilly-sur-
Seine, quantification threshold 200 copies/mL). In
Amsterdam, one laboratory performed all HIV RNA
assays. Most (83.6%) of the measurements were based on
the NASBA technique (NASBA HIV-1 RNA QT; Organon
Teknika, Boxtel, The Netherlands, quantification thresh-
old 1000 copies/mL). The remaining were based on the
Amplicor (2.4%) or the Nuclisens (14%) technique. Since
the Amplicor test gives lower values, a correction factor
was applied (on base-10 logarithmic HIV-RNA scale:
3.5–4.5: +0.04; 4.5–5.5: +0.22; >5.5: +0.29 [17]).
Statistical methods
A bivariate quadratic random effects model was used to
describe the simultaneous evolution of CD4 T-cell count
and viral load after HIV-1 seroconversion (as in Geskus et
al. [16]). The trajectory of each marker was thereby
allowed to follow a polynomial trend over time since
seroconversion, which can differ per individual. The six
parameters per individual (the intercept, slope, and quad-
ratic term for each marker) were assumed to originate
from a multivariate normal distribution. The mean of this
distribution yields the average trajectories at the popula-
tion level. HIV RNA levels below the detection limit were
treated as left-censored [18]. Since the viral load peaks
shortly after infection, we allowed for a change in the
slope of viral load evolution at six months after serocon-
version (for CD4 T-cell count, no temporary drop was
seen in our data). We only used data from the pre-HAART
era. Still, less potent anti-retroviral therapy (ART) may
have had some temporary effect on marker evolution. The
effect of ART was incorporated as in Hubert et al. [7]. Zido-
vudine monotherapy was allowed to affect both marker
levels for one year, with a change in effect after six
months. In the case of dual therapy, the second period
lasted for nine months instead of six. Contrary to Hubert
et al., effect sizes were estimated from our data. We
included a calendar time effect for both average CD4 T-
cell count and the variance of the residual (measurement)
error term. Changes in 1988 and 1991 for Amsterdam cor-
respond with changes in laboratory methods. For France,
where CD4 data originate from different laboratories, we
assumed a change in 1991, resulting in about equal
number of measurements in both periods. Moreover, we
allowed each laboratory to measure, on average, a differ-
ent value for CD4 T-cell count (random laboratory effect).
Since HIV RNA values were measured retrospectively
within a short time period in only a few laboratories, no
change occurred in laboratory method. Therefore, we
assumed the standard deviation for the residual error term
of viral load to remain constant. However, we included a
calendar period effect on the overall level, since viral load
was measured retrospectively from stored samples that
may yield different values depending on their age. To
describe the simultaneous evolution of CD4 T-cell count
and viral load in the four years preceding AIDS diagnosis,
a linear random effects model was fitted to the marker
data from the subset of individuals with an AIDS diagno-
sis. In order to detect a change in marker trend shortly
before AIDS diagnosis, the slope was allowed to change at
1.5 years before AIDS diagnosis.
In all random effects models, marker values were trans-
formed in order to provide a better fit: the base-10 loga-
rithm of viral load and the cube root of CD4 T-cell count
(CD4
1/3
) were used [19]. The clinically relevant marker
scale on which results are evaluated was determined by
modeling the effect of time-updated marker values on
AIDS risk in a Cox proportional hazards model. Fitted
marker values based on the random effects estimates were
used, and functional form was established via low-rank
thin-plate splines [20]. Marker evolution over time was
depicted graphically such that changes in marker value
that induce similar changes in relative AIDS risk have
equal distance. Presence of a more or less stable level was
investigated. Average curves were shown for the whole
population and for four subgroups of individuals desig-
nated by their disease progression [9]: AIDS occurring
<3.5 years, 3.5 to 7 years or >7 years after seroconversion,
and AIDS-free for more than 9 years after seroconversion.
Also, results from this longitudinal approach, describing
average marker patterns, were compared with our results
Retrovirology 2007, 4:65 />Page 8 of 9
(page number not for citation purposes)
from a repeated cross-sectional approach. The repeated
cross-sectional approach summarizes the available
marker values at each point in time for the individuals
who are still alive and in follow-up: a least squares curve
or a lowess curve is fitted through the scatterplot data
[7,21,22]. In a discrete version of this approach, the mean
or median marker value over time periods of equal length
(usually a year) is computed and these values are con-
nected over time [23-25]. Whereas the repeated cross-sec-
tional approach quantifies the change in average marker
value over time, the longitudinal approach quantifies the
average change in marker value over time; note the differ-
ent position of "average".
CD4 T-cell count and HIV RNA level cannot be compared
directly. However, using our AIDS risk scale, the average
trajectories of the two markers were compared in one
graph.
We used a Bayesian approach for estimation of the param-
eters, starting with non-informative priors. We used a ran-
dom effects selection model similar to the one used by
Faucett & Thomas [26], except that ours included the evo-
lution of viral load. Posterior distributions were obtained
via Markov chain Monte Carlo methods, using the Win-
BUGS program [27,28]. Three chains were generated,
based on different sets of starting values. Parameter esti-
mates are the medians of the posterior distributions. The
range from the 2.5% to the 97.5% quantile is used to
quantify the uncertainty in the parameter estimates. This
range can be interpreted as a 95% confidence intervals
(CI) and will be referred to as such. If the value "zero" is
outside this interval, the effect is seen as statistically signif-
icant.
Model in formula form
In formula form, the model for the concurrent evolution
of the markers is
with
and all
ε
1
and
ε
2
independent.
ε
1
and
ε
2
model measure-
ment error and short-term variation. The , and ,
k = 1, 2 describe the individual random effects. We allow
the HIV-1 RNA level to have a different slope in the first
six months after seroconversion (parameter
δ
2
). Finally,
the effects of calendar period and ART use on CD4 T-cell
count and HIV-1 RNA level are represented by and
.
The effect of the markers on the hazard of AIDS was
described in a Cox model via
where g and h describe smooth trends on AIDS risk for
CD4 T-cell count and HIV RNA level, using low-rank thin-
plate splines [20].
Competing interests
The author(s) declare that they have no competing inter-
ests.
Authors' contributions
RG: main author, substantial contributions to conception
and design, analysis and interpretation of data MP: sub-
stantial contributions to conception and design, analysis
and interpretation of data JH: substantial contributions to
analysis and interpretation of data FM: substantial contri-
butions to conception and design and acquisition of data
BB: substantial contributions to conception and design
and acquisition of data CR: substantial contributions to
conception and design JD: substantial contributions to
conception and design LM: substantial contributions to
conception and design, acquisition of data, and interpre-
tation of data All authors read and approved the final
manuscript.
Acknowledgements
We wish to thank Anneke Krol for the data management and Lucy Phillips
for critically reading the manuscript.
This study was supported by a grant from the Ensemble contre le Sida (Fon-
dation pour la Recherche Médicale-Sidaction; project 23025-00-09/AO10-
1) and the Dutch AIDS Fund (project 1618).
The Amsterdam Cohort Studies on HIV infection and AIDS, a collaboration
between the Amsterdam Health Service, the Academic Medical Center of
the University of Amsterdam, Sanquin Blood Supply Foundation and the
University Medical Center Utrecht, are part of the Netherlands HIV Mon-
itoring Foundation and financially supported by the Netherlands National
Institute for Public Health and the Environment. The ANRS SEROCO Study
Group is a collaboration funded by the Agence Nationale de Recherches
sur le Sida et les Hépatites Virales (ANRS).
References
1. Henrard DR, Phillips JF, Muenz LR, Blattner WA, Wiesner D, Eyster
E, Goedert JJ: Natural History of HIV-1 Cell-Free Viremia.
JAMA 1995, 274:554-558.
CD
RNA
cal ART
4
13
10
11 1
2
11
()
log ( )
/
t
t
abtct
ii i
⎛
⎝
⎜
⎜
⎞
⎠
⎟
⎟
=
++ ++ +
qz ee
dqze
1
22 2
2
20522 2
()
()
(.)
t
abtct tI t
ii i
t
++ + ++ +
⎛
⎝
⎜
⎜
<
cal ART
⎞⎞
⎠
⎟
⎟
(,,, , ,)~ (((), ,, , , ),abcab c l
iiii iiT T
111 222 1 11 2 2 2
αβγαβγ
site
Σ))
()~ ( , )
()
()~ ( , )
()~ ( , )
αμσ
αμ
εσ
ετ
1
2
1
1
2
2
2
0
0
l
l
t
t
FF
AA
lab
cal
=
a
k
i
b
k
i
c
k
i
θ
k
cal
ζ
k
ART
λλ
iiiiiii
ttgabtctabtct( ) ( )exp{ ( ) ( )},=+++++
0111
2
22 2
2
h
Publish with BioMed Central and every
scientist can read your work free of charge
"BioMed Central will be the most significant development for
disseminating the results of biomedical research in our lifetime."
Sir Paul Nurse, Cancer Research UK
Your research papers will be:
available free of charge to the entire biomedical community
peer reviewed and published immediately upon acceptance
cited in PubMed and archived on PubMed Central
yours — you keep the copyright
Submit your manuscript here:
/>BioMedcentral
Retrovirology 2007, 4:65 />Page 9 of 9
(page number not for citation purposes)
2. Ho DD: Viral Counts Count in HIV Infection. Science 1998,
272:1124-1125.
3. de Wolf F, Spijkerman I, Schellekens PT, Langendam M, Kuiken C,
Bakker M, Roos M, Coutinho R, Miedema F, Goudsmit J: AIDS prog-
nosis based on HIV-1 RNA, CD4+ T-cell count and function:
markers with reciprocal predictive value over time since
seroconversion. AIDS 1997, 11:1799-1806.
4. Katzenstein TL, Pedersen C, Nielsen C, Lundgren JD, Jakobsen PH,
Gerstoft J: Longitudinal serum HIV RNA quantification: Cor-
relation to viral phenotype at seroconversion and clinical
outcome. AIDS 1996, 10:167-173.
5. Vidal C, Garcia F, Romeu J, Ruiz L, Miro JM, Cruceta A, Soriano A,
Pumarola T, Clotet B, Gatell JM: Lack of evidence of a stable viral
load set-point in early stage asymptomatic patients with
chronic HIV-1 infection. AIDS 1998, 12:1285-1289.
6. O'Brien TR, Rosenberg PS, Yellin F, Goedert JJ: Longitudinal HIV-
1 RNA Levels in a Cohort of Homosexual Men. J Acquir Immune
Defic Syndr Hum Retrovirol 1998, 18(2):155-161.
7. Hubert JB, Burgard M, Dussaix E, Tamalet C, Deveau C, Le Chenadec
J, Chaix ML, Marchadier E, Vildé JL, Delfraissy JF, Meyer L, the
SEROCO Study Group: Natural history of serum HIV-1 RNA
levels in 330 patients with a known date of seroconversion.
AIDS 2000, 14:123-131.
8. Sabin CA, Devereux H, Phillips AN, Hill A, Janossy G, Lee CA, Love-
day C: Course of Viral Load Throughout HIV-1 Infection. J
Acquir Immune Defic Syndr Hum Retrovirol 2000, 23(2):172-177.
9. Lyles RH, Muñoz A, Yamashita TE, Bazmi H, Detels R, Rinaldo CR,
Margolick JB, Phair JP, Mellors John W, for the Multicenter AIDS
Cohort Study: Natural History of Human Immunodeficiency
Virus Type 1 Viremia after Seroconversion and Proximal to
AIDS in a Large Cohort of Homosexual Men. The Journal of
Infectious Diseases 2000, 181:872-880.
10. Touloumi G, Pantazis N, Babiker AG, Walker SA, Katsarou O, Kara-
foulidou A, Hatzakis A, Kholoud Porter, on behalf of the CASCADE
Collaboration: Differences in HIV RNA levels before the initi-
ation of antiretroviral therapy among 1864 individuals with
known HIV-1 seroconversion dates. AIDS 2004, 18:1697-1705.
11. Mellors JW, Muñoz A, Giorgi JV, Margolick JB, Tassoni CJ, Gupta P,
Kingsley LA, Todd JA, Saah AJ, Detels R, Phair JP, Rinaldo CR:
Plasma Viral Load and CD4
+
Lymphocytes as Prognostic
Markers of HIV-1 infection. Annals of Internal Medicine 1997,
126:946-954.
12. Geskus RB, Miedema FA, Goudsmit J, Reiss P, Schuitemaker H,
Coutinho RA: Prediction of Residual Time to AIDS and Death
Based on Markers and Cofactors. J Acquir Immune Defic Syndr
Hum Retrovirol 2003, 32(5):514-521.
13. Morris L, Martin DJ, Bredell H, Nyola SN, Sacks L, Pendle S, Page-
Shipp L, Karp CL, Sterling TR, Quinn TC, Chaisson RE: Human
Immunodeficiency Virus-1 RNA Levels and CD4 Lym-
phocyte Counts, during Treatment for Active Tuberculosis,
in South African Patients. Journal of Infectious Diseases 2003,
187:1967-1971.
14. Geskus RB: On the inclusion of prevalent cases in HIV/AIDS
natural history studies through a marker-based estimate of
time since seroconversion. Statistics in Medicine 2000,
19:1753-1769.
15. Carré N, Deveau C, Belanger F, Boufassa F, Persoz A, Jadand C, Rouz-
ioux C, Delfraissy J, Bucquet D: Effect of age and exposure group
on the onset of AIDS in heterosexual and homosexual HIV-
infected patients. AIDS 1994, 8(6):797-802.
16. Geskus RB, Meyer L, Hubert JB, Schuitemaker H, Berkhout B, Rouz-
ioux C, Theodorou ID, Delfraissy JF, Prins M, Coutinho RA: Causal
pathways of the effects of age and the CCR5-32, CCR2-64I and
SDF-1 3'A alleles on AIDS development. J Acquir Immune Defic
Syndr Hum Retrovirol 2005, 391(3):321-326.
17. Annales du contrôle national de qualité: Agence Française de securité
sanitaire des produits de santé, No. 17 1999.
18. Hughes JP: Mixed effects Models with Censored Data with
Application to HIV RNA Levels. Biometrics 1999, 55:625-629.
19. Taylor JMG, Law N: Does the Covariance Structure Matter in
Longitudinal Modelling for the Prediction of Future CD4
Counts? Statistics in Medicine 1998, 17:2381-2394.
20. Crainiceanu C, Ruppert D, Wand M: Bayesian Analysis for Penal-
ized Spline Regression Using WinBUGS. Journal of Statistical
Software 2005, 14(14): [ />].
21. Margolick JB, Donnenberg AD, Muñoz A, Park LP, Bauer KD, Giorgi
JV, Ferbas J, Saah AJ, the Multicenter AIDS Cohort Study: Changes
in T and Non-T Lymphocyte Subsets Following Seroconver-
sion to HIV-1: Stable CD3
+
and Declining CD3
-
Populations
Suggest Regulatory Responses Linked to Loss of CD4 Lym-
phocytes. Journal of Acquired Immune Deficiency Syndromes 1993,
6:153-161.
22. Margolick JB, Muñoz A, Donnenberg AD, Park LP, Galai N, Giorgi JV,
O'Gorman MRG, John Ferbas for the Multicenter AIDS Cohort
Study: Failure of T-cell homeostasis preceding AIDS in HIV-1
infection. Nature in Medicine 1995, 1(7):674-680.
23. Schellekens PTA, Tersmette M, Roos MTL, Keet RP, de Wolf F,
Coutinho RA, Miedema F: Biphasic rate of CD4
+
cell count
decline during progression to AIDS correlates with HIV-1
phenotype. AIDS 1992, 6:665-669.
24. Stein DS, Korvick JA, Vermund SH: CD4+ lymphocyte cell enu-
meration for prediction of clinical course of human-immun-
odeficiency-virus disease – A review. J Infect Dis 1992,
165:352-363.
25. Multicohort Analysis Project Workshop Part II, Bird G, Cook R,
Deangelis D, Farewell V, Fielding K, Fore A, Gore S, Kramer A, Lee
C, McNeil A, Pezzotti P, Phillips A, Raboud J, Rezza G, Sabin C, Satten
G, Brettle R, Hamilton B, Povey S, Raab G, Richardson A, Aiuti F,
Angarano G, Barbanera M, Canessa A, Castelli F, Gafa S, Lazzarin A,
Muratori S, Pristera R, Ricchi E, Salassa B, Sinicco A, Tirelli U, Viale P,
Zaccarelli M, Bofill M, Elford J, Janossy G, Goedert J, Yellin F, Coates
R, Calzavarra L, Reid S: Immunological marker paths for sero-
conversion – single determinations of immunoglobulin-A
and
β
2
-microglobulin are not adequate to estimate time of
HIV-infection. AIDS 1994, 8:923-933.
26. Faucett CL, Thomas DC: Simultaneously Modelling Censored
Survival Data and Repeatedly Measured Covariates: a Gibbs
Sampling Approach. Statistics in Medicine 1996, 15:1663-1685.
27. Spiegelhalter DJ, Thomas A, Best NG: WinBUGS version 1.2 User Man-
ual MRC Biostatistics Unit; 1999.
28. Gilks WR, Richardson S, Spiegelhalter DJ: Markov Chain Monte Carlo in
Practice Chapman & Hall; 1996.