ENZYME KINETICS A MODERN APPROACH – PART 4 pptx
Bạn đang xem bản rút gọn của tài liệu. Xem và tải ngay bản đầy đủ của tài liệu tại đây (381.76 KB, 25 trang )
60 CHARACTERIZATION OF ENZYME ACTIVITY
Aplotoft
−1
ln([S
0
]/[S
t
]) versus [S
0
− S
t
]/t yields a straight line
with slope =−1/K
m
, x-intercept = V
max
,andy-intercept = V
max
/K
m
(Fig. 3.11). The values of the slope and intercept can readily be obtained
using linear regression. Thus, from a single progress curve (i.e., a single
[S
t
]–t data set) it is possible to obtain estimates of K
m
and k
cat
.
If this procedure sounds too good to be true, it probably is. The major
problem with this procedure is that the following conditions must be met:
1. The enzyme must be stable during the time course of the measure-
ments used in the determination of reaction velocity.
2. The reverse reaction (product to substrate) must be negligible.
3. The product must not be inhibitory to enzyme activity.
If these conditions are not met, particularly the first one, this procedure
is not valid. Enzyme destabilization, reaction reversibility, and product
inhibition considerations can be incorporated into the kinetic model; how-
ever, this procedure is complex, and the validity of the results obtained
can be questionable.
CHAPTER 4
REVERSIBLE ENZYME INHIBITION
An inhibitor is a compound that decreases the rate of an enzyme-catalyzed
reaction. Moreover, this inhibition can be reversible or irreversible.
Reversible enzyme inhibition can be competitive, uncompetitive, or linear
mixed type, each affecting K
s
and V
max
in a specific fashion. In this
chapter, each type of reversible inhibition is discussed in turn. This is
followed by two examples of strategies used to determine the nature
of the inhibition as well as to obtain estimates of the enzyme–inhibitor
dissociation constant (K
i
).
4.1 COMPETITIVE INHIBITION
In this type of reversible inhibition, a compound competes with an
enzyme’s substrate for binding to the active site,
E + S
K
s
−−
−−
ES
k
cat
−−→ E + P
+
I
|
|
|
|
K
i
EI
(4.1)
This results in an apparent increase in the enzyme–substrate dissociation
constant (K
s
) (i.e., an apparent decrease in the affinity of enzyme for
61
62 REVERSIBLE ENZYME INHIBITION
substrate) without affecting the enzyme’s maximum velocity (V
max
). The
rate equation for the formation of product, the dissociation constants for
enzyme–substrate (ES) and enzyme–inhibitor (EI) complexes, and the
enzyme mass balance are, respectively:
v = k
cat
[ES]
K
s
=
[E][S]
[ES]
K
i
=
[E][I]
[EI]
(4.2)
[E
T
] = [E] + [ES] + [EI] = [E] +
[E][S]
K
s
+
[E][I]
K
i
Normalization of the rate equation by total enzyme concentration (v/[E
T
])
and rearrangement results in the following expression for the velocity of
an enzymatic reaction in the presence of a competitive inhibitor:
v =
V
max
[S]
K
∗
s
+ [S]
=
V
max
[S]
αK
s
+ [S]
(4.3)
where K
∗
s
corresponds to the apparent enzyme–substrate dissociation con-
stant in the presence of an inhibitor. In the case of competitive inhibition,
K
∗
s
= αK
s
,where
α = 1 +
[I]
K
i
(4.4)
4.2 UNCOMPETITIVE INHIBITION
In this type of reversible inhibition, a compound interacts with the en-
zyme–substrate complex at a site other than the active site,
E + S
K
s
−−
−−
ES
k
cat
−−→ E + P
+
I
|
|
|
|
K
i
ESI
(4.5)
This results in an apparent decrease in both V
max
and K
s
. The apparent
increase in affinity of enzyme for substrate (i.e., a decrease in K
s
) is due
to unproductive substrate binding, resulting in a decrease in free enzyme
LINEAR MIXED INHIBITION 63
concentration. Half-maximum velocity, or half-maximal saturation, will
therefore be attained at a relatively lower substrate concentration. The
rate equation for the formation of product, the dissociation constants
for enzyme–substrate (ES) and ES–inhibitor (ESI) complexes and the
enzyme mass balance are, respectively,
v = k
cat
[ES]
K
s
=
[E][S]
[ES]
K
i
=
[ES][I]
[ESI]
[E
T
] = [E] + [ES] + [ESI] = [E] +
[E][S]
K
s
+
[E][S][I]
K
s
K
i
(4.6)
Normalization of the rate equation by total enzyme concentration (v/[E
T
])
and rearrangement results in the following expression for the velocity of
an enzymatic reaction in the presence of an uncompetitive inhibitor:
v =
V
∗
max
(S)
K
∗
s
+ (S)
=
(V
max
/α)[S]
(K
s
/α) + [S]
(4.7)
where V
∗
max
and K
∗
s
correspond, respectively, to the apparent enzyme
maximum velocity and apparent enzyme–substrate dissociation constant
in the presence of an inhibitor. In the case of uncompetitive inhibition,
V
∗
max
= V
max
/α and K
∗
s
= K
s
/α,where
α = 1 +
[I]
K
i
(4.8)
4.3 LINEAR MIXED INHIBITION
In this type of reversible inhibition, a compound can interact with both
the free enzyme and the enzyme–substrate complex at a site other than
the active site:
E + S
K
s
−−
−−
ES
k
cat
−−→ E + P
++
II
|
|
|
|
K
i
|
|
|
|
δK
i
EI + S
−−
−−
δK
s
ESI
(4.9)
64 REVERSIBLE ENZYME INHIBITION
This results in an apparent decrease in V
max
and an apparent increase
in K
s
. The rate equation for the formation of product, the dissociation
constants for enzyme–substrate (ES and ESI) and enzyme–inhibitor (EI
and ESI) complexes, and the enzyme mass balance are, respectively,
v = k
cat
[ES]
K
s
=
[E][S]
[ES]
δK
s
=
[EI][S]
[ESI]
K
i
=
[E][I]
[EI]
δK
i
=
[ES][I]
[ESI]
[E
T
] = [E] + [ES] + [EI] + [ESI] = [E] +
[E][S]
K
s
+
[E][I]
K
i
+
[E][S][I]
K
s
δK
i
(4.10)
Normalization of the rate equation by total enzyme concentration (v/[E
T
])
and rearrangement results in the following expression for the velocity of
an enzymatic reaction in the presence of a linear mixed type inhibitor:
v =
V
∗
max
(S)
K
∗
s
+ (S)
=
(V
max
/β)[S]
(α/β)K
s
+ [S]
(4.11)
where V
∗
max
and K
∗
s
correspond, respectively, to the apparent enzyme
maximum velocity and apparent enzyme–substrate dissociation constant
in the presence of an inhibitor. In the case of linear mixed inhibition,
V
∗
max
= V
max
/β and K
∗
s
= (α/β)K
s
,where
α = 1 +
[I]
K
i
(4.12)
and
β = 1 +
[I]
δK
i
(4.13)
4.4 NONCOMPETITIVE INHIBITION
Noncompetitive inhibition is a special case of linear mixed inhibition
where δ = 1andα = β. Thus, the expression for the velocity of an enzy-
matic reaction in the presence of a noncompetitive inhibitor becomes
v =
V
∗
max
(S)
K
s
+ (S)
=
(V
max
/α)[S]
K
s
+ [S]
(4.14)
APPLICATIONS 65
TABLE 4.1 Summary of the Effects of Reversible Inhibitors on Apparent Enzyme
Catalytic Parameters V
∗
max
and K
∗
s
Competitive Uncompetitive Linear Mixed Noncompetitive
V
∗
max
No effect (−) Decrease (↓) Decrease (↓) Decrease (↓)
V
max
V
max
/α V
max
/β V
max
/α
K
∗
s
Increase (↑) Decrease (↓) Increase (↑) No effect (−)
αK
s
K
s
/α (α/β)K
s
K
s
where V
∗
max
corresponds to the apparent enzyme maximum velocity in
the presence of an inhibitor. In the case of noncompetitive inhibition,
V
∗
max
= V
max
/α,where
α = 1 +
[I]
K
i
(4.15)
Thus, for noncompetitive inhibition, an apparent decrease in V
max
is
observed while K
s
remains unaffected. A summary of the effects of
reversible inhibitors on the catalytic parameters K
s
and V
max
is presented
in Table 4.1.
4.5 APPLICATIONS
A typical enzyme inhibition experiment will be designed to determine the
nature of the inhibition process as well estimate the magnitude of K
i
.
For this purpose, initial velocities should be determined at substrate con-
centrations in the range 0.5 to 2–5K
s
, in the absence of an inhibitor, as
well as at inhibitor concentrations in the range 0.5 to 2–5K
i
. Collecting
data in this range of substrate and inhibitor concentrations will allow for
the accurate and unambiguous determination of both the nature of the
inhibition process and the magnitude of K
i
. In the examples below, only
four substrate concentrations and one inhibitor concentration are used.
This can only be done if the single inhibitor concentration is close to
the K
i
and substrate concentrations are in the range 0.5 to 2–5K
s
.Other-
wise, catalytic parameters cannot be estimated accurately using regression
techniques—or any technique, for that matter.
4.5.1 Inhibition of Fumarase by Succinate
The enzyme fumarase catalyzes the hydration of fumarate to malate. This
enzyme is known to be reversibly inhibited by succinate. Reaction veloc-
ities were determined in triplicate at different substrate concentrations, in
66 REVERSIBLE ENZYME INHIBITION
the presence and absence of succinate, and the results are summarized in
Table 4.2.
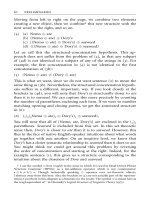
The Michaelis–Menten model was fitted to the experimental data using
standard nonlinear regression techniques to obtain estimates of V
∗
max
and
K
∗
s
(Fig. 4.1). Best-fit values of V
∗
max
and K
∗
s
of corresponding standard
errors of the estimates plus the number of values used in the calculation
of the standard error, and of the goodness-of-fit statistic r
2
are reported in
Table 4.3. These results suggest that succinate is a competitive inhibitor of
fumarase. This prediction is based on the observed apparent increase in K
s
in the absence of changes in V
max
(see Table 4.1). At this point, however,
the experimenter cannot state with any certainty whether the observed
apparent increase in K
s
is a true effect of the inhibitor or merely an act
of chance. A proper statistical analysis has to be carried out. For the
comparison of two values, a two-tailed t -test is appropriate. When more
than two values are compared, a one-way analysis of variance (ANOVA),
TABLE 4.2 Rate of Hydration of Fumarate to Malate by Fumarase at various
Substrate Concentrations
a
Velocity (a.u.)
Substrate
Concentration (M) Without Inhibitor With Inhibitor
5.0 × 10
−5
0.91 0.95 0.99 0.57 0.53 0.61
1.0 × 10
−4
1.43 1.47 1.39 0.95 0.91 0.99
2.0 × 10
−4
2.00 2.04 1.96 1.40 1.36 1.44
5.0 × 10
−4
2.50 2.54 2.46 2.13 2.09 2.17
a
In the presence and absence of 0.05 M succinate.
0.0000 0.0002 0.0004 0.0006
0
1
2
3
no inhibitor
+0.05M succinate
Fumarate (M)
Velocity (a.u.)
Figure 4.1. Initial velocity versus substrate concentration plot for fumarase in the absence
and presence of the reversible inhibitor succinate.
APPLICATIONS 67
TABLE 4.3 Estimates of the Catalytic Parameters for the Fumarase-Catalyzed
hydration of Fumarate to Malate
a
V
∗
max
(a.u.) Std. Error
b
(M) K
∗
s
(M) Std. Error
b
(M) r
2
Without inhibitor 3.07 4.54 ×10
−2
(12) 112 × 10
−6
4.57 × 10
−6
(12) 0.9959
With inhibitor 3.10 8.34 × 10
−2
(12) 232 × 10
−6
1.34 × 10
−5
(12) 0.9953
a
In the presence and absence of succinate.
b
Number in parentheses.
followed by a post-test to determine the statistical significance of differ-
ences between individual values, has to be carried out. Two-tailed t-tests
revealed significant differences between K
s
values in the presence and
absence of succinate (p<0.001), whereas no significant differences were
detected between V
max
values (p>0.05).
Having established that succinate acts as a competitive inhibitor, it is
possible to determine the value of α:
α =
K
∗
s
K
s
=
0.232
0.112
= 2.07 (4.16)
The magnitude of the enzyme–inhibitor dissociation constant can be
obtained from knowledge of [I] and α using Eq. 4.4,
K
i
=
[I]
α −1
=
5.00 ×10
−2
M
2.07 −1
= 0.0465 M(4.17)
4.5.2 Inhibition of Pancreatic Carboxypeptidase A by
β-Phenylpropionate
The enzyme carboxypeptidase catalyzes the hydrolysis of the synthetic
peptide substrate benzoylglycylglycyl-
L-phenylalanine (Bz-Gly-Gly-Phe).
This enzyme is known to be reversibly inhibited by β-phenylpropionate.
Reaction velocities were determined in triplicate at different substrate
concentrations, in the presence and absence of β-phenylpropionate, and
results summarized in Table 4.4.
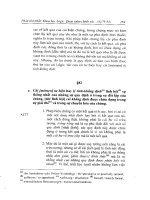
The Michaelis–Menten model was fitted to the experimental data using
standard nonlinear regression techniques to obtain estimates of V
∗
max
and
K
∗
s
(Fig. 4.2). Best-fit values of V
∗
max
and K
∗
s
, corresponding standard
errors of the estimates plus the number of values used in the calculation of
the standard error, and goodness-of-fit statistic r
2
are reported in Table 4.5.
A statistically significant decrease in V
max
(p<0.0001) and increase
in K
s
(p = 0.0407) were observed upon addition of the inhibitor. This
68 REVERSIBLE ENZYME INHIBITION
TABLE 4.4 Rate of Hydrolysis of the Synthetic Substrate Benzoylglycylglycyl-L-
Phenylalanine by Pancreatic Carboxypeptidase A as a Function of Substrate
Concentration
a
Velocity (a.u.)
Substrate
Concentration (M) Without Inhibitor With Inhibitor
2.5 × 10
−5
3000 2950 3050 1550 1500 1600
5.0 × 10
−5
4900 4950 4850 2500 2550 2450
1.0 × 10
−4
7100 7050 7150 3700 3750 3650
2.0 × 10
−4
9100 9150 9050 4500 4550 4450
a
In the presence and absence of 1 ×10
−4
M of the reversible inhibitor β-phenylpropionate.
0.0000 0.0001 0.0002 0.0003
0
2500
5000
7500
10000
no inhibitor
+10
−4
M β-phenylpropionate
Bz-Gly-Gly-Phe (M)
Velocity (a.u.)
Figure 4.2. Initial velocity versus substrate concentration plot for pancreatic carboxypep-
tidase A in the absence and presence of the reversible inhibitor β-phenylpropionate.
TABLE 4.5 Estimates of the Catalytic Parameters for the Carboxypeptidase-
Catalyzed Hydrolysis of Bz-Gly-Gly-Phe
a
V
∗
max
(a.u.) Std. Error
b
(M) K
∗
s
(M) Std. Error
b
(M) r
2
No inhibitor 1.28 ×10
4
84.0 (12) 8.07 × 10
−5
1.22 × 10
−6
(12) 0.9996
Plus inhibitor 6.20 ×10
3
130 (12) 7.24 ×10
−5
3.64 × 10
−6
(12) 0.9955
a
In the presence and absence of β-phenylpropionate.
b
Number in parentheses.
suggested that β-phenylpropionate acts as a linear mixed-type inhibitor
of carboxypeptidase A. Having established that β-phenylpropionate acts
as a linear mixed-type competitive inhibitor of carboxypeptidase A, it is
APPLICATIONS 69
possible to determine the values of α and α/β,
β =
V
max
V
∗
max
=
12,790
6196
= 2.06 (4.18)
α
β
=
K
∗
s
K
s
=
8.07e −5
7.24e −5
= 1.12 (4.19)
Using this information, α was estimated to have a value of 2.30. The
magnitude of the enzyme–inhibitor dissociation constant (K
i
) could then
be estimated from knowledge of α using Eq. 4.12:
K
i
=
[I]
α −1
=
1 × 10
−4
M
(2.30 −1)
= 7.68 × 10
−5
M(4.20)
Finally, an estimate of the magnitude of δ can be obtained from knowledge
of [I], K
i
,andβ using Eq. 4.13:
δ =
[I]
(β − 1)K
i
=
1 × 10
−4
M
(2.06 −1)(7.68 × 10
−5
M)
= 1.22 (4.21)
Using this value, δK
i
was estimated to be 9.40 ×10
−5
M.
4.5.3 Alternative Strategies
It is also theoretically possible to determine the nature of the inhibition
process by comparing the goodness of fit for each of the inhibition models
to experimental data. An F -test could then be carried out to determine
if a particular model fits the data significantly better than another. In
principle, the model that best fits the data should help define the nature
of the inhibition process. In the author’s opinion, however, this strategy
is not very fruitful. Usually, differences in the goodness of fit between
inhibition models, and even between inhibition and the non inhibition
model, are not statistically significant. Even though this procedure could
be automated, it is cumbersome and time consuming.
CHAPTER 5
IRREVERSIBLE ENZYME INHIBITION
In many circumstances, inhibitors affect enzyme activity in an irreversible
fashion. It is sometimes difficult to distinguish between the effects of a
reversible and irreversible inhibitors since irreversible inhibition could be
interpreted as noncompetitive reversible inhibition. However, the appar-
ent enzyme–inhibitor equilibrium dissociation constant (K
i
) derived for
an irreversible inhibitor is dependent on enzyme concentration, preincu-
bation time, and substrate concentration. A true equilibrium K
i
would be
independent of all these factors. Not a conclusive proof, time dependence
of the inhibitory effects may be indicative of irreversibility.
We present some simple models that can be used to analyze irreversible
inhibition data. In all of these treatments, the concentration of inhibitor
will be considered to be in excess of that of enzyme (i.e., [I]
≫ [E]).
Under these conditions, inhibitor concentration is assumed to remain con-
stant during the course of the reaction. Thus, inhibitor concentration will
remain unchanged from its initial value [I
0
], (i.e., [I] ≈ [I
0
]). This con-
dition, which is relevant to an experimental situation, will simplify the
mathematical treatment considerably.
Under conditions where [I] ≫ [E], all irreversible inhibition patterns
can be modeled using a first-order association kinetic model of the form
[EI
∗
] = [E
T
](1 − exp
−k
t
)(5.1)
where [EI
∗
] corresponds to the concentration of irreversible enzyme–
inhibitor complex and [E
T
] corresponds to total enzyme concentration
70
IRREVERSIBLE ENZYME INHIBITION 71
0 50 100 150
0.0
0.2
0.4
0.6
0.8
1.0
1.2
k'=0.03s
−1
[E
T
]=1µM
Time (s)
[EI*] (µM)
0 50 100 150
−5
−4
−3
−2
−1
0
slope=−k'
Time (s)
ln(1−[EI*]/[E
T
])
(
a
)
(
b
)
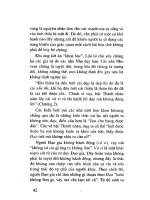
Figure 5.1. (a) Increases in the concentration of inhibited enzyme as a function of time
for simple irreversible enzyme inhibition. (b) Semilogarithmic plot used in determination
of the inhibition rate constant for the case of simple irreversible inhibition.
(Fig. 5.1a). The first-order association rate constant can therefore be deter-
mined by fitting this model to [EI
∗
] versus time data using nonlinear
regression procedures. Alternatively, the model can be linearized to
ln
1 −
[EI
∗
]
[E
T
]
=−k
t(5.2)
Thus, a plot of the natural logarithm of 1 −[EI
∗
]/[E
T
] as a function
of time should yield a straight line (Fig. 5.1b). The slope of the line,
which corresponds to −k
, can be determined using standard linear regres-
sion procedures.
The pseudo-first-order inhibition constant, k
(s
−1
), will have differ-
ent meanings, depending on the exact inhibition mechanism (see below).
Four different phenomenological irreversible inhibition mechanisms are
discussed in turn.
72 IRREVERSIBLE ENZYME INHIBITION
5.1 SIMPLE IRREVERSIBLE INHIBITION
The interaction of an enzyme (E) with an irreversible inhibitor (I), which
results in the formation of an irreversible enzyme–inhibitor complex
(EI
∗
), can be modeled as a second-order reaction between two dissim-
ilar substrates:
E + I
k
i
−−→ EI
∗
(5.3)
where k
i
is the second-order rate constant of inhibition (M
−1
s
−1
).
The differential equation that describes the formation of irreversible
enzyme–inhibitor complex, and the mass balance for the enzyme are,
respectively,
d[EI
∗
]
dt
= k
i
[I][E] (5.4)
and
[E
T
] = [E] + [EI
∗
] (5.5)
where [E
T
], [E], [EI
∗
], and [I] correspond, respectively, to total enzyme
concentration, irreversible enzyme–inhibitor complex, free enzyme, and
inhibitor concentrations. Substitution of [E] for [E
T
] − [EI
∗
], and [I
0
]for
[I] into Eq. (5.4) results in a first-order ordinary differential equation of
the form
d[EI
∗
]
dt
= k
i
[I
0
][E
T
− EI
∗
] = k
[E
T
− EI
∗
] (5.6)
where
k
= k
i
[I
0
] (5.7)
Integration of Eq. (5.5) after variable separation,
EI
∗
0
d[EI
∗
]
[E
T
− EI
∗
]
= k
t
0
dt(5.8)
yields a first-order association kinetic model that describes the changes in
concentration of the reversible enzyme–inhibitor complex (EI
∗
) in time:
[EI
∗
] = [E
T
](1 − exp
−k
t
)(5.9)
Since the initial inhibitor concentration is known, the experimentally deter-
mined peudo-first-order inhibition rate constant, k
(s
−1
), can be used to
SIMPLE IRREVERSIBLE INHIBITION IN THE PRESENCE OF SUBSTRATE 73
obtain estimates of the second-order inhibition rate constant k
i
(M
−1
s
−1
):
k
i
=
k
[I
0
]
(5.10)
Substrate may protect the enzyme from the effects of irreversible inhibi-
tors, and the model has to be modified to take this fact into consideration.
5.2 SIMPLE IRREVERSIBLE INHIBITION IN THE
PRESENCE OF SUBSTRATE
Consider the interactions of free enzyme with inhibitor and substrate:
E + I
k
i
−−→ EI
∗
E + S
K
s
−−
−−
ES
(5.11)
The differential equation that describes the formation of irreversible
enzyme–inhibitor complex, the dissociation constant for the ES complex,
and the mass balance for the enzyme are, respectively,
d[EI
∗
]
dt
= k
i
[E][I] (5.12)
K
s
=
[E][S]
[ES]
(5.13)
[E
T
] = [E] + [EI
∗
] + [ES] (5.14)
where [E
T
], [E], [EI
∗
] and [ES] correspond, respectively, to total
enzyme concentration, and the concentrations of free enzyme,
irreversible enzyme–inhibitor complex, and enzyme–substrate complex.
The concentration of free enzyme is given by
[E] =
[ES] · K
s
[S]
(5.15)
Substitution of [E
T
] − [E] −[EI
∗
] for [ES], and rearrangement, results in
the following expression for the concentration of free enzyme:
[E] =
[E
T
− EI
∗
] · K
s
K
s
+ [S]
(5.16)
74 IRREVERSIBLE ENZYME INHIBITION
Substitution of Eq. (5.16) for [E], and [I
0
] for [I] into Eq. (5.12), results
in a first-order ordinary differential equation of the form
d[EI
∗
]
dt
= k
i
[I
0
]
[E
T
− EI
∗
] · K
s
K
s
+ [S]
= k
[E
T
− EI
∗
] (5.17)
where
k
=
k
i
K
s
K
s
+ [S]
[I
0
] (5.18)
Integration of Eq. (5.17) after variable separation,
EI
∗
0
d[EI
∗
]
[E
T
− EI
∗
]
= k
t
0
dt(5.19)
yields a first-order association kinetic model that describes the time-
dependent changes in concentration of an irreversible enzyme–inhibitor
complex (EI
∗
) in the presence of substrate:
[EI
∗
] = [E
T
](1 − exp
−k
t
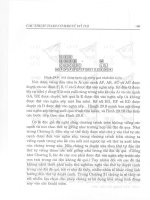
)(5.20)
Toobtainanestimateofk
i
,ak
versus [I
0
] data set has to be created at
a fixed substrate concentration. A plot of this k
versus [I
0
] data would
yield a straight line (Fig. 5.2). With the aid of standard linear regression
procedures, the value of the slope of this line can be obtained. This slope
corresponds to
slope =
k
i
K
s
K
s
+ [S]
(5.21)
0 2 4 6 8 10
0.0
0.1
0.2
0.3
[I
o
] (µM)
k'(s
−1
)
k
i
=0.03M
−1
s
−1
[S]=0.5µM
K
s
=2µM
slope=k
i
K
s
/(K
s
+S)
Figure 5.2. Initial inhibitor concentration dependence of the inhibition rate constant for
simple irreversible enzyme inhibition in the presence of substrate.
TIME-DEPENDENT SIMPLE IRREVERSIBLE INHIBITION 75
Since accurate estimates of K
s
can be obtained independently, it is there-
fore possible simply to solve for k
i
.
5.3 TIME-DEPENDENT SIMPLE IRREVERSIBLE INHIBITION
Consider the time-dependent interaction of inhibitor with free enzyme:
E + I
K
i
−−
−−
EI
k
i
−−→ EI
∗
(5.22)
A rapid reversible interaction between enzyme (E) and inhibitor (I) is
followed by a slower, irreversible reaction, which transforms the reversible
enzyme–inhibitor complex (EI) into an irreversible enzyme–inhibitor
complex (EI
∗
). The differential equation that describes the formation of
enzyme–inhibitor complex, the dissociation constant for the EI complex,
and the mass balance for the enzyme are, respectively,
d[EI
∗
]
dt
= k
i
[EI] (5.23)
K
i
=
[E][I]
[EI]
(5.24)
[E
T
] = [E] + [EI] + [EI
∗
] (5.25)
Substitution of [E
T
] − [EI] −[EI
∗
] for [E] in Eq. (5.24) and rearrange-
ment yields
[EI] =
[E
T
− EI
∗
]
1 + K
i
/[I
0
]
(5.26)
Substitution of Eq. (5.26) into Eq. (5.23) results in a first-order ordinary
differential equation of the form
d[EI
∗
]
dt
= k
i
[E
T
− EI
∗
]
1 + K
i
/[I
0
]
= k
[E
T
− EI
∗
] (5.27)
where
k
=
k
i
1 + K
i
/[I
0
]
=
k
i
[I
0
]
K
i
+ [I
0
]
(5.28)
Integration of Eq. (5.27) after variable separation,
EI
∗
0
d[EI
∗
]
[E
T
− EI
∗
]
= k
t
0
dt(5.29)
76 IRREVERSIBLE ENZYME INHIBITION
0 2 4 6 8 10
0.00
0.01
0.02
0.03
K
i
=1µM
k
i
=0.03M
−1
s
−1
[I
o
] (µM)
k'(s
−1
)
Figure 5.3. Initial inhibitor concentration dependence of the inhibition rate constant for
time-dependent irreversible enzyme inhibition.
yields a first-order association kinetic model that describes the time depen-
dence of changes in concentration of the irreversible enzyme–inhibitor
complex (EI
∗
):
[EI
∗
] = [E
T
](1 − exp
−k
t
)(5.30)
To obtain estimates of K
i
and k
i
,ak
versus [I
0
] data set has to be created.
Aplotofthesek
versus [I
0
] data would yield a rectangular hyperbola
(Fig. 5.3). With the aid of standard nonlinear regression procedures, the
values of K
i
and k
i
can be obtained.
5.4 TIME-DEPENDENT SIMPLE IRREVERSIBLE INHIBITION IN
THE PRESENCE OF SUBSTRATE
Consider the interactions of free enzyme with inhibitor and substrate:
E + I
K
i
−−
−−
EI
k
i
−−→ EI
∗
E + S
K
s
−−
−−
ES
(5.31)
The differential equation that describes the formation of the irreversible
enzyme–inhibitor complex, the equilibrium dissociation constants for the
reversible enzyme–inhibitor (K
i
) and enzyme–substrate (K
s
) complexes,
and the mass balance for the enzyme are, respectively,
d[EI
∗
]
dt
= k
i
[EI] (5.32)
TIME-DEPENDENT SIMPLE IRREVERSIBLE INHIBITION IN THE PRESENCE OF SUBSTRATE 77
K
i
=
[E][I]
[EI]
K
s
=
[E][S]
[ES]
(5.33)
[E
T
] = [E] + [EI] + [EI
∗
] + [ES] (5.34)
An expression for the concentration of the EI complex can be obtained
from the enzyme mass balance and dissociation constants:
[EI] =
[E][I]
K
i
=
[E
T
− EI − EI
∗
− ES][I]
K
i
=
[E
T
− EI
∗
− ES]
1 + K
i
/[I
0
]
(5.35)
A relationship between [ES] and [EI] can be obtained from the dissociation
constants for enzyme–substrate and enzyme–inhibitor complexes:
[E] = [ES]
K
s
[S]
= [EI]
K
i
[I]
(5.36)
The concentration of the ES complex can therefore be expressed as
[ES] = [EI]
K
i
[S]
K
s
[I]
(5.37)
Substitution of Eq. (5.37) into Eq. (5.35) and rearrangement yields
[EI] =
[E
T
− EI
∗
]
1 + K
i
/[I
0
](1 + [S]/K
S
)
(5.38)
Substitution of Eq. (5.38) into Eq. (5.32) yields a first-order ordinary dif-
ferential equation of the form
d[EI
∗
]
dt
= k
i
[EI] =
k
i
1 + K
i
/[I
0
](1 + [S]/K
S
)
[E
T
− EI
∗
] = k
[E
T
− EI
∗
]
(5.39)
where
k
=
k
i
1 + K
i
/[I
0
](1 + [S]/K
S
)
=
k
i
[I
0
]
K
i
(1 + [S]/K
S
) + [I
0
]
(5.40)
Integration of Eq. (5.39) after variable separation,
EI
∗
0
d[EI
∗
]
[E
T
− EI
∗
]
= k
t
0
dt(5.41)
78 IRREVERSIBLE ENZYME INHIBITION
0 2 4 6 8 10
0.00
0.01
0.02
0.03
k
i
=0.03M
−1
s
−1
K
i
=1µM
K
s
=2µM
[S]=0.5µM
[I
o
] (µM)
k'(s
−1
)
Figure 5.4. Initial inhibitor concentration dependence of the inhibition rate constant for
time-dependent irreversible enzyme inhibition in the presence of substrate.
yields a first-order association kinetic model which describes the time
dependence of changes in concentration of the irreversible enzyme–inhi-
bitor complex (EI
∗
) in the presence of substrate:
[EI
∗
] = [E
T
](1 − exp
−k
t
)(5.42)
To obtain estimates of K
i
and k
i
,ak
versus [I
0
] data set at a fixed
substrate concentration has to be created. A plot of these k
versus [I
0
]
data would yield a rectangular hyperbola (Fig. 5.4). Estimates of K
i
and
k
i
can be obtained by fitting Eq. (5.40) to the k
versus [I
0
]datausing
standard nonlinear regression procedures. Since accurate estimates of K
s
can be obtained independently, it is fixed as a constant.
5.5 DIFFERENTIATION BETWEEN TIME-DEPENDENT AND
TIME-INDEPENDENT INHIBITION
In principle, it is possible to distinguish between time-dependent and time-
independent irreversible inhibition from k
versus [I
0
] plots. A straight
line suggests time-independent irreversible inhibition (Fig. 5.2), whereas
a rectangular hyperbola is suggestive of time-dependent irreversible inhi-
bition (Fig. 5.4).
CHAPTER 6
pH DEPENDENCE OF
ENZYME-CATALYZED REACTIONS
The activity of an enzyme is profoundly affected by pH. Usually, enzymes
display a bell-shaped activity versus pH profile (Fig. 6.1). The decrease in
activity on either side of the pH optimum can be due to two general causes.
First, pH may affect the stability of the enzyme, causing it to become
irreversibly inactivated. Second, pH may affect the kinetic parameters of
the enzymatic reaction: It may affect the stability of the ES complex, the
velocity of the rate-limiting step, or both. The second case is relevant
to the discussion in this chapter. Interestingly, the pH dependence of
enzyme-catalyzed reactions is similar to that of acid- and base-catalyzed
chemical reactions. Thus, it is possible, at least in principle, to determine
the pK and state of ionization of the functional groups directly involved
in catalysis, and possibly their chemical nature.
6.1 THE MODEL
To understand the effects of pH on enzyme-catalyzed reactions, a model
must be built that can account for both the pH dependence of the
catalytically active functional groups in the enzyme, and any ionizable
groups in the substrate. We consider the case where the substrate does
not ionize, while ionizable groups are present in the free enzyme and
enzyme–substrate (ES) complex. The reactive form of the enzyme and
the ES complex is the monoionized (EH or EHS) form of a diacidic (EH
2
)
79
80 pH DEPENDENCE OF ENZYME-CATALYZED REACTIONS
2 4 6 8 10
0
20000
40000
60000
80000
100000
120000
pH
V
*
max
/K
s
*
2 4 6 8 10
1
2
3
4
5
6
pH
log
10
(V
*
max
/K
s
*
)
(
a
)
(
b
)
Figure 6.1. pH dependence of the first-order rate constant (V
max
/K
s
) of an enzyme in
(a) linear and (b) semilogarithmic scales.
species. Thus, the catalytic process, taking into consideration the state of
ionization of the enzyme, can be modeled as
EES
|
|
|
|
K
e2
|
|
|
|
K
es2
S + EH
K
s
−−
−−
EHS
k
cat
−−→ EH + P
|
|
|
|
K
e1
|
|
|
|
K
es1
EH
2
EH
2
S
(6.1)
The velocity of the reaction, equilibrium dissociation, and ionization con-
stants for the different enzyme species, and enzyme mass balance are
v = k
cat
[EHS] (6.2)
K
s
=
[EH][S]
[EHS]
(6.3)
THE MODEL 81
K
e1
=
[EH][H]
[EH
2
]
K
e2
=
[E][H]
[EH]
K
es1
=
[EHS][H]
[EH
2
S]
K
es2
=
[ES][H]
[EHS]
(6.4)
[E
T
] = [E] + [EH] + [EH
2
] + [ES] +[EHS] +[EH
2
S] (6.5)
Normalization of the velocity term by total enzyme concentration (v/[E
T
])
and rearrangement results in the following expression:
v =
V
∗
max
[S]
K
∗
s
+ [S]
=
(V
max
/α)[S]
(β/α)K
s
+ [S]
(6.6)
where V
∗
max
and K
∗
s
correspond, respectively, to apparent enzyme maxi-
mum velocity and apparent enzyme–substrate dissociation constant at a
particular pH. For the model above, V
∗
max
= V
max
/α and K
∗
s
= (β/α)K
s
,
where
α = 1 +
[H
+
]
K
es1
+
K
es2
[H
+
]
(6.7)
and
β = 1 +
[H
+
]
K
e1
+
K
e2
[H
+
]
(6.8)
Explicit expressions for the relationship between apparent and true enzyme
catalytic parameters are shown below.
V
∗
max
= V
max
1 +
[H
+
]
K
es1
+
K
es2
[H
+
]
−1
(6.9)
K
∗
s
= K
s
1 + [H
+
]/K
e1
+ K
e2
/[H
+
]
1 + [H
+
]/K
es1
+ K
es2
/[H
+
]
(6.10)
V
∗
max
K
∗
s
=
V
max
K
s
1 +
[H
+
]
K
e1
+
K
e2
[H
+
]
−1
(6.11)
Since V
max
= k
cat
[E
T
], Eq. (6.11) can be expressed in terms of k
cat
/K
s
if
so required:
k
∗
cat
K
∗
s
=
k
cat
K
s
1 +
[H
+
]
K
e1
+
K
e2
[H
+
]
−1
(6.12)
These expressions are particularly useful in helping determine the pK
and chemical nature of the catalytically active functional groups in the
82 pH DEPENDENCE OF ENZYME-CATALYZED REACTIONS
0.0
0.2
0.4
0.6
0.8
1.0
EH
2
EH
−
E
2−
pH
Relative Proportion
Figure 6.2. Relative proportions of a diprotic enzyme as a function of pH.
enzyme. In general, if V
∗
max
, K
∗
s
, V
∗
max
/K
∗
s
,ork
∗
cat
/K
∗
s
are plotted versus
pH, the patterns obtained will reflect the chemical nature and acid–base
properties (pK values) of the functional groups present.
The treatment above is essentially equivalent to the treatment of the
pH dependence of a polyprotic acid (see Chapter 1). In our case, the
enzyme is considered to be a diprotic acid. Increases and decreases in
activity as a function of pH simply mirror the increases and decreases in
the concentration of the catalytically active species EH (Fig. 6.2). Notice
how the bell-shaped pattern for activity as a function of pH (darker lines)
corresponds to the net increase and decrease in EH concentration.
6.2 pH DEPENDENCE OF THE CATALYTIC PARAMETERS
For our model, the patterns obtained for the pH dependence of log
10
V
∗
max
,
log
10
(V
∗
max
/K
∗
s
),and−log
10
K
∗
s
are shown in Fig. 6.3. The log
10
V
∗
max
and log
10
(V
∗
max
/K
∗
s
) versus pH graphs may be broken down into linear
segments having slopes of −1, 0, and +1. As discussed in the review of
specific acid–base catalysis of chemical reactions, a change in the slope of
alog
10
(V
∗
max
/K
∗
s
),orlog
10
V
∗
max
, versus pH plot from +1to0asafunction
of increasing pH suggests the necessity of a basic group in the catalytic
step, while a change of slope from 0 to −1 suggests the necessity of an
acidic group in the catalytic step. The pH at which these linear segments
intersect corresponds to the kinetically apparent pK value of the enzyme’s
amino acid side-chain functional groups involved in catalysis (Fig. 6.3).
These pK values are usually shifted significantly from their corresponding
pK values in a free amino acid. This effect is due to both shielding of the
groups from the aqueous environment by the substrate and by the protein
itself. Active sites of enzymes have unique chemical characteristics, which
pH DEPENDENCE OF THE CATALYTIC PARAMETERS 83
2.5 3.0 3.5 4.0 4.5 5.0 5.5 6.0 6.5
−1.0
−0.5
0.0
0.5
1.0
K
es1
K
es2
K
e1
K
e2
log V
*
max
−log K
s
*
pH
log V
*
max
/K
s
*
Figure 6.3. Simulation of the pH dependence of the logarithm of the catalytic parameters
V
max
, V
max
/K
s
,andK
s
for a diprotic enzyme.
TABLE 6.1 pK and Enthalpy of Ionization Values for Amino Acid Side Groups
Group pK
a
(298 K) H
◦
(kcal mol
−1
)
α-Carboxyl (terminal) 3.0–3.2 0 ± 1.5
β-Carboxyl (aspartic) 3.0–4.7 0 ±1.5
γ -Carboxyl (glutamic) 4.4 0 ±1.5
Imidazolium (histidine) 5.6–7.0 +6.9–7.5
α-Amino (terminal) 7.6–8.4 +10–13
Sulfhydryl (cysteine) 8–9 +6.5–7.0
-Amino (lysine) 9.4–10.6 +10–12
Phenolic hydroxyl (tyrosine) 9.8–10.4 +6.0
Guanidinium (arginine) 11.6–12.6 +12–13
can lead to the promotion, or inhibition, of ionization of groups located
within. Nevertheless, comparison of the experimentally determined pK
values to tabulated pK values for side-chain functional groups of amino
acids (Table 6.1) can help identify the chemical nature of such groups
within the enzyme.
Another parameter that can prove helpful in identification of the chem-
ical nature of the charged groups involved in the reaction is the enthalpy
of ionization (H
◦
). This enthalpy of ionization is determined from the
temperature dependence of the equilibrium ionization constant K
a
,as
described in the chemical kinetics section. The identity of amino acids
present in the active site of an enzyme could be potentially identified
from their characteristic pK and H
◦
(Table 6.1).
84 pH DEPENDENCE OF ENZYME-CATALYZED REACTIONS
6.3 NEW METHOD OF DETERMINING pK VALUES OF
CATALYTICALLY RELEVANT FUNCTIONAL GROUPS
The usual way in which the putative pK values of catalytic groups
were determined in the past was by considering the log
10
(V
∗
max
/K
∗
s
) and
log
10
V
∗
max
versus pH curves in Fig. 6.3 to be composed of three straight
lines with slopes +1, 0, and −1. The pH at which these lines intercept
corresponds roughly to the pK values of the catalytic groups. However, a
more efficient way of determining the points of inflection of these curves
is to determine the pH at which the slope of the log
10
(V
∗
max
/K
∗
s
) and
log
10
V
∗
max
versus pH curves equals 0.5 and −0.5. For the log
10
(V
∗
max
/K
∗
s
)
versus pH curve, the pH where the slope equals 0.5 corresponds to the
pK
e1
value, while the pH where the slope equals −0.5 corresponds to the
pK
e2
value. For the log
10
V
∗
max
versus pH curve, the pH where the slope
equals 0.5 corresponds to pK
es1
, while the pH where the slope equals
−0.5 corresponds to pK
es2
(Fig. 6.4).
Consider the expression for the hydrogen ion dependence of V
max
or
V
max
/K
s
of an enzyme-catalyzed reaction:
Y
∗
= Y
1 +
[H
+
]
K
1
+
K
2
[H
+
]
−1
= Y
K
1
[H
+
]
[H
+
]
2
+ K
1
[H
+
] + K
1
K
2
(6.13)
where Y
∗
represents V
∗
max
or V
∗
max
/K
∗
s
, Y represents V
max
or V
max
/K
s
,
K
1
represents K
es1
or K
e1
,andK
2
represents K
es2
or K
e2
. A logarithmic
transformation of Eq. (6.13), results in the expression
log Y
∗
= log (Y K
1
) + log [H
+
] − log ([H
+
]
2
+ K
1
[H
+
] + K
1
K
2
)
(6.14)
The first derivative of Eq. (6.14) as a function of −log [H
+
] (i.e., pH) is
d(log Y
∗
)
d(pH)
=
2[H
+
]
2
− K
1
[H
+
]
[H
+
]
2
+ K
1
[H
+
] + K
1
K
2
− 1 (6.15)
For the case where [H
+
] = K
1
and K
2
1
≫ K
1
K
2
,
d(log Y
∗
)
d(pH)
= 0.5 (6.16)
For the case where [H
+
] = K
2
and K
2
1
≫ K
1
K
2
,
d(log Y
∗
)
d(pH)
=−0.5 (6.17)