Báo cáo y học: "Classification of voluntary cough sound and airflow patterns for detecting abnormal pulmonary function" pot
Bạn đang xem bản rút gọn của tài liệu. Xem và tải ngay bản đầy đủ của tài liệu tại đây (526.97 KB, 12 trang )
BioMed Central
Page 1 of 12
(page number not for citation purposes)
Cough
Open Access
Research
Classification of voluntary cough sound and airflow patterns for
detecting abnormal pulmonary function
Ayman A Abaza
†1,2
, Jeremy B Day
†1,2
, Jeffrey S Reynolds
†1,2
,
Ahmed M Mahmoud
†1,3
, W Travis Goldsmith*
†1,2
, Walter G McKinney
†1
, E
Lee Petsonk
†4
and David G Frazer
†1,2
Address:
1
National Institute for Occupational Safety and Health, Health Effects Laboratory Division, Pathology and Physiology Research Branch,
1095 Willowdale Road, Morgantown, West Virginia, USA,
2
Department of Computer Science and Electrical Engineering, West Virginia University,
Morgantown, West Virginia, USA,
3
Department of Mechanical and Aerospace Engineering, West Virginia University, Morgantown, West Virginia,
USA and
4
Department of Medicine, West Virginia University School of Medicine, Morgantown, West Virginia, USA
Email: Ayman A Abaza - ; Jeremy B Day - ; Jeffrey S Reynolds - ;
Ahmed M Mahmoud - ; W Travis Goldsmith* - ;
Walter G McKinney - ; E Lee Petsonk - ; David G Frazer -
* Corresponding author †Equal contributors
Abstract
Background: Involuntary cough is a classic symptom of many respiratory diseases. The act of
coughing serves a variety of functions such as clearing the airways in response to respiratory
irritants or aspiration of foreign materials. It has been pointed out that a cough results in substantial
stresses on the body which makes voluntary cough a useful tool in physical diagnosis.
Methods: In the present study, fifty-two normal subjects and sixty subjects with either obstructive
or restrictive lung disorders were asked to perform three individual voluntary coughs. The
objective of the study was to evaluate if the airflow and sound characteristics of a voluntary cough
could be used to distinguish between normal subjects and subjects with lung disease. This was done
by extracting a variety of features from both the cough airflow and acoustic characteristics and then
using a classifier that applied a reconstruction algorithm based on principal component analysis.
Results: Results showed that the proposed method for analyzing voluntary coughs was capable of
achieving an overall classification performance of 94% and 97% for identifying abnormal lung
physiology in female and male subjects, respectively. An ROC analysis showed that the sensitivity
and specificity of the cough parameter analysis methods were equal at 98% and 98% respectively,
for the same groups of subjects.
Conclusion: A novel system for classifying coughs has been developed. This automated
classification system is capable of accurately detecting abnormal lung function based on the
combination of the airflow and acoustic properties of voluntary cough.
Background
Cough is a natural respiratory defense mechanism to pro-
tect the respiratory tract and one of the most common
symptoms of pulmonary disease [1]. There is a growing
interest in using the characteristics of voluntary cough to
detect and characterize lung disease [2,3]. Currently, no
Published: 20 November 2009
Cough 2009, 5:8 doi:10.1186/1745-9974-5-8
Received: 27 March 2009
Accepted: 20 November 2009
This article is available from: />© 2009 Abaza et al; licensee BioMed Central Ltd.
This is an Open Access article distributed under the terms of the Creative Commons Attribution License ( />),
which permits unrestricted use, distribution, and reproduction in any medium, provided the original work is properly cited.
Cough 2009, 5:8 />Page 2 of 12
(page number not for citation purposes)
standard method for automatically evaluating coughs has
been established, even though a variety of approaches
have been reported in the literature [4,5].
A cough is normally initiated with an inspiration of a var-
iable volume of air, followed by closure of the glottis, and
contraction of the expiratory muscles that compresses the
gas in the lungs. These events occur immediately before
the sudden reopening of the glottis and rapid expulsion of
air from the lungs. When flow limitation is reached during
coughs that begin at the same lung volume, the airflow
and acoustic properties are repeatable and unique for a
given subject [6].
There are many examples in the literature that describe
methods to analyze cough characteristics based on the
subjective interpretation of cough sound recordings and
the analysis of spectrograms [4,5,7-12]. In those studies,
the acoustical signals were normally recorded either at the
neck, over the trachea, or on the chest wall using a contact
microphone while the respiratory phase was recorded
simultaneously by measuring the airflow from the mouth.
In one case, Murata et al. [8] described the ability to dis-
criminate acoustically between productive and non-pro-
ductive cough by the analysis of time expanded
waveforms combined with spectrograms. In another
instance, Van Hirtum et al. [13], were among the first to
describe an automated classifier that could differentiate
between 'spontaneous' and 'voluntary' human coughs
generated by a given individual. They recorded free field
cough sounds and were able to identify several distin-
guishing features of the acoustic signals. Neural networks
and fuzzy classification methods were used to make a dis-
tinction between coughs in a database that included 12
individual subjects.
The aim of the present study was to develop a new method
to characterize and classify the acoustical and airflow
properties of human voluntary coughs based on previous
work [14]. Cough airflow and acoustic properties of vol-
untary coughs from subjects with normal and abnormal
lung function were recorded using a high fidelity system
that has been described previously [14]. A low computa-
tional-cost classification system was then developed and
evaluated on its ability to identify individuals with respi-
ratory disorders based entirely on a feature set extracted
from the recorded cough airflow and acoustic signals. Fea-
ture redundancy and extraneous noise were minimized
using a principal component analysis. These features were
used by an eigenvector classification technique to identify
differences in cough characteristics between populations
of test subjects. The classification technique was evaluated
by comparing the results of the cough analysis with the
diagnosis of pulmonologists.
Methods
Cough Recording System
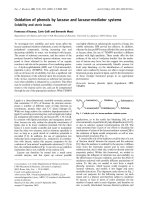
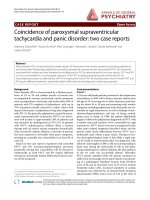
A block diagram of the system that was designed to record
high fidelity cough sound and airflow measurements is
illustrated in Figure 1. The system was composed of a
cylindrical mouthpiece attached to a 1" diameter metal
tube with a 1/4" microphone (Model 4136, Bruel & Kjaer,
Norcross, GA) mounted at a 90° angle with its diaphragm
tangent to the metal tube. A 1" diameter, 13' long, gum
rubber flexible tube was attached to the metal tube oppo-
site the mouthpiece. A pneumotachograph (Model 2,
Fleisch, Lausanne, Switzerland) and differential pressure
transducer (Model 239, Setra systems, Boxborough, Mar-
yland) were employed at the terminal end of the flexible
tube to measure airflow during a cough. The system was
terminated with an exponential horn to reduce acoustic
reflections. The calibration and accuracy of the system
have been discussed previously [14].
A software "virtual instrument" was designed using Lab-
VIEW to capture the sound pressure and flow signals gen-
erated as a subject coughed through the mouthpiece. The
virtual instrument allowed the user to select the sampling
frequency, total sampling time, high-pass filter character-
istics, input signal range, and triggering considerations.
Under normal operation, a high-pass filter with a cut-off
frequency of 22.4 Hz, and an anti-aliasing filter with a cut-
off frequency of 25.6 kHz were applied to the signal. The
frequency response of the condenser microphone was 20
Hz to 35 kHz (± 1 dB). This system was capable of per-
forming spectral analysis of cough sound signals in the
frequency domain between 50 Hz and 25 kHz.
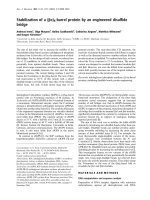
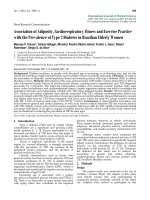
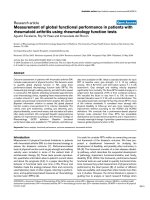
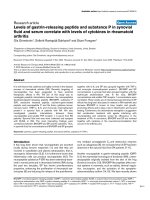
Figure 2 shows examples of cough sound pressure waves
and airflow measurements for coughs from a normal sub-
ject and a subject with abnormal lung function. Spectro-
grams of these cough sound signals are displayed in Figure
3.
Cough Data Collection
The testing procedure was approved by the Institutional
Review Board of West Virginia University and standard-
ized using the following protocol. Subjects first viewed a
short video describing the correct performance of a volun-
tary cough. This was to ensure that all coughs from a par-
ticular subject were repeatable. Test subjects were coached
to keep their glottis open to prevent sound generated due
to the glottis closing at the end of the cough. Before begin-
ning a cough, each individual was asked to inhale to total
lung capacity (TLC), relax and exhale. This was followed
by a second inhalation to TLC at which time the subject
was asked to form a seal with their teeth and lips around
the mouthpiece connected to a metal tube (as shown in
Figure 1), and to cough vigorously. Three successive indi-
Cough 2009, 5:8 />Page 3 of 12
(page number not for citation purposes)
vidual coughs were recorded to ensure that they had a
repeatable flow-volume relationship.
A total of 58 male and 54 female subjects were tested.
There were 27 male and 25 female subjects classified as
normal, as well as 31 male and 29 female subjects classi-
fied as having abnormal lung function. All test subjects
were examined at the pulmonary function laboratory of
Ruby Memorial Hospital, after providing informed con-
sent. The study protocol was reviewed and approved by
the local institutional review board, and all participants
gave written informed consent. The diagnosis of a pulmo-
nary disease was based upon a pulmonary physician's
review of all the available information pertaining to each
patient. This included the course of symptoms, findings
reported on the physical examination, medical records,
pulmonary function tests, and other laboratory results
including radiographic images. In addition, risk factors
reported under personal, social, occupational and family
history were considered. The pulmonary function tests
were performed using a whole body plethysmograph
(Model 1085/D, MedGraphics, St. Paul, Minnesota) and
spirometer (Model Jaeger MasterScope, VIASYS Health-
care, Hoechberg, Germany). Those subjects who were
diagnosed with either restrictive or obstructive lung disor-
ders were considered to have abnormal lung function.
Those subjects that the pulmonologist diagnosed as dis-
ease-free were considered to be normal. Test subject pop-
ulation demographics, including pulmonary function test
indices, are shown in Table 1.
Feature Extraction
Cough sound and airflow signals were analyzed in both
the time and frequency domains and representative fea-
tures were extracted from both signals. There were 29 fea-
tures based on time (5 were sound-based, and 24 were
airflow-based), and 108 features based on frequency (106
were sound-based, and 2 were airflow-based). These fea-
tures are described in detail in Tables 2 and 3. The
extracted features were normalized with respect to their
maximum value and had a range between 0 and 1.
Classification Method
The classification system presented in this study was based
on the establishment of subspaces corresponding to each
cough class using the principal components of the train-
ing samples from each class. The projections of the unclas-
sified cough features onto these subspaces formed the
foundation of the classification technique. Since there is
some resemblance between this method for cough classi-
fication and the eigenfaces method [15], the resulting
basis vectors defining the cough feature subspaces have
been described as eigencoughs. A principal component
analysis of the features extracted from the cough airflow
and sound signals was used to construct the class sub-
spaces. The training coughs for each class were selected.
For each set of training samples, construction of the sub-
spaces proceeded as follows.
The average of the class ('C
1
', 'C
2
' 'C
M
') samples is com-
puted as
where N
ω
is the number of exemplars of class
ω
, and x
i
ω
is
the feature vector of the i
th
exemplar of class
ω
. Now let
m
w
w
w
w
=∈
<>
∑
1
12
N
xCCC
i
i
M
, {’ ’,’ ’ ’ ’},
(1)
The high fidelity system used to simultaneously record sound pressure waves and airflow during a coughFigure 1
The high fidelity system used to simultaneously record sound pressure waves and airflow during a cough.
Cough 2009, 5:8 />Page 4 of 12
(page number not for citation purposes)
represent the matrix of the average-adjusted sample of
class
ω
. Next, the eigenvectors u
iw
of the scatter matrices of
each class sample were computed using the efficient tech-
nique proposed in [15], by first solving the eigenvalue
problem:
where
λ
j
ω
was the j
th
eigenvalue, and v
j
ω
is the j
th
eigenvec-
tor of matrix ( ). Finally, v
j
ω
was linearly mapped to
u
jw
using:
The eigenvectors were then arranged in a descending order
based on their corresponding eigenvalues. To differentiate
between normal and diseased cough, only the first K
eigenvectors were selected for the subspace projection.
Values of K were tested based on either the preservation of
95% of the energy or a reduced number of eigenvectors as
described in [15,16]. The final value of K that produced
the most accurate classification results was chosen. Once
the vector subspaces were constructed, individual coughs
were classified as illustrated in Figure 4. First the set of fea-
tures of an unclassified (novel) cough (C
q
) were extracted
and normalized (C
qN
). Then values of (C
qN
) were pro-
jected onto each of the cough class subspaces to obtain the
following set of weight coefficients as described by equa-
tion (5):
In the above expression
μ
ω
represents the mean vector,
and u
j
ω
is the j
th
eigenvector of class
ω
. The weight sets
were then used along with the sample means to recon-
struct C
qN
in each class subspace, thus obtaining the
approximations :
Next the representation error between C
qN
and its approx-
imation in each class was determined as follows:
Ax x
N
www ww
mm
=−
()
−
()
⎡
⎣
⎤
⎦
1
,
(2)
AA
T
j
j
j
ww
w
w
w
nln
= ,
(3)
AA
T
ww
uA
jj
w
w
w
n
= ,
(4)
{ } ( ) [ ], {’ ’,’ ’ ’ ’}.wC uuuu CCC
qN
T
jK
M
w
w
ww w w
mw
=−× ∈
12
12
(5)
ˆ
, ,
ˆ
TT
CCM1
ˆ
[ ] , {’ ’,’ ’ ’ ’},TuuuuwCCC
iK
T
M
w
w
ww w w
w
mw
=+ × ∈
12
12
(6)
Airflow and sound pressure wave measured during a voluntary coughFigure 2
Airflow and sound pressure wave measured during a voluntary cough. A and B display the signals for a normal sub-
ject. C and D show the corresponding measurements for a subject with abnormal lung physiology.
Cough 2009, 5:8 />Page 5 of 12
(page number not for citation purposes)
Finally, the novel cough coefficient C
q
was assigned to
class
ω
based on the least square error rule as follows:
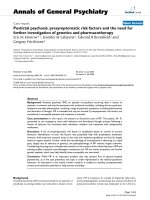
To assess the sensitivity and specificity of the classification
system, the Receiver Operating Characteristic (ROC) curve
[17] was constructed using the following assignment rule:
where r ranges from minimum to maximum values of the
ratio . The sensitivity and specificity of the classifica-
tion method are found as follows:
The overall performance or discriminative rate was
defined as:
Experimental Design
The dataset used in this research consisted of three coughs
each from 58 male subjects (31 diseased, 27 normal) and
54 female subjects (29 diseased, 25 normal). Male and
female training sets were considered separately. All the
coughs from each of the test subjects were used to train the
classifier with the exception of the three coughs from one
subject [17]. The three withheld coughs were then ana-
lyzed individually. If at least two out of the three coughs
were classified as either normal or abnormal, the subject
was assumed to be a member of that group. This proce-
dure was repeated until every subject had been evaluated.
Results
Results of Pulmonary Function Measurements
The results of lung function measurements made in the
pulmonary laboratory at Ruby Memorial Hospital, West
Virginia University, are shown in Table 1. The average
value (± SD) for the age, height, and weight of each group
of test subjects are also given along with their smoking
history. Pulmonary physicians' diagnoses were used to
determine if subjects had normal or abnormal lung func-
tion. Table 1 also indicates the number of subjects within
percent predicted ranges of their FEV
1.0
, FVC, and FEV
1.0
/
FVC ratio. Most test subjects with abnormal lung function
had mild to moderate impairment. Three voluntary
coughs from each of these subjects were analyzed to deter-
mine if their cough airflow and acoustic characteristics
could be used to establish if they had normal or abnormal
lung function.
Results of Classifying Voluntary Coughs
The results of the eigencough method for distinguishing
between coughs of normal subjects and subjects with lung
disease are shown in Table 4. The overall performance of
our optimal classifier was 94% for coughs from female
subjects and 97% for coughs from male subjects (K was
chosen to preserve 95% of the total energy). The ROC
curves for coughs from each gender are shown in Figure 5.
The point on the curve which yielded an equal sensitivity
and specificity was 98% for coughs from female subjects
and 98% for coughs from male subjects, respectively. Sev-
eral preliminarily experiments were performed to test and
adjust the parameters of the classification method to
improve its ability to discriminate between coughs of nor-
mal subjects and those with lung disease. Comparisons
were made between the results using only the cough air-
flow features, the cough sound features, or the fused fea-
tures from both signals [18]. When the fused features were
used, the overall classification accuracy reached 94% and
97% for coughs from female and male subjects respec-
tively. This was compared to accuracies of 85% and 91%
ew
w
w
=− ∈
∑
( ) , {’ ’,’ ’ ’ ’},TC CC C
qN
M
2
12
(7)
tCCC
qM
→= ∈
<>
ww e w
w
w
| arg min{ }, {’ ’,’ ’ ’ ’},
12
(8)
trCC
q
→= ∈
<>
ww
e
w
e
w
w
w
|argmin{ ,},{’’,’},
1
2
12
(9)
e
w
e
w
1
2
Sensitivity
number of True Positives
number of True Positives num
=
+
bber of False Negatives
Specificity
number of True Negatives
numb
,
=
eer of True Negatives number of False Positives+
,
OverallPerformance
number of True Positives number of True Negat
=
+
iives
Total number of Samples
,
Spectrograms of sound signals for voluntary coughsFigure 3
Spectrograms of sound signals for voluntary coughs.
A shows the joint time-frequency relationship from the nor-
mal cough shown in Figure 2A. B shows the relationship from
the abnormal cough shown in Figure 2C. Note: the highest
intensity is represented by red then yellow and is dark blue
at its lowest values.
Cough 2009, 5:8 />Page 6 of 12
(page number not for citation purposes)
for flow features only and 93% and 91% for sound fea-
tures only (K was chosen to preserve 95% of the total
energy).
A second experiment was performed to determine the
optimum number of principal components (K) used by
the classifier. According to the literature [15,16], K has
usually been selected to preserve either 90%, 95%, or 99%
of the total energy. It was determined that the overall clas-
sification accuracy in this study was 94% and 97% when
K was chosen to preserve 95% of the total energy for
female/male subjects. This can be compared to 94% and
93% for the case in which K preserved 90% of the energy
and 91% and 95% when K preserved 99% of the energy.
This indicated that some features may have introduced
noise which reduced the accuracy of the classifier.
Table 1: Description of group populations of test subjects.
Normal
Male (n = 27)*
Lung Disease
Male (n = 31)**
Normal
Female (n = 25)***
Lung Disease
Female (n = 29)**
Age (years) 51.19 ± 16.71 58.48 ± 9.88 52.12 ± 16.73 56.31 ± 14.53
Height (cm) 177 ± 10 173 ± 7.0 160 ± 7.0 160 ± 7.0
Weight (kg) 93.30 ± 20.02 88.48 ± 30.16 83.29 ± 27.13 76.8 ± 22.52
Smoking History
Never 9 3 13 8
Former 15 19 9 14
Current 3 9 3 7
FEV1 % Predicted
(>79) % 27 1 24 4
(60-79) % 0 15 0 13
(40-59) % 0 12 0 8
(<40) % 0 2 0 3
FVC % Predicted
(>79) %26162311
(60-79) % 0 12 0 9
(40-59) % 0 2 0 6
(<40) % 0 0 0 2
FEV1/FVC % Predicted
(>88) % 23 9 23 14
(70-88) % 3 6 0 10
(60-69) % 0 8 0 0
(40-59) % 0 6 0 3
(<40) % 0 1 0 1
* One subject in this group was evaluated without a FVC measurement.
** One subject in each group of these two groups was diagnosed without spirometry.
*** One subject in this group was evaluated without a FVC measurement and one was evaluated without spirometry measurements.
Cough 2009, 5:8 />Page 7 of 12
(page number not for citation purposes)
Table 2: Cough flow signal extracted features.
Time Series
1 Peak cough flow (L/s)
2 Average cough flow (L/s)
3 Maximum cough flow acceleration(L/s
2
)
4 Total cough volume (L)
5 Time at which 25% cough volume has been expelled/time at which 100% cough volume has been expelled
6 Time at which 50% cough volume has been expelled/time at which 100% cough volume has been expelled
7 Time at which 75% cough volume has been expelled/time at which 100% cough volume has been expelled
8 25% total time of cough/cough volume
9 50% total time of cough/cough volume
10 75% total time of cough/cough volume
11 Time at peak flow/total time
12 Crest Factor: maximum flow/Root Mean Square "RMS" flow
13 Form Factor: RMS flow/mean flow
14
Transit time: (s)
15
Skewness: where μ, and σ are the mean, and the standard deviation of the cough airflow signal respectively.
16
Kurtosis: where μ, and σ are the mean, and the standard deviation of the cough airflow signal respectively.
17 Cough flow variance
18 Cough flow variance normalized with respect to volume
19-20 The top two principal components for flow*
21-22 The top two principal components for volume*
23-24 The top two principal components for Acceleration*
Frequency Series
25 Beta: the inverse power law 1/f
β
of the power spectrum [22].
26 Wavelet parameter based on the variability in the wavelet detail coefficients found in the wavelet decomposition of the cough flow
*Only the first two principal components were used, as experimentally the accuracy started to drop afterwards.
cough flow
total volume
tdt
_
_
*
∫
Ex u()−
3
3
s
Ex u()−
4
4
s
Cough 2009, 5:8 />Page 8 of 12
(page number not for citation purposes)
Discussion
The goal of this study was to determine if the characteris-
tics of voluntary coughs could be used to distinguish
between individuals with normal and abnormal lung
function. The approach was to measure a wide variety of
features describing both the acoustical and airflow charac-
teristics of a voluntary cough in both the time and fre-
quency domains. It should be pointed out that the
features were selected arbitrarily and there was no attempt
to optimize their selection. Once they were determined,
all the features were normalized with respect to their max-
imum values. The next step was to use a principal compo-
nent analysis to eliminate redundant information
contained in the feature set. Then, the principal compo-
Table 3: Cough sound signal extracted features.
Time Series
1 Cough Length: length from the start of the cough until 99.4% of the cough energy is achieved (s)
2 L-ratio: Cough flow length/cough sound length
3
Skewness: where μ, and σ are the mean, and the standard deviation of the cough sound signal respectively.
4
Kurtosis: where μ, and σ are the mean, and the standard deviation of the cough sound signal respectively.
5 Crest Factor: maximum sound pressure wave/Root Mean Square "RMS" sound
Frequency Series
6 Dominant Frequency: the frequency with the most power present in the cough sound pressure wave (Hz)
7Total energy
8-24 Octave Analysis (1-17)**
25 Total Power: total power in the cough sound signal (W)
26 Peak Power: maximum power level (W)
27 Average Power: Average power over all frequency ranges (W)
28 Sound beta: the inverse power law 1/f
β
of the power spectrum [22].
29 Sound Wavelet: a wavelet parameter based on the variability in the wavelet detail coefficients found in the wavelet decomposition of the
cough sound
30 Ratio: mean spectrogram intensity/max spectrogram intensity
31 Peaks: this counts the number of peaks in the spectrogram that meet a given threshold
32-51 Spec1 - Spec20: The spectrogram is broken into 20 evenly spaced time intervals. For each interval, the maximum energy is found, and the
corresponding frequency is saved.
52-81 Spec21 - Spec50: The spectrogram is broken into 30 evenly space time intervals. For each interval, the average frequency is calculated
and saved.
82-111 Spec51 - Spec80: The spectrogram is broken into 30 evenly spaced frequency intervals. For each frequency interval the time at which half
of the energy is attained is saved.
**Octave analysis: the power of cough sound pressure wave is broken into octaves (frequency bands) and the power found in each octave is
calculated in each band. Analysis was stopped at 18,102 Hz, because only 2% of the energy remains above Oct17.
Ex u()
−
3
3
s
Ex u()
−
4
4
s
Cough 2009, 5:8 />Page 9 of 12
(page number not for citation purposes)
nents of the features were used to define a reduced
number of orthogonal vectors representing each cough.
A unique approach for developing a classifier for catego-
rizing voluntary coughs was used that was based on the
subspace projection of the principal components into a
vector space. One of the most important parameters of the
classifier was determining K, the number of principal
components needed in the analysis. The initial expecta-
tions were that the results would be more accurate using
the highest value of K. This was not the case, however, and
inclusion of some of the cough parameters appeared to
increase noise. It was found in preliminary experiments
that increasing K to preserve 95% of the energy contained
in the data sets enhanced the performance of the classifier.
In contrast, however, for both female and male groups,
the classifier performance deteriorated when K was
increased to preserve 99% of the energy in the cough
parameters.
Due to the limited number of samples, the classifier was
trained using all the data from all the subjects in each
group except one. The coughs of that subject were evalu-
ated using the trained system. This process was repeated
for each member of the male and female test groups.
An analysis of the overall performance of our optimal
classification system showed that there were 3 misclassifi-
cations within the group of the 58 male subjects. There
were 0 subjects with normal lung function that were clas-
sified as having abnormal lung function and 3 subjects
who had abnormal lung function but were identified as
having normal lung function. Out of the total population
of 54 women subjects, 3 were misclassified. There were 0
subjects with normal lung function who were classified
incorrectly and 3 subjects with abnormal lung function
who were recognized as having normal lung function. Fig-
ure 5 shows the sensitivity and specificity of the cough
analysis method for detecting abnormal lung function in
male and female test subjects. The classification criteria
can be chosen so that a sensitivity and specificity can be
selected depending upon the type of errors that are accept-
able for a given testing scheme.
Even though the original feature set was reduced by
choosing the largest eigenvectors during the classification
process, optimization of the selection of the feature set as
well as different methods of feature normalization
remains an area of research to be explored. It should also
be pointed out that only one type of classifier was tested
in the present study. It is possible that for a given feature
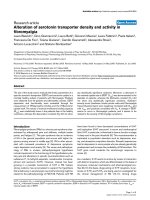
Cough reconstruction and classification methodFigure 4
Cough reconstruction and classification method.
Cough 2009, 5:8 />Page 10 of 12
(page number not for citation purposes)
set, other classifiers using neural networks, genetic algo-
rithms, etc., may provide even better results.
Under certain circumstances, using cough airflow and
sound analysis to detect abnormal lung function has sev-
eral advantages compared with conventional pulmonary
function testing methods. First, cough analysis may be
useful as a screening method to quickly evaluate changes
in lung function of a large population of test subjects in a
short period of time. Future studies should evaluate the
utility of cough analysis in early disease detection. Experi-
ence has shown that subjects show little reluctance to per-
forming a voluntary cough for testing purposes. The
procedure is performed easily and quickly and requires a
minimum of training since test subjects are usually very
familiar with a voluntary cough maneuver. Another
advantage is that voluntary coughs can be performed by
the very young, the physically challenged, and geriatric
subjects who may not be able to easily perform conven-
tional pulmonary function tests. It is also possible that
cough feature analysis can be useful in tracking the pro-
gression or recovery of pulmonary disorders without per-
forming more strenuous flow-volume tests.
In the future voluntary coughs could be used to distin-
guish between types of pulmonary disorders such as
obstructive and restrictive lung diseases. There is some
preliminary evidence that voluntary cough characteristics
may be related to changes in specific airway resistance in
animals [19] which may also hold true for humans. It
should be noted that the accuracy of cough feature analy-
sis could still be improved in a variety of ways. For
instance, new features may be identified and extracted to
provide additional information and increase the accuracy
of the classification system. The acoustic and airflow fea-
tures could be fused at different levels to improve accuracy
[20], and existing features that add noise, but contribute
little information to the classification system, could be
eliminated [21]. Preliminarily experiments have shown
that fusion of the data at the feature level [18] improved
the performance of the classifier.
A limitation of this study is that variables such as age,
body height, body weight and race, which are known to
have an effect on forced pulmonary function indices, were
not considered when classifying coughs from test subjects.
These factors have been shown to be important when cal-
culating percent predicted values of many pulmonary
function indices. As additional test results involving vol-
untary cough analysis become available, consideration of
these parameters should lead to an increased ability of the
cough analysis system to discriminate between groups of
subjects with normal and abnormal lung function.
It is possible that more appropriate features may be
extracted from the data and that other features that do not
contribute or even reduce the classification accuracy of the
system can be eliminated. However, the classification
technique presented in this research provides a highly
accurate method of distinguishing between subjects with
normal and abnormal lung function based on voluntary
cough characteristics.
Table 4: Classification accuracy for normal versus diseased coughs.
System Output for Male Coughs
Diseased
(Obst. & Rest.)
Normal
True Class Diseased
(Obst. & Rest.)
94% 6%
Normal 0% 100%
Overall Performance 97%
System Output for Female coughs
Diseased
(Obst. & Rest.)
Normal
True Class Diseased
(Obst. & Rest.)
90% 10%
Normal 0% 100%
Overall Performance 94%
Cough 2009, 5:8 />Page 11 of 12
(page number not for citation purposes)
Conclusion
This paper describes the development and initial assess-
ment of a unique approach for classifying voluntary
coughs from normal subjects and subjects with lung dis-
orders using features extracted from the cough sound and
airflow signals. The novel classification system was
trained to detect differences between the projection of
principal components derived from the features of coughs
from male and female test subjects with normal and
abnormal lung function. The method is accurate, and can
be easily and quickly administered. In the future, cough
feature analysis could be used to screen large populations
of test subjects in a minimum of time. It is also well suited
for testing subjects who may not be able to perform con-
ventional pulmonary function tests.
Competing interests
The findings and conclusions of this report are those of
the authors and do not necessarily represent the views of
the National Institute for Occupational Safety and Health.
Authors' contributions
AAA, JSR, WTG and DGF participated in the design of the
study, analyzed the data, and drafted the manuscript. ELP,
JBD, AMM, and WGM participated in the design of the
ROC curves of classification results for normal versus diseased coughs of male and female subjectsFigure 5
ROC curves of classification results for normal versus diseased coughs of male and female subjects.
Publish with BioMed Central and every
scientist can read your work free of charge
"BioMed Central will be the most significant development for
disseminating the results of biomedical research in our lifetime."
Sir Paul Nurse, Cancer Research UK
Your research papers will be:
available free of charge to the entire biomedical community
peer reviewed and published immediately upon acceptance
cited in PubMed and archived on PubMed Central
yours — you keep the copyright
Submit your manuscript here:
/>BioMedcentral
Cough 2009, 5:8 />Page 12 of 12
(page number not for citation purposes)
study and collected the data. All the authors read and
approved the final manuscript.
Acknowledgements
This research was funded by National Institute for Occupational Safety and
Health.
References
1. Korpas J, Tomori Z: Cough and other Respiratory reflexes. Karger
1979.
2. Everett CF, Kastelik JA, Thompson RH, Morice AH: Chronic per-
sistent cough in the community: a questionnaire survey.
Cough 2007, 3:5.
3. Smith JA, Ashurst HL, Jack S, Woodcock AA, Earis JE: The descrip-
tion of cough sounds by healthcare professionals. Cough 2006,
2:1.
4. Korpas J, Sadlonova J, Vrabec M: Analysis of the cough sound: an
overview. Pulm Pharmacol 1996, 9:261-268.
5. Korpas J, Vrabec M, Sadlonova J, Salat D, Debreczeni LA: Analysis of
the cough sound frequency in adults and children with bron-
chial asthma. Acta Physiol Hung 2003, 90:27-34.
6. Day J, Goldsmith T, Barkley J, Day J, Afshari A, Frazer D: Identifica-
tion of individuals using voluntary cough characteristics. Bio-
medical Engineering Society Meeting 2004:97.
7. Doherty MJ, Wang LJ, Donague S, Pearson MG, Downs P, Stoneman
SAT, Earis JE: The acoustic properties of capsaicin-induced
cough in healthy subjects. European Respiratory Journal 1997,
10:202-207.
8. Murata A, Taniguchi Y, Hashimoto Y, Kaneko Y, Takasaki Y, Kudoh S:
Discrimination of productive and non-productive cough by
sound analysis. Internal Medicine 1998, 37:732-735.
9. Thorpe CW, Toop LJ, Dawson KP: Towards a Quantitative
Description of Asthmatic Cough Sounds. European Respiratory
Journal 1992, 5:685-692.
10. Toop LJ, Dawson KP, Thorpe CW: A Portable System for the
Spectral-Analysis of Cough Sounds in Asthma. Journal of
Asthma 1990, 27:393-397.
11. Toop LJ, Thorpe CW, Fright R: Cough Sound Analysis - a New
Tool for the Diagnosis of Asthma. Family Practice 1989, 6:83-85.
12. Van Hirtum A, Berckmans D: Assessing the sound of cough
towards vocality. Medical Engineering & Physics 2002, 24:535-540.
13. Van Hirtum A, Berckmans D: Automated recognition of sponta-
neous versus voluntary cough. Medical Engineering & Physics 2002,
24:541-545.
14. Goldsmith W, Mahmoud A, Reynolds J, McKinney W, Afshari A,
Abaza A, Frazer D: A System for Recording High Fidelity
Cough Sound and Airflow Characteristics. Annals of Biomedical
Engineering 2009.
15. Turk M, Pentland A: EIGENFACES FOR RECOGNITION. Jour-
nal of Cognitive Neuroscience 1991, 3:71-86.
16. Belhumeur PN, Hespanha JP, Kriegman DJ: Eigenfaces vs. Fisher-
faces: Recognition using class specific linear projection. Ieee
Transactions on Pattern Analysis and Machine Intelligence 1997,
19:711-720.
17. Duda RO, Hart PE, Stork DG: Pattern Classification 2nd edition. Wiley;
2000.
18. Ross A, Nandakumar K, Jain A: Handbook of multibiometrics Springer;
2006.
19. Day JW, Reynolds JS, Frazer DG, Day JB: Correlation between
cough sound characteristics and airway resistance in gineau
pigs. Biomedical Engineering Society Meeting; Philadelphia, PA 2004:95.
20. Abaza AA, Reynolds JS, Frazer DG: Characteristics to identify
subjects with different lung diseases. The 12th Biennial Sympo-
sium on Statistical Methods; Decatur, GA 2009.
21. Abaza AA, Mahmoud AM, Day JB, Goldsmith WT, Afshari AA, Rey-
nolds JS, Frazer DG: Feature selection of voluntary cough pat-
terns for detecting lung diseases. IFMBE 2008:323-328.
22. Bates JHT, Maksym GN, Navajas D, Suki B: Lung-Tissue Rheology
and 1/F Noise. Annals of Biomedical Engineering 1994, 22:674-681.