Carbon Materials for Advanced Technologies Episode 7 ppsx
Bạn đang xem bản rút gọn của tài liệu. Xem và tải ngay bản đầy đủ của tài liệu tại đây (1017.78 KB, 40 trang )
220
Table
9.
Effect
of
blending coal-derived pitches from
WVGS
13421
on
elemental
composition (daf)
NMF-soluble
75.25 wt% 25 75
wt%
450°C
extract
EXT.HEXT
EXT
HEXT
hydrogenation
EXT 450
450 HEXT450
C 84 2
85
9 88 6 88.1
H
5.5 53 56 5.8
N
2.1 24 22 22
S
os
0.6
0.8
0'
74
3.0 31
C/H
atormc
128 134 134 126
ratio
+oxygen by difference
For the most part, the elemental analysis data for the blends are consistent with a
weighted average of the lndividual components.
Also
shown is the elemental
analysis for some of the soluble products form
WVGS
13423
in
Table 10
As
was observed for the
WVGS
13421 products, hydrogenation increased the total
hydrogen content and decreased the atomic
C/H
rabo.
Table
10.
Elemental composition of products from
WVGS
13423
NMP-soluble
extract
75 25
wt%
450°C
hydrogenation
EXT
EXT: HEXT45
0
HEXT450
C 84.9 86.3 85.5
H
N
S
0
53
2.0
07
70
5.6
24
59
19
04
34
C/H
atormc
ratio
133 129 1 26
'oxygen
by
difference
One effect of the degree of hydrogenation
is
to lower the softening polnt and
glass transition temperature, T,, of the pitch as shown in Table 11. The
occurrence of a softenlng point and glass transition demonstrates the pitch-like
character of the hydrogenated products, although these values are sbll
considerably higher than most commercial pitches.
Only a limited number of coal-derived pitches were examned by
'H
NMR
because of their low solubihty in solvents commonly used
111
convenbonal
proton magnetic resonance.
Table
12
reports the distribubon of hydrogen for
three
of
the pitches. Unlike coal-tar pitches, which typically have over
85%
of
the hydrogen bonded to aromatic carbon, the matenals listed in Table 12 are
characterized by a high content of aliphabc hydrogen.
22
1
Table
11.
Characteristics of NMP-soluble pitches from WVGS
13421
NMP-soluble
400°C
450°C 75.25
wt%
extract hydrogenation
hydrogenahon
EXT:HEXT
EXT HEXT4OO HEXT450 450
Glass
"C
Mettler
transition
T,,
___-
'168 *76 *76
softening
4300
173 158 165
pomt, "C
+by
thermal mechanical analysis,
*
by differential scanning calonrnetry
Table
12.
'H
NMR
characterlzation
of
coal-derived pitches
WVGS
13421
WVGS
13407
WVGS
13421 75.25
wt%
NMP-soluble extract
450°C
hydrogenation
EXT HEXT450
'H
distribution
Aromatic
H,
%Ha
29 39 41
Aliphatic
H,
%Hal
71 61 59
Size exclusion chromatography
(SEC)
using trichlorobenzene as a solvent was
used to determme the number average molecular weight (MWJ distribution
of
several of the coal-derived pitches. The molecular weight distribution for all the
materials is quite broad, with a considerable amount exceedmg a MW, of
several hundreds. Typically, the molecular weight averages were between MW,
of
400
and
500.
These values are only slightly higher than those for commercial
pitches. Moreover, the
wdth
and shape of the molecular weight distribution
curves for the coal extracts are generally simlar to those for commercial
pitches.
2
3
Ash reduction
in
coal-derivedpitches
One of the more lmportant considerations in detemmg the end use of
synthetic graphte
is
its contamination with metallic components Metals such
as iron, vanadium, and especially in nuclear applications, boron are deleterious
to
the performance of graphte Table
3
presented the extrachon yields
of
NMP-
soluble material for three biturnnous coals. For these coals, rmneral matter and
insoluble coal residue were separated from the extract by simple filtration
through
1-2
pm filter paper Table
13
lists the high-temperature ash content m
the
dry
coal, and m their correspondmg NMP-insoluble and NMP-soluble
products. The reduced ash content of the extract
is
typically between
0.1
to
0.3
wt%
using traditional filtration techniques for the small-scaled extraction
experments
222
To reduce the quantity of ash
in
the extracts even further, steps were
implemented using a sequential solids removal scheme that entailed a
combination of centrifugation and filtration. Following extraction of the coal
Table
13.
Ash
content
in
WVGS coals and coal products
Weight
%
ash
WVGS
ID
13407
13421
13423
Coal,
dry
14.0 3.2 3.8
Residue
29.3 4.6 4.7
Extract
0.2 0.1 0.3
Yield
of
extract (daf)
66.3 35.7 34.2
with
NMP,
the mixture was placed in a centrifuge during which time the
particulates were subjected to 2000
G
for
two
hours. The supernatant liquid was
removed from the solids by simply decanting and then filtering through 1-2 pm
filter paper. The resulting filtrate was centrifuged again for an extended period
of time (overnight) at
2000
G.
Again the supernatant liquid was separated by
decanting and then filtered through 0.2 pm filter paper. Table 14 shows the
results using the above process for
WVGS
13421 coal where it can be seen that
significant ash reduction is possible.
Table
14.
Results
of
de-ashlng experiments using centrifugation
and
filtration
of
WVGS
1342
1
Material Weight
%
ash
Dry
coal
3.2
Raw extract
0.1
Second centrifugation
0.05
While the quantity of
ash
in the extracts is rather low, after coking and calcining
the ash constituents are slightly concentrated in the carbons because of the small
volatile matter loss from the extracts. For example, Table 15 shows the ash
content of products from
WVGS
13421. The extract was obtained using the
large-batch extractor as described earlier. The product was de-ashed by first
centrifuging at 2000
G
for
90
minutes followed by filtration through 1-2 pm
filter paper. The product was recovered, dried, and converted to green and
calcined coke.
Table
15.
Ash content
of
WVGS
13421
and
its products
Raw coal NMP-extract Residue Green coke Calcined
coke
Ash. wt%
3.03 0.04 3 34 0.15 0.24
To determined if the ash removal steps could be simplified, experiments were
performed on hydrogenated coals. Hydrogenation experiments were conducted
at 400°C in tetralin and the pitch isolated from the insoluble mmeral matter and
223
coal by centrifugation alone at
2000
G
for
60
minutes without the use of
NMP.
The supernatant liquid was decanted and dried under vacuum at
150°C.
Table
16
lists the yield of products and their ash contents.
Table
16.
Ash content
of
raw coal and
their
hydrogenated coal products, wt%
Supernatant liquid Insoluble solids
Yield
Yield
Coal sample
Raw
product Ash
content
product Ash content
WVGS
13407
13.6
43
<o.
1
52 19.3
WVGS
13421
3.0
38
<o.
1
55 5.4
coal
Note that the yield of extract product presented here is lower than that reported
earlier in Table
4
because the hydrogenated products were not extracted with
NMP
but were centrifuged directly. The data show that centrifugation by itself,
and without any accompanying filtration, appears to provide pitches of
acceptable purity, albeit with an associated lower yield.
The coal-derived pitch precursors for
WW-1, WW-2,
and
WW-3
test
graphites were de-ashed by the combined centrifugation and filtration method
while all
of
the other pitches were de-ashed by centrifugation alone
(2000
G,
90
minutes).
3
Preparation and Characteristics of Cokes Produced from Solvent
Extraction
3.1 Preparation of
green
and calcined cokes
Two reactor types were used to convert coal-derived pitches into green coke.
A
heavy, carbon-steel pipe (about
0.75
m long by
5
cm inside diameter) was
machined at both ends such that plugs could be inserted to seal the system. The
coking reactor was filled approximately 213
full with pitch, flushed with
nitrogen, and then sealed. The coking reactor was inserted into a ceramic tube
furnace and heated in
two
stages.
In
the first stage the coal pitch was heated to
400°C.
In
this stage the material becomes a molten mass. The tube was kept at
ths
condition for 12 hours. In the second stage, the tube reactor contents were
then raised to
600°C
and held at this temperature for one hour, whereupon the
tube was permitted to cool to room temperature.
The product was then
recovered and weighed. The green coke precursors for
WW-1,
WW-2,
and
WW-3
test graphites,
WVGS 13407
NMP-soluble extract, NMP-soluble
extract
from
350°C
hydrogenated
WVGS
13407, and
WVGS 13421
NMP-
soluble extract, respectively, were made with this system.
224
All subsequent green coke operations were made in a second coker, which was
fashioned from steel pipe approximately
18
cm
in
diameter and
25
cm in length.
A metal plate was welded
to
one end and a metal collar was welded
to
the other
end such that a steel lid could be bolted to the system. Typically, about
250
to
500
g of pitch were sealed under nitrogen
in
the coker reactor and the system
placed in a large temperature-programmable furnace. The heat treatment
process was as follows. The temperature was raised
5"C/min
to
350
"C and then
l"C/min to
425°C
and the temperature held at
425°C
for
90
minutes. Finally
the temperature was raised further at
3"C/min
to between
500
and
600"C,
and
held there for
3
hours. The coker was cooled to room temperature and the
material recovered to determine green coke yield.
The green cokes were calcined by placing a weighed amount of green coke into
an
alumina tube. The tube was fitted with end caps to allow for a constant purge
of nitrogen. The alumina tube was then inserted into a high-temperature furnace
and the temperature raised to about
1000°C
for a period between
30
and
60
minutes. The furnace was turned off, cooled to room temperature, and the
product recovered to determine the calcined coke yield.
The effect of hydrogenation
on
the yield of green coke is shown
in
Table
17.
Thermogravimetric analysis (TGA) was also conducted for comparison.
It
can
be seen that the pitch from unhydrogenated coal results in a fairly high yield of
green coke. As the severity of hydrogenation increased the green coke yield
decreased, probably because
of
molecular weight reduction and loss of low-
molecular weight species during coking. Also, in general, TGA yields are lower
than the yields obtained from the green coking operation. Undoubtedly, during
the green-coke process in the sealed reactor, some reflux occurred, promoting
additional condensation and enhanced carbon yield. The TGA experiment,
which involves rapid heating under a flowing inert gas atmosphere, tends to
promote enhanced distillation of volatile species.
Tables 18 and
19
show the effects of blending extracts
of
hydrogenated coal
with
those
from untreated coal for WVGS
13421
and WVGS
13423,
respectively.
For
both coals, the amount of hydrogenated material
in
the blend
causes a reduction
in
coke yield. Again,
the
TGA yields are generally lower
than the yields obtained using the coking reactor. This is particularly
pronounced for the WVGS
13423
coal following hydrogenation at
450"C,
where the TGA yield is only
34
wt%. As noted previously, the hydrogenated
products from WVGS
13423
are relatively volatile.
225
Table
17.
Effect
of hydrogenation on green coke yields
WVGS 13407 71.4 71.0
Coal Green coke yield,
wt%
TGA
yield,
wt%
EXT
60.3
HEXT3 50
WVGS
13421
EXT 71.2 80.0
HEXT400
62.8
HEXT450 57.1 51.0
WVGS
13423
EXT
70.3
61.5
HEXT450 52.3 34.0
Table
18.
Effect
of
blending hydrogenated coal-derived pitch
and
coal extract on green
coke yields, WVGS
13421
Blending ratio Green coke yield,
wt%
TGA yield,
wt%
100.0 EXTHEXT450 71.2 80
0
75.25 EXTHEXT450 69.6
25:75 EXT:HEXT450 62.9
0.100 EXT.HEXT450 57.1
63.5
52.9
51.0
Table
19.
Effect
of
blending hydrogenated coal-derived pitch and
coal
extract on green
coke yields,
WVGS
13423
Blending ratio Green coke yield,
wt%
TGA yeld,
wt%
1OO:O EXT:HEXT450 70.3 61.5
75:25 EXT:HEXT450 61.7 57.7
25:75 EXTHEXT450 47.2 40.4
0:lOO
EXT:HEXT450 52.3 34.0
Table
20
reports the yield of calcined cokes for several of the graphite
precursors. The high-coke yields indicate that most of the volatiles were lost
during
the green coking operation. Since no visible tar or smoke occurred
during calcinabon, most
of
the weight
loss
is attributed to evolution
of
hydrogen, non-condensable hydrocarbons, and other light gases.
3.2
Analysis
of
cokes
by
optical
microscopy
Polarized light photomicrographs were taken
of
the green and calcined cokes, as
well as their corresponding test graphites. The untreated extract cokes are
characterized by very small anisotropic domains on the order of
3
microns or
less.
This
type
of
optical structure is believed
to
be highly desirable for nuclear
graphite applications.
226
Table
20.
Yield
of
calcined
coke
for
WVU
test graphites
WVGS
13421
Calcined coke yield.
wt%
HEXT4OO
75:25 EXT:HEXT400
60:40 EXT:HEXT350
EXT
75:25 EXT:HEXT450
25:75 EXT:HEXT450
HEXT450
93.8
96.1
95.5
92.8
91.6
92.7
94.2
WVGS
13423
EXT 87.0
75 :27 EXT:HEXT450 91.1
25:75 EXT:HEXT450 93.1
HEXT450 92.0
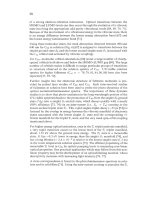
In contrast, the hydrogenated extracts show much larger anisotropic domain
structures, increasing in size with increasing hydrogenation severity, which is
consistent with the reduced coefficient of thermal expansion
(CTE)
exhibited by
the test graphtes as discussed later. Further, blending hydrogenated material
with untreated extract results in anisotropic domains of an intermediate size.
Thus by varying the process parameters, a variety of cokes can be prepared to
produce tailored graphites with a range of anisotropy. Figure
1
shows the
effects of blending on the development of optical texture. Indeed, the
manufacture of graphites ranging from very isotropic to highly anisotropic is
possible from a single coal source by controlling blending composition and
hydrogenation. This finding was also substantiated by Seehra
et
al.
[22]
in a
recent publication.
3.3
Ash
analysis
of
cokes
Table
21
reports the ash content and ash composition (determined by
inductively coupled plasma-atomic emission spectroscopy, ICP-AES) for all
of
the calcined cokes used to fabricate the test graphites. It can be seen that the
amount
of
ash and its make-up are variable, but are within the range observed
for petroleum-based calcined cokes. Although the ash contents in all of the
calcined cokes appear rather high, these materials may still be acceptable
because many of the metallic species are driven off during graphitization.
This
aspect is addressed in the next section.
227
Figure
1.
Optical photomicrographs of green cokes derived from
WVGS
13421
pitches:
top,
EXT;
middle,
75:25 EXT:HEXT450;
bottom,
HEXT450
Table
21.
Ash content and composition
of
calcined cokes used
to
make the
WW
graphites
00
wvu-
wvu- wvu-
wvu-
wvu-
wvu- wvu-
wvu-
w-
ww-
wvu-
wvu-
ww-
1
2
3
4 5
6 7
8
9 10
11
12 13
13421 13421 13421 13421 13423 13423
75~25 25175
75:25 60:40 25:75 75~25
EXT. EXT:
13423 13407 13421 13421
EXT: EXT: EXT: EXT:
Precur
13407
HEXT
13421
HEXT HEXT HEXT HEXT HEXT HEXT
13423
HEXT HEXT HEXT
EXT
350
EXT
400 450 400 350 450 450
EXT
450 450 450
sor
Sulfur
wtyo
0.53 0.45 0.56 0.54 0.40 0.60 0.65 0.46 0.64 0.62 0.56 0.36 0.32
Ash
wt%
0.76
0
76 0.29 0.29 0.24 0.34 0.29 0.16 0.47 0.61 0.91 0.25 0.43
Metals
PPm
B
6.8 5.3 2.1 3.8 31 3.1 3.0 2.6 3.6 3.0 2.4 3.4 3.3
Na
346.0 36.0 37.0 56
0
16.0
81.0 79.0 20.0 51.0 27.0 37.0 17.0 126.0
Mg
1470 380 12.0
8.8
58
80
2.3 8.6 9.5 11.0 15
0
60.0 17.0
A1 274.0 239.0 41.0 94.0 35.0 57.0 19.0 80.0 115.0 93.0 188.0 57.0 297.0
Si
474.0 281.0 60
0
279.0 173.0
88.0
12.0 70.0 341.0 4.0 298.0
80.0
594.0
K
32.0 29.0
8.8
5.7 4.3 0.6 3.9 5.9 11.8 9.0 26.0
__
39.0
Ca
759.0 365.0 87.0 65.0 128.0 20.0 16.0
15.0
16.8 38.0 121.0 132.0 128.0
Ti
429.0 509.0 77.0 125.0 6.6 87.0 94.0
____
59.8 206.0 139.0 60.0 40.0
V
20.0 17.0 4.9 7.9 1.9 1.7
I
.8
2.8 5.6 11.0 12.0 6.0 2.0
Cr
28.0 61.0 9.4 23.0 17.0 84.0 63.0 5.0 55.2 300.0 294.0 72.0 170.0
Fe
778.0 1879.0 999.0 643.0 537
0
1209.0 286.0 504.0 1795.0 1779.0 37040 597.0 645.0
Mn
11.0 29
0
22.0 10
0
30.0 15
0
12.0
__
18.1 44.0 57
0
40.0 50.0
NI
13
0
25
0
13.0 20.0 15.0 43
0
33.0 38.0 32.7 162.0 152.0 38.0 38.0
Cu
252.0 25.0 111
0
74
0
444.0 92 1 294.0
412.9 1036.0 653.0 4490- 227.0
Zn
240 12.0 207.0 77.0 220 1060
100
__
8.4 61.0 98.0 27.0 15.0
P
____
45.0 0.4
1.1
____
04 0.2 52.0 0.4
____
____
__-_
____
229
4
Preparation and Evaluation
of
Graphite From Coal-Derived Feedstocks
Test graphites were made from calcined coke which was initially milled into a
fine
flour
so
that about 50% passed through a
200
mesh Tyler screen. The coke
flour
was then mixed with
a
standard coal-tar binder pitch
(1 1 0°C
softening
point) at about 155°C. The ratio
of
pitch to coke
is
about 34:100 parts by
weight. After mixing with the liquid pitch, the blend was transferred to the mud
cylinder of an extrusion press heated to about
120°C.
The mix was then
extruded into 3-cm diameter by 15-cm long cylinders and cooled. These green
rods were then packed in coke breeze and baked in saggers to 800°C at a
heating rate
of
60"Ckour.
The baked rods were graphitized to about 3000°C in
a graphite tube furnace. In most cases, the graphite rods were machined into
rectangular specimens 2-cm wide by 15-cm long for measurement of the CTE.
4.
I
Analytical characterization
c
f
graphites
In order to assess the loss
of
inorganic contaminants during graphibzation, the
ash composition of most of the graphites was analyzed by ICP-AES. The total
ash contents
of
the
WW
graphites are compared to those for the precursor
calcined cokes in Table 22. Also included are data for H-45
1
and
VNEA,
which
are the current qualified nuclear-grade graphites.
The elemental ash composition for most
of
the graphites, as measured by ICP-
AES,
are compiled
in
Table
23.
The results show that most of the inorganic
matter is removed during the graphitization process. The elemental
compositions
of
the
WW
graphites are in the same range as the commercial
nuclear graphites which have presumably undergone extensive additional
halogen purification.
Table
22.
Ash
contents
of
calcined
cokes
and
thelr
processed graphites (ppm)
WJ-
1
7600
290
ww-2
7600
370
ww-3
2900
680
ww-4
2900 380
ww-5
2400
70
WW-G
3400 130
ww-7 2900
1020
WVU-8
1
GOO
100
WVU-9 4700 100
VNEA
____
220
60
H-45
1
____
Calcined
coke
Graphitc
230
The results in Table
22
are of crucial importance. Indications are that the ash
percentage
in
the calcined cokes produced from coal may already be low
enough to yield acceptable graphite. The
WW
graphites have not been halogen
purified treated and yet yield metal composition comparable to, or better than
H-
451 or VNEA graphite. Since the chlorine treatment is quite costly, significant
economic advantages may accrue from the production
of
graphite from coal.
4.2
Correlation
c
f
graphite properties with processing methodology
A key factor
in
the suitability of cokes for graphite production is their isotropy
as determined by the coefficient of thermal expansion. After the calcined coke
was manufactured into graphite, the axial CTE values of the graphite test bars
were determined using a capacitance bridge method over a temperature range of
25
to 100°C. The results are summarized in Table 24.
Also included
in
the
table are bulk density measurement of calcined cokes and the resistivity values
of their graphites.
The degree
of
isotropy of the graphites varied, as indicated by the CTE,
depending upon the characteristics of the starting coal-derived pitches. Such
control can be exercised
in
two
distinct ways. In the first method, the severity
of the hydrogenation conditions to which the raw coal was subjected, was varied
by changing the hydrogenation temperature. The higher the reaction
temperature the more hydrogen was transferred to the coal-derived pitch. The
most severe hydrogenation conditions produced the most anisotropic graphites
while the least severe, or no hydrogenation at all, produced materials which
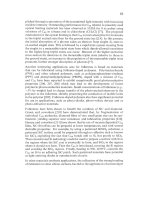
were more isotropic. For example in Figure 2 the effect
of
hydrogen addition
on the resultant graphite CTE is shown. It
is
apparent that little hydrogen
is
required to reduce the CTE value dramatically. Furthemore, the addition of
more than about 0.5
wt%
hydrogen to the coal pitch only reduces the CTE
slightly. Qualitatively, the degree of isotropy could be easily seen by
examination of the photomicrographs of the cokes and graphites.
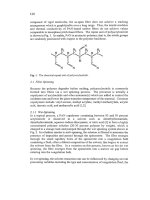
A second method for varying the degree of anisotropy
in
coal-based graphites
was achieved by blending the hydrogenated coal-derived extract
with
that
from
the non-hydrogenated raw coal. Hence, by varying the proportions
of
the
unhydrogenated and hydrogenated pitch, graphites with controlled CTE can be
obtained. These CTE values range between the most anisotropic graphites
m
the case of the pure hydrogenated pitch to the most isotropic graphites in the
case of the raw coal extract. The effect
of
blending composition on CTE for
pitches derived
from
WVGS
1342
1
is shown
in
Figure 3. When the same types
of
pitches and graphites were obtained from
WVGS
13423 the effect was the
same, though the exact functional relationship was different.
Table 23.
Metals analysis
of
WVU
graphites
by
ICP-AES
(ppm)
Metal WVU-1 WVU-2 WVU-3 WVIJ-4
WVU-5 WVU-6
WW-7 WVU-8
WVU-9
VNEA
H-451
Na
11
8.6 5.5 4.6
2.2 4.0 6.4 09 3
.O
10 5.7
2.2
2.5 1.1 1.6
1.3 0.87 1.9
0.2
01
1.1
1.1
A1
98
10
79
9.1
2.5 68
7.8
__
1
.o
14 12
Mg
Si
24
9.9
51 14 4.0
5.9
432 1.6
11
11 23
K
11
11 73
11
____
90
12
1.8 0.8
13
12
Ca
13 19 96 91 8.2 17 11
2.4 2.1 45 1.6
V 65 71 66 55 23 49 33
14 17 5.1 0.84
Fe
16
11
47 50 56 7.6 6.1
2.8 5.6 43 24
0
10
P
0 27
'r1
55 58 37 15 12 25 36 1.5 22 4.3 7.1
Cr
0.10 0.21 0.42
0
49 0.52
_-_-
0.17 13
0.1
17
Ni
0
64 1.8 18 0.82 0.38 0.58 0.32 34 07 4.0 0.42
Zn
0.22 0.14
0
11
0.18
0.21 0.12 0.15 6.7 01 0.79 0.13
Mn
0.23
0.10
0.11
_
0.10
0
10
0.16 66
0.10
____
cu
1.8 0.94
0
95
0.50 0.51 0.78 0.60 6.5 1.1 4.7 1
.o
_-__
"___
0.1
__
0.21 33
-___
_
Table
24.
Some
properties
of
WW
coal-derived calcined cokes and their graphites
graphite WVU
WW-
WVU- WVU- WVU- WVU-
WW-
WW-
WW-
WVU-
WVU- WVU-
WW-
-1 2 3 4 5 6
I
8 9
10
11 12 13
5 07 1.09 0.96
CTE
4.42 2.89 528 1.59 071 4.52 3.77 1.19 3
12
5.28
R
13.16 10.01 13
16
998 11.85 14.71 15
10
10.18 11.56 896 1377 10.10
11
76
density
1.51 1.57 1.57 148 138 1.57 1.50 1.48 159 1.51 161 1.47 1.42
e
CTE
X
10-6/"C,
R
in
pohm-m;
density
in
gicm'
c
232
00
05
10
15
20
25 30
WewM
Percent
Hydrogen Added
to
Coal (daq
Figure
2.
Effects of hydrogenation
on
CTE
of
coal-based graphites
01
0
25
50
75
100
Weight Percent
EXT
m
Blend
wth
HEXT450
Figure
3.
Effects of blend composition on CTE of graphites manufactured from
WVGS
1342
1
derived products
233
These results are significant since they show that the ultimate characteristics
of
the graphite product can be unequivocally controlled by the blendmg of pitches.
Further, the results indicate that a single coal source could be utilized, by
appropriate treatment, to provide a slate of different pitches and cokes.
5
Summary
It has been demonstrated that a solvent-extraction procedure with N-methyl
pyrrolidone is capable of producing coal-derived extract pitches
with
low-ash
contents. Moreover, the properties of the pitches can be varied by partial
hydrogenation of the coal prior to extraction. The yield
of
the pitches along
with the physical and chemical properties
of
the cokes and graphites
vary
m
an
understandable fashion.
By
a
combination
of
pitch blending andor hydrogenation, the properties
of
calcined cokes and their subsequent graphites can be controlled
in
a
predictable
manner.
Thus
by altering processing conditions, graphites ranging
from
very
isotropic to very anisotropic can be produced from a single coal source.
As
acceptable petroleum supplies dwindle, this technology offers an alternate route
for graphite manufacture from the abundant, world-wide reserves
of
coal.
6
Acknowledgments
The authors wish to thank
I.
C.
Lewis
and
the UCAR Carbon Company for their
assistance in the preparation and characterization
of
the coal-derived graphites.
This work was partially funded by a grant from the U.
S.
Department
of
Energy
DE-FG02-9 lNP00 159. This support is gratefully acknowledged.
7 References
1.
2.
Reis, T.,
To
coke, desulfurize, and calcine,
Hydrocarbon Processing,
1975,
54,
145
156.
Yamada,
Y.,
Imamura,
T., Kakiyama, H., Honda, H., Oi,
S.,
and Fukuda,
K.,
Characteristux
of
meso-carbon microbeads separated
from
pitch,
Carbon,
1974,12,307 319.
Edie,
D.
D.,
and Dunham,
M.
G.,
Melt spinnmg pitch-based carbon fibers,
Carbon,
1989,27,647
655
Stansberry,
P.
G., Zondlo,
J.
W.,
Stiller,
A
H., and Khandare,
P
M.,
production
of
coal-derived mesophase pitch. In
Proceedings
c
f
22nd Biennial
Cofiference
OR
Carbon,
American Carbon Society, San Diego, CA,
244 245.
Irwin, C., and Stiller,
A,,
Carbon products and the potential
for
coal-derived
3.
4.
The
1995,
pp.
5.
234
6.
7.
8.
9.
10.
11.
12.
13.
14.
15.
16.
17.
18.
19.
20.
21.
22.
feedstocks. Paper presented at Carbon Materials for Advanced Technologies,
American Carbon Society Workshop, Oak Ridge,
TN,
18
Mantell, C.
L.,
Carbon and Graphite Handbook,
Robert E. Krieger Publishing
Company, Huntington,
NY,
1968.
Eser,
S.,
and Jenkins, R. G., Carbonization
of
petroleum feedstocks
I.
relationships between chemical constitution of the feedstocks and mesophase
development,
Carbon,
1989,27, 877 887.
Lewis,
I.
C., Chemistry of pitch carbonization,
Fuel,
1987,66, 1527 1531.
Derbyshire,
F.
J., Vitrinite structure: alterations with rank and processing,
Fuel,
199 1,
70,
276 284.
Song, C., and Schobert, H.
H.,
Non-fuel uses of coals and synthesis of
chemicals and materials.
In
Preprint
of
Paperspresented at the 209th
American Chemical Society meeting,
Vol40(2), Anaheim,
CA,
1995,
pp. 249 259.
Seehra, M.
S.,
and Pavlovic, A.
S.,
X-ray diffraction, thermal expansion,
electrical conductivity, and optical microscopy studies of coal-derived
graphites,
Carbon,
1993,31,557 564.
Owen,
J.,
Liquefaction of coal. In
Coal and Modern Coal Processing.
An
Introduction,
ed.
G.
J.
Pitt and
G.
R. Millward. Academic Press, New York,
1979, pp. 163 181.
Reneganathan,
K.,
Zondlo,
J.
W.,
Mink, E. A., Kneisl, P., and Stiller,
A.
H.,
Preparation of an ultra-low
Processing Technology,
1988, 18,273 278.
Glenn, R.
A.,
Nonfuel uses
of
coal. In
Chemistry
cf
Coal Utilization,
Supplementary Volume,
ed. H. H. Lowry. John Wiley and Sons, Inc., New
York, 1963, pp. 1081 1099.
Surjit,
S.,
Coke for the steel industry. In
Proceedings
c
f
the Cor; ference
on
Coal-Derived Materials and Chemicals,,
ed.
T.
F.
Torries and C. L.
Irwin.
West Virginia Univesity, Morgantown, WV, 1991, pp. 1 14.
Habermehl,
D.,
Orywal, F., and Beyer, H.
D.,
Plastic properties
of
coal. In
Chemistry
c
f
Coal Utilization, Second Supplementary Volume,
ed. M. A.
Elliot. John Wiley and Sons, Inc., New York, 1981, pp. 317 368
Ragan, S., and Marsh, H., Review science and technology of graphite
manufacture,
Journal
c
f
Materials Science,
1983, 18, 3 16
1
3
176.
King, L.
F.,
and Robertson,
W.
D.,
A
comparison
of
coal tar and petroleum
pitches as electrode binders,
Fuel,
1968,47, 197 212.
Hutcheon,
J.
M.,
Manufacture technology of baked and graphitized carbon
bodies. In
Modern Aspects
c
f
Graphite Technology,
ed. L. C.
F.
Blackman.
Academic Press, New York, 1970, pp. 49
78.
Shah, Y.
T.,
Reaction Engineering in Direct Coal Liquefaction.
Addison-
Wesley publishing Company, London, 198
I.
Given,
P.
H., Cronauer,
D.
C., Spackman, W., Lovell, H. L., Davis,
A,,
and
Biswas, B., Dependence of coal liquefaction behavior on coal characteristics
1. vitrinite-rich samples,
Fuel,
1975, 54, 34 39.
Seehra, M. S., Pavlovic, A. S., Babu, V. S., Zondlo,
J.
W.,
Stiller, A. H., and
Stansberry,
P.
G., Measurement and control of anisotropy in ten coal-based
graphites,
Carbon,
1994, 32,431 435.
May 1994.
ash coal extract under mild conditions,
Fuel
235
CHAPTER
8
Activated Carbon
for
Automotive Applications
PHILIP
J.
JOHNSON
AND DAVID
J.
SETSUDA
Ford
Motor. Company
Automotive Components Division
Dearborn, Michigan
ROGER
S.
WILLIAMS
Westvaco
Chemical Division
Covtngton, Virginia
1
Background
Research datmg back to the mid
1950's
has shown that volatde organic compounds
(VOC's) photochemically react
m
the atmosphere and
contribute
to the formahon
of ground level ozone, a precursor to smog
[l].
Medical studies have shown that
human exposure to ozone can result in eye and smus tract mitation, and can lead
to respiratory related illnesses
[2].
Due
to
the unique and severe
smog
problems
that affected many cities in the state of Califorma, studies of the causes
of
air
pollution were inibakd
m
the
1950's
[3].
Based on
its
fmdmgs,
Califomia formed
the Motor Vehcle Pollution Control Board
m
1960
to regulate pollution fiom
automobiles.
The generaQon of alr pollutants, including
VOC's,
from automotive vehicles
was
identified to come from
two
principal sources: vehicle exhaust emssions, and fuel
system evaporatwe emissions
[4].
Evaporative emssions are defimed as the
automotwe fuel vapors generated and released from the vehicle's fuel system due
to
the interactions of the specific fuel in use, the fuel system characteristics, and
environmental factors. The sources
of
the evaporative emissions are discussed
below and, as presented
rn
the remainder of ths chapter, control
of
these
evaporative
emissions
are the focus of the application of achvated carbon
technology
in
automotwe systems.
1.1
Evaporative emission sources
Pnor to the implementation of any evaporahve emission controls, fuel vapors were
freely vented from the fuel tank to the atmosphere. Diurnal, hot soak, running
losses, resting losses, and refueling ermssions are the typical evaporatwe
contributions from a motor vehicle. Diurnal emissions occur while a vehicle
1s
parked and the fuel tank is heated due to dally temperature changes Hot soak
emissions
are
the losses that occur due to the heat stored
in
the fuel tank and engine
compartment immediately after a fully warmed up vehicle has been shut down.
Running loss emissions are the evaporative ermssions that are generated as a result
of
fuel heating during driving conditions. Resting losses are due to hydrocarbon
migration through materials used in fuel system components. Refueling ermssions
occur due to the fuel vapor that is displaced from the fuel tank as liquid fuel is
pumped
m.
I.
2
Development
of
evaporative emission controls
In 1968 California committed additional resources to fight
its
unique air polluhon
problems with the establishment of the Cahfomia Air Resource Board (CAW).
Although the federal government has junsdichon over the states in the area of
automotive emission control regulation, California
has
been given a waiver to
implement its
own
regulations provided that they are more stringent than the federal
requirements
[5].
California has since been a leader in the development and
nnplementation
of
increasingly stringent automotive ermssion control regulations.
The Environmental Protection Agency (EPA) was established in 1970 by an act
of
Congress, the primary purpose of the agency being to promulgate and implement
environmental regulations that are mandated by law Congress fiist mandated
automotive polluhon control regulations in the Clean Air Act (CAA) Amendments
of 1970. The CAA was amended in 1977 and 1990 to further improve an quality.
The primary purpose of the amendments was to push industry mto developmg and
mplementmg control technologies. The 1990 CAA Amendment also gave other
states the option of adoptmg the California regulations.
Industry has not always worked in full cooperation with government to meet the
technology forcing standards.
In the early 1970's, the
U.S
auto mdustry was
characterized by slow development
of
the required technologies to meet the
regulations. The slow response and seemingly insurmountable technical issues
forced congressional and administrative delays to the original regulatory
implementahon [l]. However, since the late 1970's, the auto industry
has
responded favorably, allocating enormous resources to meet the mcreasmgly
strmgent regulations.
237
The buyers of motor vehicles have been substantially positive concerning the need
to have cleaner running vehicles. Although the required emission control devices
and other mandated safety equipment have increased the cost of new motor
vehicles, sales have not been significantly effected. The current environmental
awareness and concern are evidence of the general population's new found
knowledge and acceptance of both mobile and stationary source emission controls.
I
.3
Evaporative emission
control
measures
The earliest implementation of evaporative emission control occurred in 1963 when
the State of California mandated that crankcase emissions be eliminated.
This
early
regulation was easily met by venting crankcase emissions at a metered rate into the
air induction system. The next areas to be regulated were the hot
soak
and diurnal
losses, which California required starting in the 1970 model year. Prior to 1970,
the uncontrolled hydrocarbon (HC) emission rate was reported to be 46.6
grams
per
vehicle for a one hour hot
soak
plus one hour heat build [6]. Canisters containing
activated carbon were installed on vehicles to collect the hydrocarbons that were
previously freely vented from the vehicles. These vapors are later purged
(desorbed) fi-om the canister by pulling air through the carbon bed and into the air
induction stream.
The early test methodology [6] employed activated carbon traps sealed to possible
HC sources, such as the air cleaner and fuel cap, during the test procedure. The
carbon trap's weight was measured before and after the test procedure to establish
the total emissions. General Motors [7] developed the Sealed Housing for
Evaporative Determination(SHED) as a more precise and repeatable method to
measure evaporative losses. The SHED method proved to be more accurate at
measuring evaporative emissions that had previously escaped through openings
other
than
where the carbon traps were attached. The EPA and CARB subsequently
changed their test procedures from the carbon trap to the SHED method.
The early carbon trap and SHED methods measured
two
components of evaporative
emissions. Hot
soak
emissions were measured for a one hour period immediately
after a vehicle had been driven on a prescribed cycle and the engine turned off.
Diurnal emissions were also measured during a one hour event where the fuel
tank
was artificially heated. The one hour fuel temperature heat build was an accelerated
test that was developed to represent a full day temperature heat build.
The latest CARBEPA procedures require diurnal emissions to be measured during
a real time, three day test that exposes the complete vehicle to daily temperature
fluctuations. This test method has been employed to more accurately reflect the
real world diumal emissions that occur. Running loss emission measurements were
also initiated in the latest test procedures. Evaporative emissions are measured
238
whle the vehicle is dnven on a chassis dynamometer with heat applied
to
the fuel
tank simulating a hot reflective road surface.
Onboard Refueling Vapor Recovery
(ORVR)
regulabons were first proposed
111
1987 but were met with a litany of technical and safety issues that delayed the
requirement. The 1990
CAA
amendments required the mplementabon of ORVR
and the
EPA
regulation requires passenger cars to fist have the systems starting in
1998. The ORVR test wll be performed
in
a
SHED
and will require that not more
than 0.2 grams
of
hydrocarbon vapor per gallon of dispensed fuel be released
from
the vehicle.
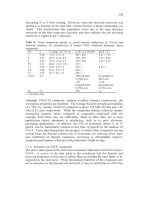
Fig.1 shows the typical events in the
EPA's
evaporative emission control test
sequence. These test procedures cover the entire range
of
evaporative emissions,
includmg the refueling emissions which are now being addressed through the
ORVR system development. Typically, emission regulations are phased in over a
number of years. Manufacturers are required
to
sell a defined percentage
of
their
fleet each year that meet the requirements. Globally, the Umted States has led the
way in terms of technology forcing evaporative emission regulabons.
Fuel
Draia
&
40%
Fill
canisoerpreconditioning
13
Day
Diurnal
Evap.
Test]
2
Day
Diurnal
Evap.
Test
57
Vehicle
Soak
i
Refueling
Test
7
Fig.
1.
U.
S
EPA
federal
test
procedure
239
The following countries also have evaporatwe emssion regulabons; Canada,,
European Economic Community
(EEC),
Japan, Brazil, Mexico, Australla, South
Korea. Regulabons
in
these countries have requirements that are typically less
stnngent than the
U.S.
imperakves. Table
1
depicts the chronology of evaporative
emission regulabon developments in the United States.
Table
1.
Chronology
of
U.
S.
evaporative
emission
development [l]
Model Mandated Test Cerhficabon
Year Sales Area Method
Standard Note
1970 California
Carbon Trap 6
grams
HC One
hour
test
1971 49 States
Carbon Trap
6
grams
HC One hour
test
1972
50
States
Carbon Trap
2
grams
HC
One
hour
test
1978
50
States
SHED
6
grams
HC
One
hour
test
1980 California
SHED
2
grams
HC
One hour
test
1981
50
States
SHED
[8]
2
grams
HC
One
hour
test
1995 California
VT
SHED
[9]
2
grams
HC
Three
day
test
I995 Callfornia
Run
Loss
0.05
g/mile
1996
50
States
VT
SHED
2
grams HC Three day test
1996
50
States
Run
Loss
0.05
g/mtle
200
1
50
States
ORVR
0.2
glgal
Lt
Duty
Trucks
1998
50
States
ORVR
[
101
0
2 g/gal Passenger
cars
2
Activated
Carbon
Activated carbon is
an
amorphous solid with a large internal surface aredpore
structure that adsorbs molecules from both the liquid and gas phase
[
1
11.
It
has
been manufactured
from
a number of raw matenials mcluding wood, coconut shell,
and coal
[
1
1,121.
Specific processes have been developed to produce actwated
carbon in powdered, granular, and specially shaped (pellet) forms. The key to
development
of
activated carbon products has been the selection
of
the
manufacturing process, raw material, and
an
understandmg
of
the basic adsorption
process
to
tailor the product to a specific adsorpbon applicabon.
2
1
Production
methods
Based upon
raw
matenal and intended applicabon, the manufactunng
of
acbvated
carbon falls into
two
mam
categories: thermal acbvabon and chemcal acbvation.
In
general, thermal activabon involves the heatinglgasificabon of carbon at high
temperatures
[13],
while chemical activation is characterrzed by the chemcal
dehydration of the raw material at significantly lower temperatures
[11,14].
2.1,l
Thermal acbvabon processes
Thermal activation is characterrzed by
two
processing stages: thermal
240
decomposition or carbonization of the precursor, and gasification or activation of
the carbonized char material. In the carbonization step, hydrogen and oxygen are
removed from the precursor (raw material) to generate a basic carbon pore
structure. During activation, an oxidizing atmosphere such as steam is used to
increase the pore volume and particle surface area through elimination of volatile
prohcts and carbon burn-off [14]. Thermal activation precursors include coal and
coconut shells. Thermal activation is usually carried out in directly fiied rotary
kilns or multi-hearth furnaces, with temperatures of greater than 1000 "C achieved
in process.
A
thermal activation process for the production of activated carbon
from coal is shown
in
Fig. 2
[
111.
To
Bi
Fig.
2.
Thermal activation process for production
of
activated
carbon.
Reprinted
from
[l
11,
copyright
0
1992
John
Willey
&
Sons,
Inc., with permission.
2.1.2 Chemical activation processes
In chemical activation processes, the precursor is fiist treated with a chemical
activation agent, often phosphoric acid, and then heated to a temperature of 450
-
700
"C in an activation kiln. The char is then washed with water to remove the
acid from the carbon. The filtrate is passed to a chemical recovery unit for
recycling. The carbon is dried, and the product is often screened to obtain a
specific particle
size
range.
A
diagram of a process for the chemical activation of
a wood precursor is shown in Fig.
3.
2.2
Applications/characteristics
of
activated
carbon
The activated carbon materials are produced by either thermal or chemical
activation as granular, powdered, or shaped products. In addition to the form of
the activated carbon, the fiial product can differ in both particle size and pore
structure. The properties of the activated carbon will determine the type of
application for which the carbon will be used.
2.2.1 Liquid phase applications
Liquid phase applications account for nearly 80% of the total use of activated
carbon. Activated carbon used in liquid phase applications typically have a high
fraction of pores in the macropore
(>50nm)
range. This is to permit the liquid
phase molecules to diffuse more rapidly into the rest of the pore structure
[
151.
241
ch-sim
Granuies
10
x
25
Mesh4
as
Example
,
Powdered
Carbon
Off-size
Granules
Fig.
3.
Chemical activation process for production
of
activated carbon
The
principal
liquid
phase applications,
the
type
of
carbon used,
and
1987
consumption levels are presented in Table
2.
Table
2.
Liquid phase activated carbon consumption [11,16]. Reprinted
from
[l
I],
copyright
Q
1992 John Willey
&
Sons, Inc.,
with
permission.
U.S.
1987 consumption, metric
ton
(1000's)
GranularlShaped Powdered Total
Potable water 4.5 13.6
18.1
Wastewater, industrial 6.4 6.6 13.0
Wastewater, municipal
0.9
2.0 2.9
Sweetener decolorization 6.8 9.1 15.9
Chemical processing and misc. 4.1 2.3 6.4
Food, beverage,
and
oils
0.9
3.9 4.8
Pharmaceuticals 2.0 .3 4.3
Mining 1.6 2.5 4.1
Groundwater 0.9 2.3 3.2
Household uses 1.4 0.9
2.3
Electroplating
-
0.2
0.4
-
0.6
Total
30.4 46.3 76.7
Dry
cleaning
0.7
0.4
1.1
2.2.2
Gas phase applications
Gas phase applications of activated carbon fall into the main categories of
separation, gas storage, and catalysis. These applications account for about
20%
of
the
total use
of
activated carbon,
with
the
majority using either granular or pellet
type.
Table
3
shows
the
major
gas
phase
applications,
again
along with
1987
consumption levels.
242
Table 3.
Gas phase activated carbon consumption. Reprinted
from
[
1
11, copyright
0
1992
John
Willey
&
Sons, Inc.,
with
permission.
U.S. 1987
consumption, metric ton
(1000's)
Solvent Recovery 4.5
Automotive/Gasoline Recovery 4.1
Industrial off-gas Control
3.2
Catalysis
2.7
Air
Conditioning
0.5
Gas Mask 0.5
Cigarette Filters 0.5
Nuclear Industry
-
0.3
Total 17.4
Pressure Swing Separation
1.1
2.2.3 Physical properties
Properties for typical activated carbons used in both liquid and gas phase
applications are shown in Table 4.
2.3
Automotive applications
The major automotive application for activated carbon is the capture
of
gasoline
vapors from vehicle fuel vapor systems.
With the creation of emission control
standards
in
the early 1970's, vehicles began to be equipped with evaporative
emission control systems [17,18].
The activated carbons to be used
in
these
emission control systems were required to adsorb gasoline vapors at high efficiency
and to release them during the purge regeneration cycle. The durability
of
the
activated carbon became an important characteristic, as the adsorptiodpurge
regeneration cycle would be repeated many times over the life of a vehicle [12].
The operation of the evaporative emission control system is detailed in Section 3.
Initial evaporative emission control systems utilized coal-base granular carbons,
which were followed by chemically activated, wood-base carbons
[
191.
Increasingly stringent emission control standards [20-221 led to further activated
carbon development, including the production of a pellet shaped product
specifically designed for automotive applications
[
191. The most recent emission
control requirements have addressed capturing vapors emitted during refueling
[23,24], which
will
require a better understanding of the performance of activated
carbon in hydrocarbon adsorption over a larger range of operation.
Properties of activated carbons produced by Westvaco for automotive applications
are presented in Table
5.
Table
4.
Properties
of
selected activated
carbon
products. Reprinted
from
[l
11,
copyright
0
1992
John
Willey
&
Sons, Inc.,
with
permission.
Gas-Phase Carbons
Liquid-Phase
Carbons
Manufacturer Calgon Norit Westvaco Calgon Norit Westvaco
Precursor Coal Peat Wood Coal Peat Wood
Product Grade BPL
B4
WV-A
1100
SGL
SA
3
SA-20
Product
Form
Granular Extruded
Granular
Granular Powdered Powdered
Product Property Typical
Range
Particle Size
(US.
mesh)
<4 12x30
3.8
mm
dia.
1 OX25 8x30 64%
<325
65-85% <325
Apparent Density (g/cm’)
0.2-0.6 >0.48 0.43
0.27
0.52 0.46 0.34-0.37
Particle Density (g/cm’)
0.4-0.9
0.8
0.5
0.8
Hardness or Abrasion Number
50-100 >90 99 >75
Ash
(wt.
%)
1-20
18
6
do
6 3-5
BET
Surface Area
(N2, m2/g)
500-2500 1050-1 150 1100-1200 1750 900-1000 750 1400-1
800
Total
Pore Volume (cm’/g)
0.5-2.5
0.8
0.9
1.2 0.85 2.2-2.5
CC14 Activity (wt.
%)
35-125 >60
Butane Working Capacity
(g/100cm3)
4-14 >11
Iodine Number
500-1200 21050 >900
800
>loo0
Decolorizing Index (Westvaco)
15-25
>20
Molasses Number (Calgon)
50-250
>200
(Norit)
300-1500 440
Heat Capacity
(lOO°C,
cal/g/K)
0.2-0.3 0.25 0.25
Thermal Conductivity (W/m/K)
0.05-0.1
h,
P
w
244
Table
5.
Properties
of
Westvaco automotive grade activated
carbons
[19]
Shape
Granular Pelleted Granular Pelleted Pelleted
Grade
WV-A
900
BAX
950
WV-A
1100
BAX
1100
BAX
1500
Mesh Size
10x25
2mm
10x25 2mm 2mm
BET
Surface Area
(m*/g)
1400-1600 1300-1500 1600-1900 1400-1600 1800-2000
Butane Working
9.0min 9.5min
11.Omin
11.0min 15.0min
Capacity (g/lOOml)
Apparent Density (g/cm3)
0.2-0.32
0.3-0.4 0.2-0.32 0.3-0.4 0.27-0.35
Moisture, as Packed
(%)
10
max
5
max 10 max
5
max
5
max
Particle Size (U.S.Sieve Series)
Oversize
(“h)
8max
2max
8
max
2max 2
max
Undersize
(“h)
Smax
Smax
5
rnax
5max 5
max
3
Vehicle Fuel Vapor
System
A
current vehicle fuel system designed for evaporative emission control should
address enhanced
SHED,
running loss, and
ORVR
emission level requirements (see
Table
1).
A
typical vehicle fuel system
is
shown in Fig.
4.
The primary fimctions
of the system are to store the liquid and vapor phases of the fuel with acceptable
loss levels, and to
pump
liquid fuel to the engine for vehicle operation. The
operation of the various components in the fuel system, and how they work
to
minimize evaporative losses during both driving and refueling events, is described
below.
3.
I
Fuel
system operation during driving events
The liquid fuel handling components
of
the fuel system include the fuel filler pipe,
fuel tank, fuel pump, and the fuel supply and return lines. The fuel tank is a low
pressure, low hydrocarbon emission vessel designed to contain both the liquid and
vapor phases of the fuel.
An
electric pump located inside the fuel tank is used to
transfer liquid fuel from the
tank
to the engine. The fuel in the tank is suctioned
from a small reservoir in the tank which minimizes liquid level transients caused
by vehicle
motion.
The fuel is delivered to the engine by one of
two
methods: recirculating or return-
less.
In
a recirculation system, as is shown with dashed lines in Fig.
4,
the engine
fuel injectors
draw
a portion of the fuel being delivered in the fuel rail, and the