Báo cáo y học: " Alveolar recruitment can be predicted from airway pressure-lung volume loops: an experimental study in a porcine acute lung injury model" ppt
Bạn đang xem bản rút gọn của tài liệu. Xem và tải ngay bản đầy đủ của tài liệu tại đây (461.36 KB, 9 trang )
Open Access
Available online />Page 1 of 9
(page number not for citation purposes)
Vol 12 No 1
Research
Alveolar recruitment can be predicted from airway pressure-lung
volume loops: an experimental study in a porcine acute lung injury
model
Jacob Koefoed-Nielsen
1
, Niels Dahlsgaard Nielsen
1
, Anders J Kjærgaard
2
and Anders Larsson
1
1
Department of Anesthesia and Intensive Care, Aarhus University Hospital, Aalborg, Hobrovej 18-22, DK-9000 Aalborg, Denmark
2
Department of Anesthesia and Intensive Care, Aarhus University Hospital, Århus, Norrebrogade 44, DK-8000 Århus, Denmark
Corresponding author: Jacob Koefoed-Nielsen,
Received: 30 Sep 2007 Revisions requested: 17 Nov 2007 Revisions received: 29 Nov 2007 Accepted: 21 Jan 2008 Published: 21 Jan 2008
Critical Care 2008, 12:R7 (doi:10.1186/cc6771)
This article is online at: />© 2008 Koefoed-Nielsen et al.; licensee BioMed Central Ltd.
This is an open access article distributed under the terms of the Creative Commons Attribution License ( />),
which permits unrestricted use, distribution, and reproduction in any medium, provided the original work is properly cited.
Abstract
Introduction Simple methods to predict the effect of lung
recruitment maneuvers (LRMs) in acute lung injury (ALI) and
acute respiratory distress syndrome (ARDS) are lacking. It has
previously been found that a static pressure–volume (PV) loop
could indicate the increase in lung volume induced by positive
end-expiratory pressure (PEEP) in ARDS. The purpose of this
study was to test the hypothesis that in ALI (1) the difference in
lung volume (ΔV) at a specific airway pressure (10 cmH
2
O was
chosen in this test) obtained from the limbs of a PV loop agree
with the increase in end-expiratory lung volume (ΔEELV) by an
LRM at a specific PEEP (10 cmH
2
O), and (2) the maximal
relative vertical (volume) difference between the limbs (maximal
hysteresis/total lung capacity (MH/TLC)) could predict the
changes in respiratory compliance (Crs), EELV and partial
pressures of arterial O
2
and CO
2
(PaO
2
and PaCO
2
,
respectively) by an LRM.
Methods In eight ventilated pigs PV loops were obtained (1)
before lung injury, (2) after lung injury induced by lung lavage,
and (3) after additional injurious ventilation. ΔV and MH/TLC
were determined from the PV loops. At all stages Crs, EELV,
PaCO
2
and PaO
2
were registered at 0 cmH
2
O and at 10
cmH
2
O before and after LRM, and ΔEELV was calculated.
Statistics: Wilcoxon's signed rank, Pearson's product moment
correlation, Bland–Altman plot, and receiver operating
characteristics curve. Medians and 25th and 75th centiles are
reported.
Results ΔV was 270 (220, 320) ml and ΔEELV was 227 (177,
306) ml (P < 0.047). The bias was 39 ml and the limits of
agreement were – 49 ml to +127 ml. The R
2
for relative changes
in EELV, Crs, PaCO
2
and PaO
2
against MH/TLC were 0.55,
0.57, 0.36 and 0.05, respectively. The sensitivity and specificity
for MH/TLC of 0.3 to predict improvement (>75th centile of
what was found in uninjured lungs) were for EELV 1.0 and 0.85,
Crs 0.88 and 1.0, PaCO
2
0.78 and 0.60, and PaO
2
1.0 and
0.69.
Conclusion A PV-loop-derived parameter, MH/TLC of 0.3,
predicted changes in lung mechanics better than changes in
gas exchange in this lung injury model.
Introduction
Lung collapse is an important cause of deteriorated oxygena-
tion and gas exchange after major surgery, in acute lung injury
(ALI) and in acute respiratory distress syndrome (ARDS) [1,2].
Although the logical therapy for lung collapse, namely a lung
recruitment maneuver (LRM) in combination with high positive
ALI = acute lung injury; ARDS = acute respiratory distress syndrome; Crs = compliance of the respiratory system; ΔEELV = increase in end-expiratory
lung volume at 10 cmH
2
O positive end-expiratory pressure associated with a lung recruitment maneuver; ΔV = difference in lung volume at 10 cmH
2
O
airway pressure between the expiratory and inspiratory limbs of a static airway pressure – lung volume loop; EELV = end-expiratory lung volume; EELV-
10
LRM
= end-expiratory lung volume at 10 cmH
2
O positive end-expiratory pressure after a lung recruitment maneuver; EELV-10
noLRM
= end-expiratory
lung volume at 10 cmH
2
O positive end-expiratory pressure before a lung recruitment maneuver; EELV
ZEEP
= end-expiratory lung volume at zero end-
expiratory pressure; ELV-10 = the absolute lung volumes at an airway pressure of 10 cmH
2
O obtained from the expiratory limb of a static airway
pressure – lung volume loop; ILV-10 = the absolute lung volumes at an airway pressure of 10 cmH
2
O obtained from the inspiratory limb of an airway
pressure – lung volume loop; i.m. = intramuscularly; i.v. = intravenously; MH = maximal volume hysteresis obtained from an airway pressure – lung
volume loop; LRM = lung recruitment maneuver; PaCO
2
= partial pressure of arterial CO
2
; PaO
2
= partial pressure of arterial oxygen; PEEP = positive
end-expiratory pressure; PV loop = static airway pressure – lung volume loop; TLC = total lung capacity; ZEEP = zero end-expiratory pressure.
Critical Care Vol 12 No 1 Koefoed-Nielsen et al.
Page 2 of 9
(page number not for citation purposes)
end-expiratory pressure (PEEP), improves oxygenation in
these conditions, it has not conclusively been found to improve
important outcome measures, for example length of stay in the
hospital or mortality [3-6].The reasons for the latter might be
that in the studies the positive effects of LRM in patients with
recruitable lung collapse are evened out by the negative
effects such as circulatory compromise and barotrauma/
volutrauma in non-recruiters. This indicates that LRM prefera-
bly should be performed only in patients with lung collapse
that it is possible to recruit [7,8]. Although examination of the
lungs by computed tomography could assess the effect of
LRMs, it is complicated and the patient will be exposed to radi-
ation and needs to be moved to the computed tomography
suite [9,10]. Therefore an easy method for predicting the
effect of LRMs would be useful.
Superimposed plots of inspiratory airway pressure against
lung volume (pressure–volume; PV) obtained from different
PEEP levels were originally described by Ranieri and cowork-
ers, and have been further developed by others, for assessing
PEEP-induced lung recruitment [11,12]. However, this
method does not predict whether an LRM would be success-
ful, but instead shows the volume effect of derecruitment
caused by removal or reduction of PEEP [13]. Vieillard-Baron
and coworkers proposed a slow inflation–deflation (upper air-
way pressure of 20 cmH
2
O) PV loop method for predicting the
volume effect by PEEP-induced lung recruitment [14]. They
found in ARDS that the increase in lung volume, from zero end-
expiratory pressure (ZEEP) to the airway pressure equal to the
subsequent PEEP, assessed from the difference between the
expiratory and inspiratory limbs of the loop, agreed well with
decrease in volume found at removal of PEEP. In addition, they
found in patients with lower inflexion points at high pressures
that PEEP recruited more lung volume than it did in patients
without any obvious lower inflexion points. We hypothesized
that a modification of this method, by measuring end-expiratory
lung volume (EELV), using higher airway pressures (which is
commonly used in LRM) and measuring the volume difference
between the limbs of the PV loop (hysteresis), might predict
the effects of a subsequent LRM (evaluated by changes in
EELV, oxygenation, compliance of the respiratory system (Crs)
and CO
2
elimination).
In ALI/ARDS, the inspiratory limb reflects mainly lung recruit-
ment and the expiratory limb reflects derecruitment [15,16]. At
a specific pressure, the volume hysteresis reflects the volume
recruited (and the expansion of the recruited volume) by the
PV-loop maneuver. Thus, a substantial hysteresis would pre-
dict that an LRM would be effective, whereas a minor hystere-
sis would indicate that an LRM would not be beneficial.
The aim of the present study was to test this hypothesis in a
porcine model with normal lungs, lungs subjected to lavage
and finally lungs subjected to lavage and injurious ventilation
(1) by registering PV loops and volume hysteresis under the
three conditions and then compare hysteresis (assumed pre-
dicted recruited lung volume) at 10 cmH
2
O airway pressure
with the measured difference in EELV at 10 cmH
2
O PEEP
before and after an LRM (the recruited volume plus expansion
of recruited lung units), (2) to relate the maximal volume hys-
teresis (MH) on the PV curve standardized to total lung capac-
ity (TLC) to changes in EELV, Crs and blood gases caused by
an LRM (Figure 1), and (3) to calculate the sensitivity and spe-
cificity of using the MH/TLC ratio for predicting the effect of an
LRM.
We found that the volume hysteresis at 10 cmH
2
O agreed
with the increase in EELV, that MH/TLC was related to
changes in EELV, Crs and PaCO
2
, and that a MH/TLC ratio of
0.3 predicted with high sensitivity and specificity whether an
LRM would improve EELV, Crs, partial pressure of arterial
CO
2
(PaCO
2
) and partial pressure of arterial oxygen (PaO
2
).
Materials and methods
This animal interventional study was performed at the labora-
tory of the Clinical Institute, Aarhus University Hospital. The
study was approved by the Danish National Animal Ethics
Committee.
Anesthesia, ventilation and fluid management
Eight pigs, weighing 18 to 22 kg, were premedicated with
midazolam 10 mg intramuscularly (i.m.), azaperone 80 mg i.m.,
and atropine 1 mg i.m. Anesthesia was induced with ketamine
2 mg/kg intravenously (i.v.) and fentanyl 5 μg/kg i.v. and main-
tained with ketamine 10 mg/kg per hour, fentanyl 5 μg/kg per
hour, propofol 2 mg/kg per hour, and pancuronium 0.25 mg/
kg per hour. The trachea was intubated (Portex tube, internal
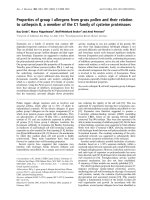
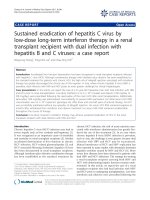
Figure 1
An airway pressure – absolute lung volume loop from an animal after lung lavageAn airway pressure – absolute lung volume loop from an animal after
lung lavage. EELV
ZEEP
, end-expiratory lung volume at zero end-expira-
tory airway pressure; ILV-10 and ELV-10, absolute lung volumes at an
airway pressure of 10 cmH
2
O obtained from the inspiratory limb and
from the expiratory limb, respectively; TLC, total lung capacity; MH,
maximal volume hysteresis.
Available online />Page 3 of 9
(page number not for citation purposes)
diameter 5.5 mm; Smiths Medical, London, UK), and the lungs
were volume-controlled ventilated with a Servo 900C (Sie-
mens-Elema, Solna, Sweden) with tidal volume 8 ml/kg, inspir-
atory/expiratory ratio 1:1, initial respiratory rate 12 breaths/min
(adjusted before the main experiment to 20 to 30 breaths/min
to achieve an arterial pH of about 7.4), and fraction of inspired
oxygen 1.0. PEEP was initially set at 5 cmH
2
O. The dead
space of the apparatus was 14 ml. Ringer acetate (20 ml/kg)
was infused during the first hour and 10 ml/kg per hour for the
rest of the experiment. Before the main experiment was initi-
ated, 20 to 30 ml/kg Voluven (Fresenius Kabi, Uppsala, Swe-
den) was administered. Body temperature was maintained at
37 to 38°C.
At the end of the experiment the animals were killed with an
intravenous overdose of pentobarbital.
Instrumentation and measurement of arterial blood
pressure and blood gases
A catheter was placed in the right common carotid artery for
continuous monitoring of mean arterial blood pressure and for
sampling of blood for analysis of PaO
2
, PaCO
2
and pH (ABL
710; Radiometer, Copenhagen, Denmark). A central venous
catheter was placed in the right internal jugular vein. A bladder
catheter was inserted suprapubically to monitor urine flow.
Measurements of lung volume and mechanics of the
respiratory system
EELV was measured with an inert tracer gas washout tech-
nique by using sulfur hexafluoride [17,18].
Crs was calculated as Tidal volume/(End-inspiratory pressure
– End-expiratory pressure). End-inspiratory and end-expiratory
pressures were obtained after closure of the inspiratory and
expiratory valves of the ventilator (pressing the hold-button of
the ventilator) for 3 to 5 seconds.
PV loops from 0 to 40 cmH
2
O and back to 0 cmH
2
O were
obtained by a slow inflation–deflation, interrupted technique,
as reported previously [19]. In short, the lungs were slowly (60
ml/s) inflated via an interrupter from 0 to 40 cmH
2
O airway
pressure. The pressure was kept constant at 40 cmH
2
O for 1
s, and then the lungs were passively deflated to 0 cmH
2
O via
the interrupter, against a resistance. The interrupter worked in
cycles of 320 ms with 160 ms opening and 160 ms occlusion.
Airway pressure was measured (SCX01DN; Sensym, Rugby,
UK) proximal to the interrupter and close to the endotracheal
tube, between 80 and 150 ms after the start of each occlusion
(that is, at zero flow and a stable pressure level), and the incre-
ment or decrement in volume was obtained by integration of
the flow from mid-occlusion to mid-occlusion measured by a
pneumotachograph (Gould 1; Fleish, Lausanne, Switzerland)
placed distal to the interrupter. The pressure and volume sig-
nals were obtained at 200 Hz and were transmitted to a per-
sonal computer, which constructed the PV loops. The duration
of the procedure was less than 1 minute. The PV loop was
adjusted to absolute lung volume by adding the EELV at ZEEP
(EELV
ZEEP
) to the registered volumes. From this loop the abso-
lute lung volumes at an airway pressure of 10 cmH
2
O were
obtained from the inspiratory limb (ILV-10) and from the expir-
atory limb (ELV-10) (Figure 1). MH was defined as the maximal
difference in volume between the two limbs of the PV loop
(Figure 1) [19]. TLC was defined as the lung volume at 40
cmH
2
O airway pressure (Figure 1). The figure of 40 cmH
2
O
was chosen because it is usually a safe airway pressure and in
animals with normal chest wall elastance, as in this experiment,
it should generate an adequate transpulmonary pressure for
obtaining accurate TLC also after lung injury.
Induction of lung injury
Each animal was subjected to two kinds of lung injury: first,
lung collapse produced by surfactant depletion by lung lavage,
and second, mechanical lung injury by additional injurious ven-
tilation of the surfactant-depleted lung. Lung lavage was per-
formed at least 10 times with 20 ml/kg of normal saline at
37°C poured into the tracheal tube and removed by gravity or
until no foam was observed in the removed fluid. The mechan-
ical lung injury was achieved by ventilating the lungs for 30
minutes with peak airway pressures of 45 mmH
2
O, ZEEP, and
a respiratory rate of 15/min. The instrumental dead space was
increased during this procedure to avoid hypocapnia. After the
procedure, the preceding ventilator settings were used.
Experimental protocol and calculations
The pigs were placed in the supine position during the exper-
iment. A PV loop was registered at the following times: (1) at
baseline before induction of lung injury, (2) 30 minutes after
lung lavage, and (3) 10 minutes after the end of the injurious
ventilation. At each stage, EELV was measured at ZEEP
(EELV
ZEEP
) and at 10 cmH
2
O PEEP before an LRM (EELV-
10
noLRM
) and after an LRM (EELV-10
LRM
). At similar times Crs,
PaCO
2
and PaO
2
were obtained. A prolonged end-expiratory
hold was done before each measurement to insure that no
intrinsic PEEP occurred. EELV
ZEEP
was measured after 5 min-
utes of ventilation at ZEEP. To ensure that the lungs were not
inadvertently recruited before the measurement of EELV-
10
noLRM
, the lungs were ventilated at ZEEP for 2 minutes
before PEEP was set to 10 cmH
2
O, and the measurements
were then made after 5 minutes. To prevent tidal lung recruit-
ment, low inspiratory airway pressures (less than 22 cmH
2
O)
were used. The LRM consisted of 2 minutes of pressure-con-
trolled ventilation with a peak airway pressure of 40 cmH
2
O,
PEEP 10 cmH
2
O, an inspiratory/expiratory ratio of 1:1 and a
respiratory rate of 6 breaths/min. EELV-10
LRM
was measured
5 minutes after the LRM.
EELV
ZEEP
was used to adjust the PV loop to absolute lung vol-
umes. The difference between EELV-10
LRM
and EELV-10
noLRM
(ΔEELV), which indicates the lung volume recruited plus the
expansion of the recruited lung units at 10 cmH
2
O of PEEP,
Critical Care Vol 12 No 1 Koefoed-Nielsen et al.
Page 4 of 9
(page number not for citation purposes)
was compared with ΔV, defined as the difference between
ELV-10 (the absolute lung volumes at an airway pressure of 10
cmH
2
O obtained from the expiratory limb of a static airway
pressure – lung volume loop) and ILV-10 (the absolute lung
volumes at an airway pressure of 10 cmH
2
O obtained from the
inspiratory limb of an airway pressure – lung volume loop). Fur-
thermore, MH found on the PV curve was standardized to TLC
(MH/TLC) and related to the relative differences in EELV, Crs,
PaCO
2
and PaO
2
between ventilation after and before LRM at
a 10 cmH
2
O PEEP.
For the estimation of sensitivity and specificity of MH/TLC to
predict the effect of a subsequent LRM, we considered an
'improvement' outside the interquartile centiles found before
lung lavage as relevant.
Statistics
All values are reported as medians and 25th and 75th centiles
unless otherwise indicated.
Comparisons between and within the three lung conditions
were analyzed with the Wilcoxon signed rank test. Data are not
corrected for multiple comparisons. Each value was used for
one or two comparisons. Regression analysis was performed
by Pearson's product moment correlation. A Bland–Altman
plot was used to analyze the agreement between ΔEELV and
ΔV [20]. Analyses of receiver operating characteristics curves
were used to determine the sensitivity and specificity of MH/
TLC in predicting improvements in EELV, Crs, PaO
2
and
PaCO
2
of an LRM. We considered P < 0.05 to be statically
significant. The STATA software (StataCorp, College Station,
TX, USA) was used for statistical analyses.
Results
Effect of lung lavage and injurious ventilation
In comparison with baseline, EELV, Crs, PaO
2
were
decreased and PaCO
2
was increased after lung lavage as well
as after lung lavage and injurious ventilation (Table 1). These
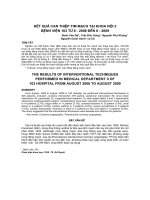
changes were mirrored in marked changes in the shapes of
the PV loops from crescent to convex forms, increased hyster-
esis and rightward shifts of the lower inflexion points (Figure
2).
Effect of lung recruitment maneuver
EELV, Crs and PaO
2
were increased at all lung conditions by
the LRM (Table 1). However, PaCO
2
decreased by the LRM
only after lung lavage and after lung lavage and injurious
ventilation.
Comparisons between measured lung volumes before
and after the lung recruitment maneuver and lung
volumes obtained from the pressure–volume loops
Figure 2 shows that the measured lung volumes agreed well
with the volumes found on the PV loops (EELV-10
noLRM
and
ILV-10 were 464 ml (396, 615) and 417 ml (350, 665),
respectively (P = 0.37), and EELV-10
LRM
and ELV-10 were
764 (665, 807) ml and 745 (640, 940) ml, respectively (P =
0.25). However, the volume gain predicted from the PV loops
gave a systematic, minor overestimation as indicated by a ΔV
of 270 (220, 320) ml compared with a ΔEELV of 227 (177,
306) ml (P < 0.047), and a bias (using ΔV and ΔEELV) of 39
ml. The limits of agreement were – 49 ml to +127 ml.
MH/TLC versus relative changes in EELV, Crs, PaCO
2
and
PaO
2
caused by the lung recruitment maneuver
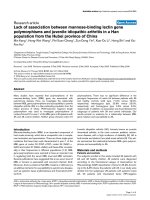
The correlations (R
2
) between MH/TLC (x) and EELV, Crs and
PaCO
2
(y) were 0.55, 0.57 and 0.36, respectively (P < 0.05)
(Figure 3). There was no correlation between MH/TLC and
PaO
2
(R
2
= 0.05, P < 0.26).
Sensitivity and specificity of using MH/TLC to predict
effect of lung recruitment maneuver
The upper (75th) centiles for the relative change by an LRM at
baseline, namely before lung lavage, were 40%, 40% and
30% for EELV, Crs and PaO
2
, respectively, and the lower
(25th) centile for PaCO
2
was – 20%. These values were used
Table 1
Lung mechanics and blood gas tensions obtained at 10 cmH
2
O before and after LRM
Parameter Before lung lavage After lung lavage After lung lavage and additional
injurious ventilation
Before LRM After LRM Before LRM After LRM Before LRM After LRM
EELV, l 0.68 (0.61, 0.71) 0.83
a
(0.77, 0.86) 0.37
b
(0.31, 0.46) 0.69
a
(0.62, 0.78) 0.42
b
(0.40, 0.46) 0.73
a
(0.65, 0.78)
Crs, ml/cmH
2
O 9.5 (9.3, 10.1) 11.5
a
(11.0, 12.0) 5.8
b
(5.2, 6.6) 10.2
a
(9.8, 11.0) 6.6
b
(5.8, 7.0) 10.5
a
(10.1, 10.8)
PaO
2
, kPa 71.2 (66.6, 80.0) 80.1
a
(68.4, 82.3) 51.0
b
(41.4, 56.4) 69.9
a
(66.5, 77.7) 32.4
b
(16.1, 45.6) 71.9
a
(66.4, 76.2)
PaCO
2
, kPa 4.5 (4.3, 4.6) 4.4 (3.8, 5.0) 7.8
b
(7.2, 9.7) 5.9
a
(5.3, 7.2) 6.8
b
(6.3, 7.4) 5.5
a
(4.8, 6.3)
LRM, lung recruitment maneuver; PEEP, positive end-expiratory pressure; EELV, end-expiratory lung volume; Crs, compliance of the respiratory
system; PaCO
2
, partial pressure of arterial CO
2
; PaO
2
, partial pressure of arterial oxygen.
The three lung conditions: before lung lavage, after lung lavage and after lung lavage and additional injurious mechanical ventilation
Results are presented as medians and 25th and 75th centiles.
a
P < 0.05, before LRM compared with after LRM in the three lung conditions;
b
P < 0.05, before lung lavage compared with after lung lavage or
after lung lavage and additional injurious ventilation before the LRM.
Available online />Page 5 of 9
(page number not for citation purposes)
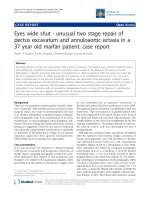
in the construction of receiver operating characteristics curves
for the individual measures (Figure 4). The upper angle, indi-
cating the optimal sensitivity in relation to specificity, was
found for all measures at a MH/TLC ratio of 0.3, which was
used in the calculations of sensitivity and specificity. A MH/
TLC ratio of more than 0.3 indicates, with a sensitivity of 1.0
and a specificity of 0.85, an improvement in EELV by an LRM.
Corresponding values for Crs were 0.88 and 1.0, for PaCO
2
0.78 and 0.60, and for PaO
2
1.0 and 0.69.
Discussion
The main finding in this study is that specific information from
a PV loop could predict the potential for lung recruitment in a
porcine model of acute lung injury.
The PV loop and lung volume measurement methods have
been evaluated previously and are found to be reliable [17-
19]. The short time of the PV loop procedure makes it improb-
able that gas exchange had a major impact of the shape of the
PV loop. To obtain different lung conditions to test our hypoth-
esis we used three models: normal lung, lung collapse, and
mechanical lung injury. We used a maximal pressure of 40
cmH
2
O for the PV loops in all lung conditions to permit easy
comparison of the different loops. Furthermore, 40 cmH
2
O is
commonly considered safe and it would create a transpulmo-
nary pressure high enough for obtaining an accurate TLC
under the lung conditions studied. The PV loops and EELV
obtained agree with previous findings: the normal lung has a
crescent PV loop and the collapsed and the mechanical
injured lung have a convex PV loop with reduced EELV
[21,22]. In the present study, the more pronounced the con-
vexity, as indicated by a larger MH/TLC ratio, the higher was
the probability for improvements in EELV, Crs and PaCO
2
by
an LRM. This agrees well with theoretical considerations by
Hickling and by Jonson and Svantesson [15,16].
Unexpectedly, although the shape of the PV loop was different
from that in the injured lungs, in the normal lungs the hysteresis
was substantial, with a MH/TLC ratio up to 0.3. Because the
hysteresis of the PV loop at 10 cmH
2
O was equal to the
increase in EELV by the LRM at similar airway pressure it could
be debated whether the hysteresis found in the normal lungs
was a sign of lung recruitment produced by the PV loop
maneuver and thus predicted the recruitment of collapsed
lung tissue. We do not believe this is the main explanation,
because only minor changes were found in Crs, PaO
2
and
PaCO
2
by the LRM. In fact, PaCO
2
increased in four of the ani-
Figure 2
Static pressure–volume (PV) loops obtained in the eight animals under three lung conditionsStatic pressure–volume (PV) loops obtained in the eight animals under three lung conditions. The three conditions used were: before lung lavage,
after lung lavage, and after lung lavage and additional injurious ventilation (injur vent). Each PV loop was obtained from 0 to 40 cmH
2
O and back to
0 cmH
2
O airway pressure by a slow inflation–deflation, interrupted technique. End-expiratory lung volume at 10 cmH
2
O of positive end-expiratory
pressure before a lung recruitment maneuver (LRM) (EELV-10
noLRM
)(filled circles) and after an LRM (EELV-10
LRM
) (open circles) agreed well with
the volumes found on the inspiratory and expiratory limbs, respectively, of the PV loops.
Critical Care Vol 12 No 1 Koefoed-Nielsen et al.
Page 6 of 9
(page number not for citation purposes)
mals. Instead, we suggest that the probable cause was that
the pressure used in the PV loop maneuver and in the LRM
squeezed blood out from the lungs that was replaced by an
increased amount of air in previously open lung units [23].
We used 10 cmH
2
O PEEP for two reasons: first, it is a clini-
cally relevant PEEP level in ALI/ARDS, and second, if higher
PEEP levels had been used, the inspiratory pressures would
presumably have been high enough to allow tidal lung recruit-
ment. Theoretically, tidal recruitment could inadvertently have
increased EELV before LRM, because tidal recruitment might
not always be followed by tidal derecruitment. This is because
the PEEP used might prevent derecruitment and because the
time constant for derecruitment in the lavage model is sub-
stantial [24]. In our study the inspiratory pressures were less
than 22 cmH
2
O, which is well below the airway pressure
needed to recruit collapsed lung parenchyma [3]. Our finding
that EELV at 10 cmH
2
O before LRM was similar to the lung
volume registered from the inspiratory PV loop at the same air-
way pressure indicates that tidal recruitment was minimal.
After the LRM, EELV as measured at 10 cmH
2
O PEEP
increased in all animals to similar lung volumes, as registered
from the expiratory limb of the PV loop. Thus, in agreement
with the findings by Vieillard-Baron and coworkers, the PV
Figure 3
Relation between MH/TLC and lung mechanics or blood gas tensionsRelation between MH/TLC and lung mechanics or blood gas tensions. (a) Relation between the ratio between maximal volume hysteresis and total
lung capacity (MH/TLC) and the relative changes at 10 cmH
2
O of positive end-expiratory pressure (PEEP) in EELV, (b) respiratory compliance, (c)
partial pressure of arterial CO
2
(PaCO
2
), and (d) partial pressure of arterial oxygen (PaO
2
) by a lung recruitment maneuver (LRM) in the three lung
models. The regression lines are shown. The symbols depict the individual animals: filled circles, before lung lavage; open circles, after lung lavage;
filled triangles, after lung lavage and additional injurious ventilation. ΔEELV/EELV 10PEEP
noLRM
, the ratio between the change in end-expiratory lung
volume associated with LRM and the end-expiratory lung volume at 10 cmH
2
O PEEP before LRM; ΔCrs/Crs 10PEEP
noLRM
, the ratio between the
change in compliance of the respiratory system associated with LRM and the compliance of the respiratory system at 10 cmH
2
O PEEP before an
LRM; ΔPaCO
2
/PaCO
2
10PEEP
noLRM
, the ratio between the change in PaCO
2
associated with LRM and PaCO
2
at 10 cmH2O PEEP before an LRM;
ΔPaO
2
/PaO
2
10PEEP
noLRM
, the ratio between the change in PaO
2
associated with LRM and PaO
2
at 10 cmH
2
O PEEP before an LRM.
Available online />Page 7 of 9
(page number not for citation purposes)
loop seems to predict the volume gain that could be achieved
by an LRM [14]. However, because recruitment is dependent
on time and pressure, the PV loop might not always predict the
full volume effect of an LRM.
Clinically, improvement in oxygenation is often used for evalu-
ating the effect of LRM, and it has been suggested to indicate
whether recruitment of collapsed regions has occurred [10].
However, oxygenation could be improved and shunt could be
decreased by a reduction in cardiac output induced by the
high intrathoracic pressure during the LRM and by high PEEP
[25]. It should be noted that improvements in lung mechanics
or in EELV by an LRM do not necessarily indicate improve-
ments in oxygenation, intrapulmonary shunt or CO
2
elimination
[26]. In our study, although MH/TLC was related to changes
in Crs and EELV we could not find any relation to changes in
PaO
2
, and the sensitivity and specificity were lower for PaO
2
and PaCO
2
than for Crs and EELV. However, a low MH/TLC
ratio suggested that LRM would not markedly improve oxygen-
ation, PaCO
2
, lung mechanics or EELV.
We are not aware that any simple methods have previously
been reported to predict whether LRM would be effective in
ALI/ARDS. The other simple clinical methods using a combi-
nation of changes in Crs, PaO
2
and PCO
2
, or in EELV, do only
evaluate a posteriori whether an LRM combined with high
PEEP has been effective [13].
We believe that this method, using measurement of EELV
combined with a PV loop, might be found valuable clinically.
Registration of PV loops obtained by slowly increasing and
decreasing airway pressures as well as EELV measurement
Figure 4
Analysis of the receiver operating characteristics curveAnalysis of the receiver operating characteristics curve. Analysis of the receiver operating characteristic curve (100 – sensitivity versus specificity)
for the ratio between maximal volume hysteresis and total lung capacity (MH/TLC) using 40% increase in end-expiratory lung volume (EELV), 40%
increase in compliance of the respiratory system (Crs), 20% decrease in partial pressure of arterial CO
2
(PaCO
2
) and 30% increase in partial pres-
sure of arterial oxygen (PaO
2
). See the text for explanation.
Critical Care Vol 12 No 1 Koefoed-Nielsen et al.
Page 8 of 9
(page number not for citation purposes)
methods have been incorporated in modern ventilators. Thus,
in patients with low Crs and low PaO
2
/FiO
2
ratios, EELV
measurements could determine whether lung volume is
reduced. Then an analysis of the shape of a PV loop could be
used to predict whether an LRM and increased PEEP would
be effective. Although this concept needs to be tested in
patients, both the method described by Vieillard-Baron and
coworkers and the method using superimposed inspiratory PV
curves from different PEEP levels are conceptually similar to
the method used in this study and have been found to give reli-
able results in patients with ARDS [11,12,14,27].
Our study has several limitations. First, it is an experiment in
young previously healthy animals. Second, the lung collapse
and lung injury are induced by surfactant deficiency and
mechanical stress and not, as in ALI/ARDS, by local or sys-
temic inflammation. Thus, the models used do not capture all
aspects of the human disease. Third, we did not use an imag-
ing method such as computed tomography to assess lung
recruitment. Fourth, the statistics used could be criticized
because the changes in EELV or lung mechanics caused by
the collapse and mechanical lung injury are not independent.
However, previous studies with similar models have been
consistent, and therefore a priori we decided to use a limited
number of animals.
Conclusion
In this porcine model, specific information from a PV loop,
namely a MH/TLC of 0.3, predicted better whether an LRM
would improve EELV and Crs – that is, lung mechanics – than
PaCO
2
and PaO
2
– that is, gas exchange – in the range of the
studied PEEP and PV loop.
Competing interests
The authors declare that they have no competing interests.
Authors' contributions
JKN participated in the design, performed the study and
drafted the manuscript. NDN and AJK participated in the
acquisition of the data for the study. AL participated in the
design of the study, participated in the acquisition of data and
helped to draft the manuscript. All authors read and approved
the final manuscript.
Acknowledgements
The study was supported by the Danish Medical Research Council
(grant no. 22-04-0420).
References
1. Brismar B, Hedenstierna G, Lundquist H, Strandberg A, Svensson
L, Tokics L: Pulmonary densities during anesthesia with mus-
cular relaxation – a proposal of atelectasis. Anesthesiology
1985, 62:422-428.
2. Bernard GR, Artigas A, Brigham KL, Carlet J, Falke K, Hudson L,
Lamy M, Legall JR, Morris A, Spragg R, the Consensus Committee:
The American–European consensus conference on ARDS:
definitions, mechanisms, relevant outcomes, and clinical trial
coordination. Am J Respir Crit Care Med 1994, 149:818-824.
3. Rothen HU, Sporre B, Engberg G, Wegenius G, Hedenstierna G:
Reexpansion of atelectasis during general anaesthesia: a
computed tomography study. Br J Anaesth 1993, 71:788-795.
4. Amato MB, Barbas CSV, Medeiros DM, Magaldi RB, Schettino
GP, Lorenzi-Filho G, Kairalla RA, Deheinzelin D, Munoz C, Oliveira
R, Takagaki TY, Carvalho CR: Effect of a protective-ventilation
strategy on mortality in the acute respiratory distress
syndrome. N Engl J Med 1998, 338:347-354.
5. The National Heart, Lung, and Blood Institute ARDS Clinical Trials
Network: Higher versus lower positive end-expiratory pres-
sures in patients with the acute respiratory distress syndrome.
N Engl J Med 2004, 351:327-336.
6. Reis MD, Struijs A, Koetsier P, van Thiel R, Schepp R, Hop W,
Klein J, Lachmann B, Bogers AJ, Gommers D: Open lung ventila-
tion improves functional residual capacity after extubation in
cardiac surgery. Crit Care Med 2005, 33:2253-2258.
7. Slutsky AS, Hudson LD: PEEP or no PEEP – lung recruitment
may be the solution. N Engl J Med 2006, 354:1839-1841.
8. Hager DN, Brower RG: Customizing lung-protective mechani-
cal ventilation strategies. Crit Care Med 2007, 34:1554-1555.
9. Gattinoni L, Caironi P, Cressoni M, Chiumello D, Ranieri VM, Quin-
tel M, Russo S, Patroniti N, Cornejo R, Bugedo G: Lung recruit-
ment in patients with the acute respiratory distress syndrome.
N Engl J Med 2006, 354:1775-1786.
10. Borges JB, Okamoto VN, Matos GF, Caramez MP, Arantes PR,
Barros F, Souza CE, Victorino JA, Kacmarek RM, Barbas CS, Car-
valho CR, Amato MB: Reversibility of lung collapse and hypox-
emia in early acute respiratory distress syndrome. Am J Respir
Crit Care Med 2006, 174:268-278.
11. Ranieri VM, Giuliani R, Fiore T, Dambrosio M, Milic-Emili J:
Vol-
ume–pressure curve of the respiratory system predicts effects
of PEEP in ARDS: 'occlusion' versus 'constant flow' technique.
Am J Respir Crit Care Med 1994, 149:19-27.
12. Jonson B, Richard JC, Straus C, Mancebo J, Lemaire F, Brochard
L: Pressure–volume curves and compliance in acute lung
injury: evidence of recruitment above the lower inflection
point. Am J Respir Crit Care Med 1999, 159:1172-1178.
13. Lu Q, Constantin J-M, Nieszkowska A, Elman M, Vieira S, Rouby J-
J: Measurement of alveolar derecruitment in patients with
acute lung injury: computerized tomography versus pressure–
volume curve. Crit Care 2006, 10:R95.
14. Vieillard-Baron A, Prin S, Chergui K, Page B, Beauchet A, Jardin F:
Early patterns of static pressure–volume loops in ARDS and
their relationship with PEEP-induced recruitment. Intensive
Care Med 2003, 29:1929-1935.
15. Hickling KG: The pressure–volume curve is greatly modified by
recruitment. A mathematical model of ARDS lungs. Am J
Respir Crit Care Med 1998, 158:194-202.
16. Jonson B, Svantesson C: Elastic pressure–volume curves: what
information do they convey? Thorax 1999, 54:82-87.
17. Larsson A, Linnarsson D, Jonmarker C, Jonson B, Larsson H,
Werner O: Measurement of lung volume by sulfur hexafluoride
washout during spontaneous and controlled ventilation: fur-
ther development of a method. Anesthesiology 1987,
67:543-550.
18. Dyhr T, Bonde J, Larsson A: Lung recruitment manoeuvres are
effective in regaining lung volume and oxygenation after open
endotracheal suctioning in acute respiratory distress
syndrome. Crit Care 2003, 7:55-62.
19. Ingimarsson J, Björklund LJ, Larsson A, Werner O: The pressure
at the lower inflexion point has no relation to airway collapse
Key messages
• Registering airway pressure – lung volume loops and
measurements of end-expiratory lung volume are easily
obtained at the bedside with modern ventilators.
• This animal study indicates that these measures might
predict whether a lung recruitment maneuver would be
effective in the treatment of acute lung injury.
Available online />Page 9 of 9
(page number not for citation purposes)
in surfactant-treated premature lambs. Acta Anaesthesiol
Scand 2001, 45:690-695.
20. Bland JM, Altman DG: Comparing methods of measurement:
why plotting difference against standard method is
misleading. Lancet 1995, 346:1085-1087.
21. Luecke T, Meinhardt JP, Herrmann P, Weisser G, Pelosi P, Quintel
M: Setting mean airway pressure during high-frequency oscil-
latory ventilation according to the static pressure–volume
curve in surfactant-deficient lung injury: a computed tomogra-
phy study. Anesthesiology 2003, 99:1313-1322.
22. Bitzen U, Enoksson J, Uttman L, Niklason L, Johansson L, Jonson
B: Multiple pressure–volume loops recorded with sinusoidal
low flow in a porcine acute respiratory distress syndrome
model. Clin Physiol Funct Imaging 2006, 26:113-119.
23. Chiumello D, Carlesso E, Aliverti A, Dellacà RL, Pedotti A, Pelosi
PP, Gattinoni L: Effects of volume shift on the pressure–vol-
ume curve of the respiratory system in ALI/ARDS patients.
Minerva Anestesiol 2007, 73:109-118.
24. Neumann P, Berglund JE, Fernández Mondéjar E, Magnusson A,
Hedenstierna G: Dynamics of lung collapse and recruitment
during prolonged breathing in porcine lung injury. J Appl
Physiol 1998, 85:1533-1543.
25. Lynch JP, Mhyre JG, Dantzker DR: Influence of cardiac output on
intrapulmonary shunt. J Appl Physiol 1979, 46:315-321.
26. Henzler D, Pelosi P, Dembinski R, Ullmann A, Mahnken AH, Ros-
saint R, Kuhlen R: Respiratory compliance but not gas
exchange correlates with changes in lung aeration after a
recruitment maneuver: an experimental study in pigs with
saline lavage lung injury. Crit Care 2005, 9:R471-R482.
27. Arnaud W, Thille AW, Richard J-CM, Maggiore SM, Ranieri VM,
Brochard L: Alveolar recruitment in pulmonary and extrapul-
monary acute respiratory distress syndrome. Comparison
using pressure–volume curve or static compliance. Anesthesi-
ology 2007, 106:212-217.