glycemic targets in clinical practice postprandial vs preprandial and fasting
Bạn đang xem bản rút gọn của tài liệu. Xem và tải ngay bản đầy đủ của tài liệu tại đây (4.22 MB, 63 trang )
Glycemic Targets in Clinical Practice:
Glycemic Targets in Clinical Practice:
Postprandial vs Preprandial
Postprandial vs Preprandial
and Fasting?
and Fasting?
Steven D Wittlin MD
Steven D Wittlin MD
University of Rochester School of Medicine and
University of Rochester School of Medicine and
Dentistry
Dentistry
Rochester, New York
Rochester, New York
In all affairs it’s a healthy
In all affairs it’s a healthy
thing now and then to hang a
thing now and then to hang a
question mark on the things
question mark on the things
you have long taken for
you have long taken for
granted……
granted……
Bertrand Russell
Bertrand Russell
The question is not whether to target postprandial,
The question is not whether to target postprandial,
preprandial or fasting glycemia, but
preprandial or fasting glycemia, but
when
when
,
,
how
how
, and to
, and to
what
what
goals
goals
.
.
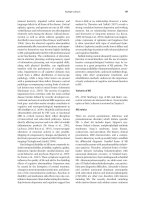
UKPDS Epidemiologic Data in Type
UKPDS Epidemiologic Data in Type
2 Diabetes
2 Diabetes
No A1C Threshold
No A1C Threshold
0%
10%
20%
30%
40%
50%
60%
70%
80%
5 6 7 8 9 10 11
Adjusted
incidence per 1000
person-years
Myocardial infarction
Microvascular endpoints
Updated mean A1C (%)
Stratton IM, et al. BMJ. 2000;321:405-412.
What are appropriate goals?
What are appropriate goals?
HbA
HbA
1c
1c
FPG
FPG
2 hr PPG
2 hr PPG
Normalization of
Normalization of
Glycemia
Glycemia
Woerle HJ et al . Am J Physiol 290:E67-E77, 2006
Woerle HJ et al . Am J Physiol 290:E67-E77, 2006
What is Normal?
What is Normal?
HbA
HbA
1c
1c
<6.0%
<6.0%
FPG
FPG
<100 mg/dl (5.5 mM)
<100 mg/dl (5.5 mM)
1 hr PPG
1 hr PPG
<162 mg/dl (9.0 mM)
<162 mg/dl (9.0 mM)
2 hr PPG <126 mg/dl (7.0 mM)
2 hr PPG <126 mg/dl (7.0 mM)
(N=15)
Hyperglycemia is a continuous
Hyperglycemia is a continuous
risk factor for CVD
risk factor for CVD
Therefore normality should be
Therefore normality should be
the goal if it can be safely
the goal if it can be safely
achieved
achieved
CDA: HbA1C<7% “
CDA: HbA1C<7% “
consider targets in the normal range
consider targets in the normal range
for patients in whom it can be achieved safely ”
for patients in whom it can be achieved safely ”
ADA: “ for patients in general is an A1C<7%
ADA: “ for patients in general is an A1C<7%
for the
for the
individual patient is an A1C as close to normal (<6.0%)
individual patient is an A1C as close to normal (<6.0%)
as possible
as possible
without significant hypoglycemia ”
without significant hypoglycemia ”
ADA, Diabetes Care 29:S4-S42, 2006. CDA, Can J Diabetes 27:S1-S151, 2003
ADA, Diabetes Care 29:S4-S42, 2006. CDA, Can J Diabetes 27:S1-S151, 2003
To achieve a normal or near normal HbA
To achieve a normal or near normal HbA
1c
1c
, both FPG and
, both FPG and
PPG levels must be normal or near normal.
PPG levels must be normal or near normal.
Thus both FPG and PPG must be targets for therapy
Thus both FPG and PPG must be targets for therapy
Nevertheless, might there be situations in which it is
Nevertheless, might there be situations in which it is
preferable to treat one or the other first ???
preferable to treat one or the other first ???
Postprandial Hyperglycemia
Postprandial Hyperglycemia
Patients With Type 2 Diabetes May Spend More Than
Patients With Type 2 Diabetes May Spend More Than
12 Hours per Day in the Postprandial State
12 Hours per Day in the Postprandial State
Adapted from Monnier L. Eur J Clin Invest. 2000;30(suppl 2):3-11.
Duration of postprandial state
Breakfast Lunch Dinner Midnight 4 AM Breakfast
8 AM 11 AM 2 PM 5 PM
Postprandial Postabsorptive Fasting
Correlation between plasma glucose levels
Correlation between plasma glucose levels
after OGTT and standard mixed meal
after OGTT and standard mixed meal
Wolever TMS et al. Diabetes Care 1998;21:336–40
r=0.97
r=0.97
Changes in Postprandial Glucose
Changes in Postprandial Glucose
Metabolism in Type 2 DM
Metabolism in Type 2 DM
Use triple isotope technique and indirect calorimetry
Use triple isotope technique and indirect calorimetry
DM pts had:
DM pts had:
increased overall glucose release
increased overall glucose release
Increased gluconeogenesis and glycogenolysis
Increased gluconeogenesis and glycogenolysis
~90% of the increased glucose release occurred in
~90% of the increased glucose release occurred in
the first 90 min post-prandial
the first 90 min post-prandial
In DM glucose clearance and oxidation were
In DM glucose clearance and oxidation were
reduced
reduced
Non-oxidative glycolysis was increased
Non-oxidative glycolysis was increased
Net splanchnic glucose storage was reduced ~ 45%
Net splanchnic glucose storage was reduced ~ 45%
d.t. increased glycogen cycling
d.t. increased glycogen cycling
Woerle HJ et al Am J Physiol Endocrinol Metab 2006
Relationship between HbA1C, FPG and 2 h. PPG
Relationship between HbA1C, FPG and 2 h. PPG
Van Haeften T et al Metabolism 2000
Van Haeften T et al Metabolism 2000
Woerle HJ et al Arch Intern Med.
2004;164:1627-1632.
Relative Changes in FPG and 2-h PG
Relative Changes in FPG and 2-h PG
as HbA
as HbA
1c
1c
Increases
Increases
4 5 6 7
70
160
250
Plasma Glucose
(mg/dL)
= HbA
1c
versus 2hppg
= HbA
1c
versus FPG
r = 0.55
y = 47.1 x -109
r = 0.48
y = 12.0 x +30
HbA
1c
(%)
In Individuals with HbA1C <6.5%, Postload
In Individuals with HbA1C <6.5%, Postload
Dysglycemia Predominates
Dysglycemia Predominates
Woerle HJ et al Arch Intern Med.
2004;164:1627-1632.
As Patients Get Closer to A1C Goal,
As Patients Get Closer to A1C Goal,
the Need to Successfully
the Need to Successfully
Manage PPG Significantly Increases
Manage PPG Significantly Increases
Adapted from Monnier L, Lapinski H, Collette C. Contributions of fasting and
postprandial plasnma glucose increments to the overall diurnal hyper glycemia
of Type 2 diabetic patients: variations with increasing levels of HBA(1c).
Diabetes Care. 2003;26:881-885.
Post-Prandial Hyperglycemia
Post-Prandial Hyperglycemia
Antecedes Fasting Hyperglycemia
Antecedes Fasting Hyperglycemia
Monnier L et al Diabetes Care 30:263-269, 2007
PPG, but not FPG distinguishes patients with
PPG, but not FPG distinguishes patients with
HbA1C Between 6.0-7.0%
HbA1C Between 6.0-7.0%
Characteristics
Characteristics
# of patients
# of patients
Gender
Gender
Age
Age
BMI
BMI
FPG
FPG
2hPPG
2hPPG
Mean HbA1C
Mean HbA1C
6.0-6.5
6.0-6.5
6.6-7.0
6.6-7.0
37 16
37 16
14/23 8/8
14/23 8/8
54.6 49.6
54.6 49.6
27.8 27.9
27.8 27.9
111 113
111 113
(p=0.88)
(p=0.88)
198 226
198 226
(p=0.03)
(p=0.03)
6.26 6.73
6.26 6.73
HbA1C Group (%)
Woerle HJ et al Arch Intern Med.
2004;164:1627-1632.
Therefore, the initial HbA
Therefore, the initial HbA
1c
1c
can be a guide.
can be a guide.
Relative risk for death increases with
Relative risk for death increases with
2-hour blood glucose irrespective of
2-hour blood glucose irrespective of
the FPG level
the FPG level
<6.1 6.1–6.9 ≥7.0
≥11.1
7.8–11.0
<7.8
Fasting plasma glucose (mmol/l)
2
-
h
o
u
r
p
l
a
s
m
a
g
l
u
c
o
s
e
(
m
m
o
l
/
l
)
2.5
2.0
1.5
1.0
0.5
0.0
Hazard ratio
Adjusted for age, center, sex
DECODE Study Group. Lancet 1999;354:617–621
THE FUNAGATA DIABETES STUDY
Impaired Glucose Tolerance is a CV Risk Factor
Tominaga M, et al. Impaired glucose tolerance is a risk factor for cardiovascular disease, but not impaired fasting glucose. Diabetes Care
1999;22:920-4.
Normal
IGT (2 hr PG 140-200)
DM (2 hr PG >200)
1.00
Cumulative Cardiovascular Survival
0.99
0.98
0.97
0.96
0.95
0.94
0
1.00
0.98
0.96
0.94
0.92
0
Normal
IFG (FPG 110-126)
DM (FPG >126)
0 1 2 3 4 5 6 7
0 1 2 3 4 5 6 7
Year
Year
Effect of Acarbose on CVD in Patients
Effect of Acarbose on CVD in Patients
with IGT ( STOP-NIDDM)
with IGT ( STOP-NIDDM)
( Chiasson J - L et al JAMA July 2003 )
( Chiasson J - L et al JAMA July 2003 )
Controlling Postprandial Glucose
Controlling Postprandial Glucose
Prospective trial of fasting vs pc control in 164 pts w/ Type
Prospective trial of fasting vs pc control in 164 pts w/ Type
2 DM
2 DM
Forced titration to target either FBS < 100 or 90 min pc <
Forced titration to target either FBS < 100 or 90 min pc <
140
140
Results:
Results:
HbA1C fell from 8.7 % to 6.5%
HbA1C fell from 8.7 % to 6.5%
Only 64% of patients achieving FPG < 100 reached HbA1C < 7%
Only 64% of patients achieving FPG < 100 reached HbA1C < 7%
94% of patients w/ pc < 140 reached HbA1C < 7%
94% of patients w/ pc < 140 reached HbA1C < 7%
Decreased pc BG accounted nearly twice as much as FBS for fall
Decreased pc BG accounted nearly twice as much as FBS for fall
in HbA1C
in HbA1C
If HbA1C < 6.2% , pc accounted for ~ 90%
If HbA1C < 6.2% , pc accounted for ~ 90%
If HbA1C > 8.9%, pc accounted for ~ 40%
If HbA1C > 8.9%, pc accounted for ~ 40%
Woerle HJ et al in press
Relationship Between HbA
Relationship Between HbA
1c
1c
, FPG
, FPG
and PPG in Treated T2DM Patients
and PPG in Treated T2DM Patients
Major
Major
HbA
HbA
1c
1c
(%)
(%)
FPG (mM) PPG (mM) Problem
FPG (mM) PPG (mM) Problem
5
5
5.1
5.1
7.0
7.0
-
-
6
6
6.3
6.3
8.4
8.4
PPG
PPG
7
7
7.5
7.5
9.8
9.8
PPG
PPG
8
8
8.7
8.7
11.2
11.2
FPG+PPG
FPG+PPG
9
9
9.9
9.9
12.6
12.6
FPG+PPG
FPG+PPG
10
10
11.1
11.1
14.0
14.0
FPG
FPG
Woerle et al., 2006.
Woerle et al., 2006.