combined effects of obesity, acid reflux and smoking on the risk of adenomacarcinomas of the oesophagus 2008
Bạn đang xem bản rút gọn của tài liệu. Xem và tải ngay bản đầy đủ của tài liệu tại đây (341.48 KB, 9 trang )
doi:10.1136/gut.2007.131375
2008;57;173-180; originally published online 11 Oct 2007; Gut
Webb, A C Green and for the Australian Cancer Study
D C Whiteman, S Sadeghi, N Pandeya, B M Smithers, D C Gotley, C J Bain, P M
oesophagus
smoking on the risk of adenocarcinomas of the
Combined effects of obesity, acid reflux and
/>Updated information and services can be found at:
These include:
References
/>3 online articles that cite this article can be accessed at:
/>This article cites 47 articles, 26 of which can be accessed free at:
service
Email alerting
the top right corner of the article
Receive free email alerts when new articles cite this article - sign up in the box at
Topic collections
(328 articles) Editor's choice
Articles on similar topics can be found in the following collections
Notes
/>To order reprints of this article go to:
/> go to: GutTo subscribe to
on 11 August 2008 gut.bmj.comDownloaded from
Combined effects of obesity, acid reflux and smoking
on the risk of adenocarcinomas of the oesophagus
D C Whiteman,
1
S Sadeghi,
1,2
N Pandeya,
1,2
B M Smithers,
3
D C Gotley,
3
C J Bain,
2
P M Webb,
1
A C Green,
1
for the Australian Cancer Study
1
Queensland Institute of
Medical Research, Brisbane,
Australia;
2
School of Population
Health, University of
Queensland, Brisbane, Australia;
3
School of Medicine, University
of Queensland, Brisbane,
Australia
Correspondence to:
Dr D C Whiteman, Division of
Population Studies and Human
Genetics, Queensland Institute
of Medical Research, PO Royal
Brisbane Hospital, Queensland
4029, Australia; david.
The Australian Cancer Study:
Oesophageal Cancer
Investigators : David C
Whiteman MBBS, PhD;
Penelope M Webb MA, D Phil;
Adele C Green MBBS, PhD;
Nicholas K Hayward PhD; Peter
G Parsons PhD; David M Purdie
PhD
Clinical collaborators: B Mark
Smithers FRACS; David Gotley
FRACS, PhD; Andrew Clouston
FRCAP, PhD; Ian Brown FRCAP
Project manager: Suzanne
Moore RN, MPH
Database: Karen Harrap BIT;
Troy Sadkowski BIT
Research nurses: Suzanne
O’Brien RN, MPH; Ellen Minehan
RN; Deborah Roffe RN; Sue
O’Keefe RN; Suzanne Lipshut
RN; Gabby Connor RN; Hayley
Berry RN; Frances Walker RN;
Teresa Barnes RN; Janine
Thomas RN; Linda Terry RN,
MPH; Michael Connard BSc;
Leanne Bowes BSc; MaryRose
Malt RN; Jo White RN
Revised 22 July 2007
Accepted 7 August 2007
Published Online First
11 October 2007
ABSTRACT
Objective: To measure the relative risks of adenocarci-
nomas of the oesophagus and gastro-oesophageal
junction associated with measures of obesity, and their
interactions with age, sex, gastro-oesophageal reflux
symptoms and smoking.
Design and setting: Population-based case–control
study in Australia.
Patients: Patients with adenocarcinomas of the oeso-
phagus (n = 367) or gastro-oesophageal junction
(n = 426) were compared with control participants
(n = 1580) sampled from a population register.
Main outcome measure: Relative risk of adenocarci-
noma of the oesophagus or gastro-oesophageal junction.
Results: Risks of oesophageal adenocarcinoma increased
monotonically with body mass index (BMI) (p
trend
,0.001). Highest risks were seen for BMI >40 kg/m
2
(odds ratio (OR) = 6.1, 95% CI 2.7 to 13.6) compared
with ‘‘healthy’’ BMI (18.5–24.9 kg/m
2
). Adjustment for
gastro-oesophageal reflux and other factors modestly
attenuated risks. Risks associated with obesity were
substantially higher among men (OR = 2.6, 95% CI 1.8 to
3.9) than women (OR = 1.4, 95% CI 0.5 to 3.5), and
among those aged ,50 years (OR = 7.5, 95% CI 1.7 to
33.0) than those aged >50 years (OR = 2.2, 95% CI 1.5
to 3.1). Obese people with frequent symptoms of gastro-
oesophageal reflux had significantly higher risks
(OR = 16.5, 95% CI 8.9 to 30.6) than people with obesity
but no reflux (OR = 2.2, 95% CI 1.1 to 4.3) or reflux but
no obesity (OR = 5.6, 95% 2.8 to 11.3), consistent with a
synergistic interaction between these factors. Similar
associations, but of smaller magnitude, were seen for
gastro-oesophageal junction adenocarcinomas.
Conclusions: Obesity increases the risk of oesophageal
adenocarcinoma independently of other factors, particu-
larly among men. From a clinical perspective, these data
suggest that patients with obesity and frequent
symptoms of gastro-oesophageal reflux are at especially
increased risk of adenocarcinoma.
The incidence of adenocarcinomas of the oesopha-
gus and the gastro-oesophageal junction has been
rising in many countries,
1–4
in some populations
faster than for any other major cancer.
5
In contrast,
the incidence of oesophageal squamous cell carci-
noma (SCC) has remained stable or even declined
in the same populations over the same periods.
Such widespread changes in occurrence imply a
profound shift in the prevalence of causal expo-
sures, given no equivalent systematic changes in
detection or diagnosis.
5
Epidemiological studies strongly implicate gas-
tro-oesophageal reflux as the primary causal factor
for oesophageal adenocarcinoma
67
and, to a lesser
extent, adenocarcinomas of the gastro-oesophageal
junction. Obesity and overweight are associated
with an increased prevalence of gastro-oesophageal
reflux symptoms,
8–14
and thus gastro-oesophageal
reflux has been widely (although not universally
15
)
assumed to explain the observed increase in risk of
oesophageal adenocarcinoma associated with
higher levels of body mass.
16–20
However, obesity
has been linked with markedly increased risks of
other cancers,
21 22
and thus there are plausible
grounds for speculating that high levels of body
fat may promote carcinogenesis through other
pathways.
23
These alternative causal hypotheses
remain largely untested for oesophageal cancers.
Here, we report the findings of a large popula-
tion-based case–control study evaluating the
effects of obesity on the risk of adenocarcinomas
of the oesophagus and gastro-oesophageal junc-
tion, alone and in combination with other causal
factors.
PATIENTS AND METHODS
Approval to undertake the study was obtained
from the research ethics committees of the
Queensland Institute of Medical Research and
participating hospitals. We obtained written
informed consent from case patients and control
participants to take part.
Study participants
Patients eligible for inclusion were those people
aged 18–79 years with a histologically confirmed
primary invasive adenocarcinoma or squamous cell
carcinoma of the oesophagus or gastro-oesophageal
junction diagnosed from 1 July 2001 (in
Queensland) or 1 July 2002 (in the other mainland
states of Australia) until 30 June 2005. The
principal mode of ascertainment was via major
treatment centres throughout Australia; those
missed at these centres were identified by state-
based cancer registries (notification of cancer
diagnosis is mandatory in all states of Australia).
We identified 1610 eligible patients with a
primary diagnosis of oesophageal cancer attending
treatment centres during the study period. Of
these, doctors refused contact with 71 patients and
167 died before consent could be obtained. A
further 181 patients were excluded because they
were too ill (91), mentally incapable (23), could not
read or write in English (41) or were uncontactable
(26). The remaining 1191 patients were invited to
participate, and of these, 928 (78% of those invited)
agreed to take part.
Oesophagus
Gut 2008;57:173–180. doi:10.1136/gut.2007.131375 173
on 11 August 2008 gut.bmj.comDownloaded from
A further 739 alive and eligible patients were identified by the
cancer registries (835 potentially eligible patients died before
being identified by the cancer registries), and of these, treating
doctors refused contact for 84 patients, 37 patients were
incapable of taking part and 232 patients were unable to be
contacted. The remaining 386 cancer registry patients were
invited to take part, of whom 253 agreed (66% of those invited).
Thus, a total of 1181 patients with oesophageal cancer
consented to take part in the study (928 clinic patients and
253 registry patients). Questionnaires were returned by 1102
patients (367 and 426 with adenocarcinomas of the oesophagus
and gastro-oesophageal junction respectively, and 309 patients
with SCC).
Potential controls were randomly selected from the
Australian Electoral Roll (enrolment is compulsory). We
prospectively sampled controls from within strata of age (in
5-year age groups) and state of residence to match the
distribution of the case series. We aimed for similar numbers
of male cases and controls in each stratum of age and state;
female controls were intentionally oversampled at all ages to
accommodate their simultaneous enrolment in a parallel case–
control study of ovarian cancer.
24
Of 3258 potentially eligible control participants, 41 could not
be contacted and 175 were excluded because they had died (16),
were too ill (61), or unable to read or write in English (98). Of
3042 controls meeting the inclusion criteria, 1680 (55%) gave
their consent to take part. Completed questionnaires were
returned by 1580 controls (48% of all potentially eligible
controls selected from the roll).
Data collection
Data were collected from all participants through self-com-
pleted, mailed questionnaires. This was followed by a telephone
interview to record detailed information about past use of
drugs, as well as to clarify issues arising from the self-completed
questionnaires, as needed. The questionnaire elicited informa-
tion about social background (education, occupation, income),
as well as height and weight 1 year ago (1 year before diagnosis
for cases), maximum ever weight and weight at age 20 years.
We calculated the body mass index (BMI) by dividing weight in
kilograms by the square of height in metres. Standard BMI
categories were used for analysis (,18.5 kg/m
2
, ‘‘underweight’’;
18.5–24.9 kg/m
2
, ‘‘healthy weight’’; 25–29.9 kg/m
2
, ‘‘over-
weight’’; 30–34.9 kg/m
2
, ‘‘obese I’’, 35–39.9 kg/m
2
‘‘obese II’’
and >40 kg/m
2
‘‘obese III’’).
Participants were asked whether, over their whole life, they
had ever smoked more than 100 cigarettes, cigars, or pipes;
positive responses elicited further questions about ages starting
and stopping smoking and typical daily consumption. We
derived the number of pack-years of tobacco exposure by
dividing the number of cigarettes smoked daily by 20 and
Table 1 Characteristics of study participants
Controls Adenocarcinoma of the oesophagus
Adenocarcinoma of the gastro-
oesophageal junction
Men Women Men Women Men Women
(n =1040) (n =540) (n =330) (n =37) (n= 370) (n =56)
Age Mean (SD) 62.5 (10.5) 56.7 (12.8) 63.5 (9.3) 65.6 (11.9) 63.6 (9.6) 61.8 (10.5)
Educational level (%) School 35.9 50.6 43.6 64.9 37.3 58.9
Trade 29.1 10.0 29.1 18.9 28.4 14.3
Diploma 18.4 25.9 20.0 13.5 22.7 19.6
Degree 16.4 13.3 6.7 2.7 11.1 7.1
Not stated 0.3 0.2 0.6 0 0.5 0
BMI last year Mean (SD) 26.9 (4.2) 26.9 (5.7) 29.1 (5.0) 29.6 (8.3) 28.3 (4.7) 28.8 (6.1)
Maximum BMI Mean (SD) 28.5 (4.6) 28.7 (6.1) 30.8 (5.0) 32.1 (8.5) 29.8 (4.7) 31.3 (7.1)
BMI age 20 years Mean (SD) 23.0 (3.3) 21.6 (3.4) 23.9 (3.6) 22.5 (3.5) 23.6 (3.1) 23.0 (3.7)
Smoking status Never smoker 37.2 59.8 23.9 40.5 20.8 35.7
Quit .20 years 28.1 13.7 25.2 16.2 28.4 14.3
Quit 1–20 years 19.8 12.6 31.2 16.2 23.5 17.9
Current 13.1 13.3 19.1 27.0 26.5 32.1
Cumulative smoking
history (pack-years)
Never smoker 37.2 59.8 23.9 40.5 20.8 35.7
1–14 25.2 24.6 20.0 18.9 20.0 21.4
15–29 15.0 9.4 19.1 16.2 22.7 17.9
30–49 13.2 3.7 22.4 16.2 22.4 23.2
50+ 9.4 2.4 14.6 8.1 14.0 1.8
Frequency of reflux
symptoms 10 years ago
Never 42.1 48.2 21.5 29.7 27.0 35.7
,Weekly 45.1 40.2 36.4 21.6 35.7 32.1
>Weekly 11.9 11.3 41.5 43.2 36.8 30.4
Mean alcohol consumption
(10 g alcohol units/week)
Never drinker 9.5 25.7 7.3 24.3 6.8 25.0
,1 Drink/week 1.5 5.7 2.4 0 0.8 5.4
1–6 Drinks/week 24.6 44.4 19.4 56.8 25.7 44.6
7–20 Drinks/week 36.8 21.5 37.3 18.9 36.2 23.2
21+ Drinks/week 27.5 2.6 33.3 0 30.5 1.8
Frequency of aspirin use Never 39.2 53.0 45.2 62.1 45.1 44.6
Occasional 40.5 34.6 33.6 27.0 34.3 33.9
,Weekly 4.5 2.8 6.1 2.7 3.8 7.1
>Weekly 15.6 9.3 14.2 8.1 15.7 14.3
Column percentages may not sum to 100% owing to rounding and missing values.
Oesophagus
174 Gut 2008;57:173–180. doi:10.1136/gut.2007.131375
on 11 August 2008 gut.bmj.comDownloaded from
multiplying by the total number of years smoked. For analysis,
‘‘never smokers’’ were the reference category and ‘‘ever
smokers’’ were categorised according to total pack-years of
smoking.
We asked participants to report the frequency with which
they consumed different classes of alcohol (low-alcohol beer,
regular beer, white wine, red wine, port/sherry and spirits/
liqueurs) between ages 20–29, 30–49 and >50 years, as
applicable. Total alcohol consumption was summed across all
age groups for all types of alcohol, from which we calculated a
weighted average number of standard drinks (10 g ethanol)
consumed each week between age 20 years and current age.
We assessed the frequency of symptoms of gastro-oesopha-
geal reflux 10 years before diagnosis, defined as the presence of
heartburn (‘‘a burning pain behind the breastbone after eating’’)
or acid reflux (‘‘a sour taste from acid or bile rising up into the
mouth or throat’’). For analysis, we used the highest reported
frequency for either symptom and defined ‘‘frequent symp-
toms’’ as those occurring at least weekly.
910
Frequency of
aspirin intake during the past 5 years was ascertained on a scale
ranging from ‘‘never’’ to ‘‘two or more times/day’’.
Details of the histological type and anatomical site of each
tumour were abstracted from diagnostic pathology reports.
Anatomical sites of tumours were categorised according to the
WHO classification
25
into ‘‘oesophageal’’ and ‘‘gastro-oesopha-
geal junction’’ tumours.
Statistical analyses
We calculated the odds ratio (OR) and 95% confidence interval
(95% CI) associated with each exposure using multivariable
logistic regression analysis in SAS version 9.1 (SAS Institute,
Inc, Cary NC, USA). Statistical significance was determined at
a = 0.05, and all tests for statistical significance were two sided.
Our approach was first, to fit minimally adjusted models which
contained terms for each exposure and the matching variables
(sex, age and state). We then estimated relative risks associated
with BMI adjusted for these variables and income, smoking,
alcohol consumption and frequency of aspirin use. Finally, we
fitted fully adjusted models which included the preceding
variables as well as a term for frequency of gastro-oesophageal
reflux symptoms. For each variable, the lowest category was the
reference category, except for BMI for which the reference was
the healthy weight range. We tested for trend by including each
category as an ordinal variable in the multivariable model, with
category values taken as the midpoint of the range. For variables
in which the lowest category was ‘‘unexposed’’ (eg, pack-years
of smoking), trend tests were restricted to the ‘‘exposed’’
categories.
To assess potential interactions between BMI and reflux or
smoking, we created new variables that reclassified participants
according to their combined exposure to BMI and the other
factors. Risks for each category of combined exposure were
estimated relative to the reference category in multivariable
Table 2 Relative risk for adenocarcinomas of the oesophagus and gastro-oesophageal junction associated with measures of body mass index (BMI)
at different time points
Oesophageal adenocarcinoma Gastro-oesophageal junction adenocarcinoma
Controls/Cases
Fully adjusted,
except reflux*
Fully adjusted,
with reflux{
Cases
Fully adjusted,
except reflux{
Fully adjusted,
with reflux
OR (95% CI) OR (95% CI) OR (95% CI) OR (95% CI)
BMI last year (kg/m
2
)
,18.5 21/1 0.3 (0.0 to 2.6) 0.5 (0.1 to 3.6)
1
0.2 (0.0 to 1.7) 0.3 (0.0 to 2.0)
18.5–24.9 528/71 1.0 (ref) 1.0 (ref)
107
1.0 (ref) 1.0 (ref)
25.0–29.9 650/150 1.4 (1.0 to 1.9) 1.2 (0.9 to 1.7)
168
1.1 (0.8 to 1.4) 1.0 (0.7 to 1.3)
30.0–34.9 222/89 2.7 (1.8 to 3.9) 2.1 (1.4 to 3.1)
98
1.9 (1.3 to 2.6) 1.6 (1.1 to 2.2)
35.0–39.9 68/25 3.1 (1.8 to 5.5) 2.5 (1.4 to 4.4)
27
2.0 (1.2 to 3.4) 1.7 (1.0 to 3.0)
40+ 24/16 7.0 (3.3 to 15.0) 6.1 (2.7 to 13.6)
9
2.6 (1.1 to 6.2) 2.4 (1.0 to 5.8)
p trend ,0.001 ,0.001 ,0.001 ,0.001
BMI maximum (kg/m
2
)
,18.5 9/1 0.9 (0.1 to 8.7) 1.4 (0.2 to 11.9)
0
––
18.5–24.9 356/39 1.0 (ref) 1.0 (ref)
55
1.0 (ref) 1.0 (ref)
25.0–29.9 708/136 1.4 (0.9 to 2.0) 1.2 (0.8 to 1.7)
178
1.3 (0.9 to 1.8) 1.1 (0.8 to 1.6)
30.0–34.9 333/114 2.5 (1.6 to 3.7) 1.9 (1.3 to 3.0)
122
1.9 (1.3 to 2.7) 1.6 (1.1 to 2.4)
35.0–39.9 107/43 4.1 (2.4 to 6.8) 3.1 (1.8 to 5.3)
47
2.9 (1.8 to 4.6) 2.4 (1.5 to 3.9)
40+ 52/24 5.2 (2.7 to 9.9) 4.4 (2.3 to 8.7)
15
2.1 (1.1 to 4.2) 1.9 (1.0 to 3.8)
p trend ,0.001 ,0.001 ,0.001 ,0.001
BMI age 20 years (kg/m
2
)
,18.5 121/14 0.8 (0.4 to 1.4) 0.8 (0.5 to 1.6)
9
0.4 (0.2 to 0.8) 0.4 (0.2 to 0.8)
18.5–24.9 1144/227 1.0 (ref) 1.0 (ref)
282
1.0 (ref) 1.0 (ref)
25.0–29.9 237/81 1.7 (1.2 to 2.3) 1.7 (1.2 to 2.3)
97
1.6 (1.2 to 2.1) 1.6 (1.2 to 2.2)
30.0–34.9 29/13 2.6 (1.3 to 5.2) 2.4 (1.1 to 5.1)
13
2.1 (1.0 to 4.1) 2.0 (0.9 to 4.1)
35.0+ 6/5 3.6 (1.0 to 13.0) 2.9 (0.8 to 11.2)
2
1.1 (0.2 to 5.9) 1.0 (0.2 to 5.3)
p trend ,0.001 ,0.001 ,0.001 ,0.001
Change in BMI (kg/m
2
)
,3 581/98 1.0 (ref) 1.0 (ref)
131
1.0 (ref) 1.0 (ref)
3–4.9 338/73 1.2 (0.9 to 1.7) 1.0 (0.7 to 1.5)
96
1.1 (0.8 to 1.6) 1.0 (0.7 to 1.4)
5–9.9 406/117 1.7 (1.3 to 2.4) 1.4 (1.0 to 2.0)
115
1.2 (0.9 to 1.6) 1.1 (0.8 to 1.5)
10+ 153/47 2.2 (1.4 to 3.4) 1.8 (1.2 to 2.8)
50
1.6 (1.0 to 2.3) 1.4 (0.9 to 2.1)
p trend ,0.001 0.002 0.05 0.26
*Adjusted for age, sex, state, household income, cumulative smoking history, mean alcohol consumption and frequency of aspirin use in the 5 years before diagnosis.
{Adjusted for above factors and frequency of gastro-oesophageal reflux symptoms 10 years before diagnosis.
Oesophagus
Gut 2008;57:173–180. doi:10.1136/gut.2007.131375 175
on 11 August 2008 gut.bmj.comDownloaded from
logistic regression analyses. To quantify biological interaction,
we calculated the synergy index S
26
using the algorithm of
Andersson.
27
RESULTS
Table 1 presents the distribution of salient characteristics of
cases and controls. Female controls were younger on average
than female case patients owing to their simultaneous sampling
for a related study of ovarian cancer.
BMI and risk of adenocarcinoma of the oesophagus
In multivariable models adjusting for age, sex, income, smoking,
alcohol and aspirin consumption, we found that people who
were overweight had modestly increased risks of oesophageal
adenocarcinoma compared with the reference category, and
risks increased with increasing BMI (p
trend
,0.001). Severely
obese people (BMI >40 kg/m
2
) had a sevenfold increased risk of
adenocarcinoma compared with people in the healthy weight
range. Further adjustment for symptoms of reflux attenuated
the association only modestly, and relative risks for the severely
obese category remained very high (table 2). Collapsing the
three obese categories into a single group (ie, BMI >30 kg/m
2
)
yielded a crude risk estimate of 3.3 (95% CI 2.3 to 4.6) which
reduced to 2.4 (95% CI 1.7 to 3.5) after full adjustment.
Patterns of risk associated with maximum ever BMI were
similar to those seen for BMI in the year before diagnosis. Fully
adjusting for confounding factors reduced the risk estimates
somewhat; however, significant, dose-dependent associations
with BMI persisted (p
trend
,0.001). At age 20 years, the
distribution of BMI was narrow with fewer than 20% of
controls reportedly overweight or obese. Nevertheless, we
observed significant trends of increasing risk with successively
higher BMI categories at this age group, even after fully
adjusting for other factors (table 2).
Weight gain during adulthood was associated with modestly
increased risks of oesophageal adenocarcinoma, although this
was statistically significant only for marked increases in BMI
(.5 kg/m
2
) after adjusting for confounding factors (table 2). As
the magnitude of the effect for BMI in the year before diagnosis
was largest and remained highly significant after adjusting for
the other BMI terms, we used this measure for subsequent
analyses.
BMI and risk of adenocarcinoma of the gastro-oesophageal
junction
Significant trends of increasing risk of adenocarcinoma of the
gastro-oesophageal junction with increasing BMI were seen,
although the overall magnitude of risks was substantially lower
than for oesophageal adenocarcinomas (table 2), and this
approached statistical significance for measures of BMI in the
year before diagnosis (p = 0.080) and maximum ever BMI
(p = 0.075). Again, adjusting for gastro-oesophageal reflux and
other factors led to modest attenuation of effects. Large
increases in weight gain since age 20 years were associated
with non-significantly increased risks of gastro-oesophageal
adenocarcinoma.
Effects of sex and age
In stratified analyses, the risks of oesophageal adenocarcinoma
associated with BMI were higher among men than women, and
were higher among those aged ,50 years than those aged >50
years (table 3). Similar patterns of effect modification were seen
for gastro-oesophageal junction adenocarcinomas.
Combined effects of obesity and gastro-oesophageal reflux
Risks of oesophageal adenocarcinoma increased with increasing
frequency of reflux symptoms (‘‘Overall association’’, table 4).
After reclassifying participants according to their BMI category
(‘‘healthy’’, ‘‘overweight’’ or ‘‘obese’’) combined with their
reflux symptoms frequency (‘‘none’’, ‘‘less than weekly’’, ‘‘at
least weekly’’), we observed stepwise increases in the risk of
oesophageal adenocarcinoma with increasing BMI among those
with no reflux symptoms (table 4). Similarly, risks of
oesophageal adenocarcinoma increased steadily with reflux
Table 3 Relative risks for adenocarcinomas of the oesophagus and gastro-oesophageal junction associated with body mass index in the year before
diagnosis, stratified by sex and age
BMI Controls/cases
Oesophageal adenocarcinoma Gastro-oesophageal junction adenocarcinoma
Fully adjusted,
except reflux*
Fully adjusted,
with reflux{
Cases
Fully adjusted,
except reflux
Fully adjusted,
with reflux
OR (95% CI) OR (95% CI) OR (95% CI) OR (95% CI)
Women
,25.0 224/12 1.0 (ref) 1.0 (ref) 16 1.0 (ref) 1.0 (ref)
25.0–29.9 166/8 0.5 (0.2 to 1.5) 0.5 (0.2 to 1.5) 18 1.0 (0.6 to 2.7) 1.2 (0.5 to 2.5)
>30.0 125/13 1.7 (0.7 to 4.1) 1.4 (0.5 to 3.5) 22 2.3 (1.1 to 4.7) 1.9 (0.9 to 4.1)
Men
,25.0 325/60 1.0 (ref) 1.0 (ref) 92 1.0 (ref) 1.0 (ref)
25.0–29.9 484/142 1.6 (1.1 to 2.2) 1.3 (0.9 to 1.9) 150 1.1 (0.8 to 1.5) 1.0 (0.7 to 1.4)
>30.0 189/117 3.3 (2.3 to 4.8) 2.6 (1.8 to 3.9) 112 2.1 (1.5 to 2.9) 1.7 (1.2 to 2.5)
Age ,50 years
,25.0 127/5 1.0 (ref) 1.0 (ref) 9 1.0 (ref) 1.0 (ref)
25.0–29.9 94/10 1.8 (0.5 to 6.7) 1.4 (0.3 to 5.5) 20 1.8 (0.7 to 4.7) 1.3 (0.5 to 3.8)
>30.0 49/14 10.5 (2.7 to 40.9) 7.5 (1.7 to 33.0) 14 3.9 (1.3 to 11.6) 3.5 (1.1 to 11.4)
Age >50 years
,25.0 422/67 1.0 (ref) 1.0 (ref) 99 1.0 (ref) 1.0 (ref)
25.0–29.9 556/140 1.4 (1.0 to 2.0) 1.2 (0.9 to 1.7) 148 1.1 (0.8 to 1.5) 1.0 (0.7 to 1.3)
>30.0 265/116 2.8 (1.9 to 3.9) 2.2 (1.5 to 3.1) 120 1.9 (1.4 to 2.7) 1.6 (1.2 to 2.3)
*Adjusted for age (in years), sex, state of residence, household income, cumulative smoking history, mean alcohol consumption and frequency of aspirin use in the 5 years before
diagnosis.
{Adjusted for above factors and frequency of gastro-oesophageal reflux symptoms 10 years before diagnosis.
Oesophagus
176 Gut 2008;57:173–180. doi:10.1136/gut.2007.131375
on 11 August 2008 gut.bmj.comDownloaded from
frequency among those in the ‘‘healthy’’ BMI range. People in
the highest combined exposure category (ie, BMI >30.0 with at
least weekly symptoms of reflux) had significantly higher risks
of oesophageal adenocarcinoma than people with only one of
these conditions. Risks of combined exposure were almost
threefold higher than expected assuming additive interactions
(S = 2.7, 95% CI 1.3 to 5.4).
Risks of gastro-oesophageal junction adenocarcinomas were
also substantially higher for obese people than those in the
healthy weight range at each level of reflux frequency. The co-
occurrence of obesity and frequent reflux symptoms (OR =5.8,
95% CI 3.3 to 10.1) led to considerably higher risks than either
obesity in the absence of reflux (OR = 2.1, 95% CI 1.3 to 3.6) or
reflux in the absence of obesity (OR = 3.6, 95% CI 2.0 to 6.7),
but the risks were not significantly different from those
expected assuming additive effects (S = 1.3, 95% CI 0.6 to 2.7).
Combined effects of obesity and smoking
Smokers with high cumulative exposures had significantly
higher risks of oesophageal and gastro-oesophageal junction
adenocarcinomas than never smokers (table 4, ‘‘Smoking overall
association’’). Analysis of smoking status (never, former,
current) resulted in associations of similar magnitude (oesopha-
geal adenocarcinoma: former smokers OR = 1.5, 95% 1.1 to 2.1;
current smokers OR = 2.3, 95% CI 1.5 to 3.5; gastro-oesopha-
geal adenocarcinoma: former smokers OR = 1.9, 95% CI 1.4 to
2.6; current smokers OR = 4.3, 95% CI 3.0 to 6.1). For
adenocarcinomas of the oesophagus, risk estimates for cumu-
lative smoking history were only minimally attenuated after
further adjusting for smoking status, whereas for adenocarci-
nomas of the gastro-oesophageal junction, there was modest
attenuation (not shown). After reclassifying participants
according to BMI and their smoking history, we found risks
of adenocarcinomas of the oesophagus increased monotonically
with BMI among never smokers. There was no evidence that
combined exposure to obesity and heavy smoking led to higher
or lower risks than predicted under an additive model (S = 0.6,
95% CI 0.3 to 1.4). Generally similar patterns were observed for
adenocarcinomas of the gastro-oesophageal junction.
DISCUSSION
We found consistently higher risks of adenocarcinomas of the
oesophagus and gastro-oesophageal junction among obese
people than among those in the healthy weight range. Our
data suggest that the risks associated with obesity are
independent of the risks associated with symptoms of gastro-
oesophageal reflux and other factors. Indeed, these epidemiolo-
gical data might be cautiously interpreted as evidence for
synergistic activity between high body mass and gastro-
oesophageal reflux in promoting adenocarcinomas of the
oesophagus, and to a lesser extent, the gastro-oesophageal
junction.
Obesity has previously been shown to be a determinant of
gastro-oesophageal reflux in many studies,
9–11 13 14
although not
Table 4 Relative risks for adenocarcinomas of the oesophagus and gastro-oesophageal junction associated with symptoms of gastro-oesophageal
reflux or smoking, overall and combined with body mass index (BMI) category
Frequency of reflux
Reflux overall association
Reflux combined with BMI
BMI ,25 BMI 25–24.9 BMI >30
Controls/cases
OR*
(95% CI) Controls/cases
OR{
(95% CI) Controls/cases
OR
(95% CI)
Controls/
cases
OR
(95% CI)
Adenocarcinoma
oesophagus
Never 698/82 1.0 (ref) 279/22 1.0 (ref) 253/36 1.6 (0.9 to 2.8) 122/20 2.2 (1.1 to 4.3)
,Weekly 686128 1.5 (1.1 to 2.0) 218/26 1.4 (0.8 to 2.7) 320/53 1.8 (1.1 to 3.2) 143/46 3.9 (2.2 to 7.0)
>Weekly 184/153 6.4 (4.5 to 9.0) 52/24 5.6 (2.8 to 11.3) 77/59 7.4 (4.1 to 13.5) 49/64 16.5 (8.9 to 30.6)
Adenocarcinoma gastro-
oesophageal junction
Never 698/120 1.0 (ref) 279/38 1.0 (ref) 253/36 0.8 (0.5 to 1.4) 122/40 2.1 (1.3 to 3.6)
,Weekly 686/150 1.1 (0.9 to 1.5) 218/40 1.2 (0.7 to 1.9) 320/58 1.0 (0.7 to 1.7) 143/47 1.9 (1.2 to 3.2)
>Weekly 184/153 4.5 (3.3 to 6.1) 52/28 3.6 (2.0 to 6.7) 77/74 5.5 (3.3 to 8.9) 49/47 5.8 (3.3 to 10.1)
Smoking history
Smoking overall association
Smoking combined with BMI
BMI ,25 BMI 25–24.9 BMI >30
Controls/cases OR (95% CI) Controls/cases OR{ 95% CI{) Controls/cases OR (95% CI)
Controls/
cases OR (95% CI)
Adenocarcinoma
oesophagus
Never smoker 710/94 1.0 (ref) 277/22 1.0 (ref) 274/35 1.2 (0.7 to 2.3) 127/34 3.5 (1.9 to 6.6)
1–29 Pack-years 602/142 1.4 (1.0 to 2.0) 185/19 1.2 (0.6 to 2.4) 272/63 2.0 (1.1 to 3.5) 117/56 3.8 (2.1 to 6.9)
30+ Pack-years 268/131 2.3 (1.6 to 3.3) 87/31 3.0 (1.5 to 5.8) 104/52 3.5 (1.9 to 6.5) 70/40 3.8 (2.0 to 7.4)
Adenocarcinoma gastro-
oesophageal junction
Never smoker 710/97 1.0 (ref) 277/34 1.0 (ref) 274/33 0.9 (0.5 to 1.6) 127/25 1.9 (1.1 to 3.5)
1–29 Pack-years 602/180 2.1 (1.5 to 2.8) 185/35 1.8 (1.0 to 3.1) 272/82 2.0 (1.2 to 3.2) 117/58 3.6 (2.2 to 6.1)
30+ Pack-years 268/149 3.2 (2.3 to 4.6) 87/39 3.2 (1.8 to 5.8) 104/53 3.1 (1.8 to 5.4) 70/51 4.6 (2.6 to 8.1)
*Odds ratio and 95% confidence interval adjusted for age (in years), sex, income, state of residence, cumulative smoking history, alcohol consumption, frequency of aspirin use in
the past 5 years, frequency of gastro-oesophageal reflux symptoms 10 years before diagnosis and BMI in the year before diagnosis.
{Odds ratio and 95% confidence interval adjusted for age (in years), sex, income, state of residence, cumulative smoking history, alcohol consumption and frequency of aspirin use
in the past 5 years.
{Odds ratio adjusted for age (in years), sex, income, state of residence, frequency of gastro-oesophageal reflux symptoms 10 years before diagnosis, alcohol consumption and
frequency of aspirin use in the past 5 years.
Oesophagus
Gut 2008;57:173–180. doi:10.1136/gut.2007.131375 177
on 11 August 2008 gut.bmj.comDownloaded from
all.
28
Obesity has also been associated with Barrett’s oesopha-
gus
29
and oesophageal adenocarcinoma.
16–20
A pathway through
which the effect of obesity is mediated by gastro-oesophageal
reflux would be a parsimonious explanation for the observed
association between obesity and oesophageal adenocarcinoma.
15
Our finding that risks of adenocarcinoma were only modestly
attenuated after including the effects of gastro-oesophageal
reflux argues against this simple model, however. Moreover, we
and others
16 19
have found obesity to be associated with
significantly increased risks of oesophageal adenocarcinoma
even among people who had never experienced symptoms of
reflux. Because the risks of combined exposure to high BMI and
frequent symptoms of gastro-oesophageal reflux were signifi-
cantly higher than the sum of the independent risks, we
speculate that obesity plays a further part in the development of
oesophageal adenocarcinoma, over and above its likely role in
promoting reflux. Earlier analyses have suggested higher risks of
BMI in the presence of reflux, although neither of those studies
formally assessed biological interactions.
18 30
Smoking significantly increased the risk of oesophageal and
junctional adenocarcinomas, but there was no evidence of an
interaction with body mass. Among never smokers and those
with a modest smoking history, risks of both cancers were
significantly higher among obese than non-obese people.
However, among heavy smokers, there was no difference in
risk of oesophageal adenocarcinoma between healthy, over-
weight or obese people. Qualitatively similar observations with
stronger effects of BMI among never smokers have been made
previously.
18
This pattern of association might be partly
explained by the effects of smoking on lowering body mass.
31 32
Our study had strengths and weaknesses. The large samples
of patients newly diagnosed with oesophageal and gastro-
oesophageal cancer were prospectively identified and ascer-
tained from the Australian population, and were compared with
a large control series sampled from a population register.
Neither participants nor interviewers were informed of the
study hypotheses, minimising the possibility of biased recall.
Objective measures of adiposity (such as the waist–hip ratio or
waist circumference) are generally preferred to self-reports of
weight and height for studies investigating causal associations.
14
Such measures are not appropriate for case–control studies
where cancer is the end point, however, because case
participants in such studies have typically lost considerable
amounts of body mass in the period preceding their diagnosis,
and often also as a consequence of treatment.
Similarly, we had no reliable measures of past infection with
Helicobacter pylori, which has been negatively associated with
gastro-oesophageal reflux and oesophageal adenocarcinoma
33
and has been implicated in suppressing appetite and body
weight
34
and thus might potentially confound the association
between BMI and oesophageal adenocarcinoma. We did ask
participants whether they had ever been clinically diagnosed
with this infection, noting that this would require a blood or
breath test, or endoscopy. In our sample, the self-reported
prevalence of clinical diagnosis for H pylori infection was 6.3%
among controls, 6.8% among oesophageal adenocarcinoma cases
and 8.5% among gastro-oesophageal adenocarcinoma cases,
considerably lower than the prevalence estimates of 30–40%
reported in recent population-based serological studies of
asymptomatic Australian adults.
35 36
Adjustment for this self-
reported measure made no difference to the risk estimates, and
was not included in the final models.
Although we cannot entirely exclude recall bias as a source of
error, several observations argue against differential reporting of
BMI as an explanation for our findings. First, risk estimates for
each measure of BMI were consistently higher for adenocarci-
nomas of the oesophagus than the gastro-oesophageal junction,
a specific pattern of risk unlikely to be due to biased recall by
study participants. Second, the overall association was specific
for adenocarcinomas but not SCCs (data not shown). This
suggests that the effect of BMI is not simply due to over-
reporting of body mass by all patients with ‘‘oesophageal
cancer’’.
Our participation rates were less than ideal, leading to
concerns about selection bias. The age and sex distribution of
the participating cases was similar to the distribution of all
potentially eligible cases notified to the Australian national
cancer statistics clearing house (2002); however, further details
of non-participating cases were not available from registries
owing to privacy laws. Risk estimates would be biased upwards
if the prevalence of the key exposures of interest (namely
obesity and gastro-oesophageal reflux) was lower among our
control group than the target population. We dealt with this
problem by comparing the BMI distribution in our control series
with those reported by the Australian National Health Survey
(NHS) conducted in 2004, a representative survey of the
Australian adult population. BMI was similarly distributed
among our controls and NHS participants. Moreover, we
compared our study BMI risk estimates with those derived
using models that imputed the NHS BMI distributions onto our
control series (manuscript under review). Risk estimates for the
effect of BMI were essentially unchanged by this procedure,
suggesting no appreciable bias due to a selected control sample.
The prevalence of at least weekly symptoms of reflux among
our population sample of controls (12% among men and 11%
among women) was similar to prevalence estimates from other
population surveys in Australia,
37
the UK
9
and Sweden.
38
We
therefore consider the likelihood of biased selection on the basis
of this symptom to be no greater than for previous studies.
Assuming our findings reflect true causal associations, the
question arises as to how obesity might cause oesophageal
adenocarcinoma. Increased reflux frequency remains one
plausible mechanism, since high BMI and anthropometric
measures of obesity have been associated with frequent reflux
symptoms,
89121439
as well as with asymptomatic acid reflux
and erosive oesophagitis.
40 41
Central adiposity is postulated to
promote acid reflux, possibly through increased intra-abdominal
pressure,
42
although data in support of a mechanical effect of
obesity are weak.
43
Other mechanisms through which obesity
might induce reflux have also been advanced.
44
Arguing against
the notion that obesity increases the risk of oesophageal
adenocarcinoma simply by inducing reflux was our finding
that the risk estimates associated with BMI were only modestly
attenuated by including measures of symptomatic reflux in
regression models. Moreover, we found that obesity remained a
highly significant risk factor even among people with no
reported history of reflux.
Might other factors have a role? Recent interest has focused
on the endocrine effects of adipose tissue and its potential role
in carcinogenesis. With obesity, there is generally an increase in
insulin production, which in turn leads to the synthesis of
insulin-like growth factor (IGF-I). Both these hormones can
stimulate cell proliferation and inhibit apoptosis—conditions
which are conducive to cancer development and for which there
is some evidence of an effect.
45
Fat cells also produce peptide hormones such as leptin,
adiponectin and resistin, collectively known as adipocytokines,
some of which have been shown to have mitogenic and
Oesophagus
178 Gut 2008;57:173–180. doi:10.1136/gut.2007.131375
on 11 August 2008 gut.bmj.comDownloaded from
angiogenic effects in a variety of tissues including the
oesophagus.
46 47
The role of leptin warrants further scrutiny,
as its expression is upregulated in wounds
48
and it has been
shown to promote repair of gastric ulcers
49
and skin wound
when applied systemically and topically.
50
One might speculate
that the higher levels of leptin among the obese may promote
proliferation of oesophageal epithelial cells, particularly when
inflamed. Whether adipocytokines enhance proliferation in
oesophageal tissues in the absence of inflammation is not
known, although such a mechanism would explain our finding
of higher risks of oesophageal adenocarcinoma cancer among
obese people without symptoms of reflux. An alternative
explanation is that obese people have higher rates of asympto-
matic reflux and oesophagitis, and that this phenomenon
underlies the observed association.
In summary, these data confirm that obesity independently
increases the risk of adenocarcinomas of the oesophagus, and to
a lesser extent, the gastro-oesophageal junction. From a clinical
perspective, these data raise the prospect that patients with
obesity and frequent symptomatic reflux are at especially
increased risk of adenocarcinoma. Understanding the mechan-
isms through which these exposures might cause cancer is the
focus of our continuing research.
Acknowledgements: We thank Harish Babu MD for his assistance with pathology
abstractions. This study was supported by the Queensland Cancer Fund and the
National Health and Medical Research Council (NHMRC) of Australia (Program No
199600). David Whiteman and Penelope Webb are supported by senior research
fellowships from the National Health and Medical Research Council of Australia and
Queensland Cancer Fund, respectively. Shahram Sadeghi and Nirmala Pandeya are
supported by PhD scholarships from the Ministry of Health and Medical Education of IR
Iran and the National Health and Medical Research Council of Australia, respectively.
The funding bodies played no role in the design or conduct of the study; the collection,
management, analysis, or interpretation of the data; or preparation, review or approval
of the manuscript.
Australian Capital Territory: Charles Mosse FRACS, Noel Tait FRACS
New South Wales: Chris Bambach FRACS, Andrew Biankan FRACS, Roy Brancatisano
FRACS, Max Coleman FRACS, Michael Cox FRACS, Stephen Deane FRACS, Gregory L.
Falk FRACS, James Gallagher FRACS, Mike Hollands FRACS, Tom Hugh FRACS, David
Hunt FRACS, John Jorgensen FRACS, Christopher Martin FRACS, Mark Richardson
FRACS, Garrett Smith FRACS, Ross Smith FRACS, David Storey FRACS
Queensland: John Avramovic FRACS, John Croese FRACP, Justin D’Arcy FRACS,
Stephen Fairley FRACP, John Hansen FRACS, John Masson FRACP, Les Nathanson
FRACS, Barry O’Loughlin FRACS, Leigh Rutherford FRACS, Richard Turner FRACS,
Morgan Windsor FRACS
South Australia: Justin Bessell FRACS, Peter Devitt FRACS, Glyn Jamieson FRACS,
David Watson FRACS
Victoria: Stephen Blamey FRACS, Alex Boussioutas FRACP, Richard Cade FRACS, Gary
Crosthwaite FRACS, Ian Faragher FRACS, John Gribbin FRACS, Geoff Hebbard FRACP,
George Kiroff FRACS, Bruce Mann FRACS, Bob Millar FRACS, Paul O’Brien FRACS,
Robert Thomas FRACS, Simon Wood FRACS
Western Australia: Steve Archer FRACS, Kingsley Faulkner FRACS, Jeff Hamdorf
FRACS
Competing interests: None.
REFERENCES
1. Blot WJ, Devesa SS, Kneller RW, et al. Rising incidence of adenocarcinoma of the
esophagus and gastric cardia. JAMA 1991;265:1287–9.
2. Lord RV, Law MG, Ward RL, et al. Rising incidence of oesophageal adenocarcinoma
in men in Australia. J Gastroenterol Hepatol 1998;13:356–62.
3. Wayman J, Forman D, Griffin SM. Monitoring the changing pattern of esophago-
gastric cancer: data from a UK regional cancer registry. Cancer Causes Control
2001;12:943–9.
4. Australian Institute of Health and Welfare. National Cancer Statistics Clearing
House, 2006.
5. Pohl H, Welch HG. The role of overdiagnosis and reclassification in the marked
increase of esophageal adenocarcinoma incidence. J Natl Cancer Inst 2005;97:142–
6.
6. Chow WH, Finkle WD, McLaughlin JK, et al. The relation of gastroesophageal reflux
disease and its treatment to adenocarcinomas of the esophagus and gastric cardia.
JAMA 1995;274:474–7.
7. Lagergren J, Bergstrom R, Lindgren A, et al. Symptomatic gastroesophageal reflux
as a risk factor for esophageal adenocarcinoma. N Engl J Med 1999;340:825–31.
8. Nilsson M, Johnsen R, Ye W, et al. Obesity and estrogen as risk factors for
gastroesophageal reflux symptoms. JAMA 2003;290:66–72.
9. Murray L, Johnston B, Lane A, et al. Relationship between body mass and gastro-
oesophageal reflux symptoms: the Bristol Helicobacter Project. Int J Epidemiol
2003;32:645–50.
10. Hampel H, Abraham NS, El-Serag HB. Meta-analysis: obesity and the risk for
gastroesophageal reflux disease and its complications. Ann Intern Med
2005;143:199–211.
11. El-Serag HB, Graham DY, Satia JA, et al. Obesity is an independent risk factor for
GERD symptoms and erosive esophagitis. Am J Gastroenterol 2005;100:1243–50.
12. Jacobson BC, Somers SC, Fuchs CS, et al. Body-mass index and symptoms of
gastroesophageal reflux in women. N Engl J Med 2006;354:2340–8.
13. El-Serag HB, Ergun GA, Pandolfino J, et al. Obesity increases oesophageal acid
exposure. Gut 2007;56:749–55.
14. Corley DA, Kubo A, Zhao W. Abdominal obesity, ethnicity and gastro-oesophageal
reflux symptoms. Gut 2007;56:756–62.
15. Lagergren J. Controversies surrounding body mass, reflux, and risk of oesophageal
adenocarcinoma. Lancet Oncol 2006;7:347–9.
16. Brown LM, Swanson CA, Gridley G, et al. Adenocarcinoma of the esophagus: role of
obesity and diet. J Natl Cancer Inst 1995;87:104–9.
17. Vaughan TL, Davis S, Kristal A, et al. Obesity, alcohol, and tobacco as risk factors for
cancers of the esophagus and gastric cardia: adenocarcinoma versus squamous cell
carcinoma. Cancer Epidemiol Biomarkers Prev 1995;4:85–92.
18. Chow WH, Blot WJ, Vaughan TL, et al. Body mass index and risk of
adenocarcinomas of the esophagus and gastric cardia. J Natl Cancer Inst
1998;90:150–5.
19. Lagergren J, Bergstrom R, Nyren O. Association between body mass and
adenocarcinoma of the esophagus and gastric cardia. Ann Intern Med
1999;130:883–90.
20. Kubo A, Corley DA. Body mass index and adenocarcinomas of the esophagus or
gastric cardia: a systematic review and meta-analysis. Cancer Epidemiol Biomarkers
Prev 2006;15:872–8.
21. Adami HO, Trichopoulos D. Obesity and mortality from cancer. N Engl J Med
2003;348:1623–4.
22. Calle EE, Rodriguez C, Walker-Thurmond K, et al. Overweight, obesity, and mortality
from cancer in a prospectively studied cohort of U.S. adults. N Engl J Med
2003;348:1625–38.
23. Calle EE, Kaaks R. Overweight, obesity and cancer: epidemiological evidence and
proposed mechanisms. Nat Rev Cancer 2004;4:579–91.
24. Jordan SJ, Green AC, Whiteman DC, et al. Risk factors for benign serous and
mucinous epithelial ovarian tumors. Obstet Gynecol 2007;109:647–54.
25. Spechler SJ, Dixon MF, Genta R, et al. Adenocarcinoma of the oesophago-gastric
junction. In: Hamilton SR, Aaltonen LA, eds. Pathology and genetics tumours of the
digestive system. WHO classification of tumours. Vol 2. UK: Lyon IARC Press, 2000.
26. Rothman KJ. Modern epidemiology. 1st ed. Boston: Little Brown and Co, 1986.
27. Andersson T, Alfredsson L, Kallberg H, et al. Calculating measures of biological
interaction. Eur J Epidemiol 2005;20:575–9.
28. Lagergren J, Bergstrom R, Nyren O. No relation between body mass and gastro-
oesophageal reflux symptoms in a Swedish population based study. Gut 2000;47:26–
9.
29. Smith KJ, O’Brien SM, Smithers BM, et al. Interactions among smoking, obesity, and
symptoms of acid reflux in Barrett’s esophagus. Cancer Epidemiol Biomarkers Prev
2005;14:2481–6.
30. Lagergren J, Ye W, Bergstrom R, et al. Utility of endoscopic screening for upper
gastrointestinal adenocarcinoma. JAMA 2000;284:961–2.
31. Akbartabartoori M, Lean ME, Hankey CR. Relationships between cigarette
smoking, body size and body shape. Int J Obes (Lond) 2005;29:236–43.
32. Lissner L, Bengtsson C, Lapidus L, et al. Smoking initiation and cessation in relation
to body fat distribution based on data from a study of Swedish women. Am J Public
Health 1992;82:273–5.
33. Chow WH, Blaser MJ, Blot WJ, et al. An inverse relation between cagA+ strains of
Helicobacter pylori infection and risk of esophageal and gastric cardia
adenocarcinoma. Cancer Res 1998;58:588–90.
34. Loffeld RJ. Helicobacter pylori, obesity and gastro-oesophageal reflux disease. Is
there a relation? A personal view. Neth J Med 2005;63:344–7.
35. Lin SK, Lambert JR, Nicholson L, et al. Prevalence of Helicobacter pylori in a
representative Anglo-Celtic population of urban Melbourne. J Gastroenterol Hepatol
1998;13:505–10.
36. Robertson MS, Cade JF, Savoia HF, et al. Helicobacter pylori infection in the
Australian community: current prevalence and lack of association with ABO blood
groups. Intern Med J 2003;33:163–7.
37. Talley NJ, Quan C, Jones MP, et al. Association of upper and lower gastrointestinal
tract symptoms with body mass index in an Australian cohort. Neurogastroenterol
Motil 2004;16:413–9.
38. Nilsson M, Johnsen R, Ye W, et al. Prevalence of gastro-oesophageal reflux
symptoms and the influence of age and sex. Scand J Gastroenterol 2004;39:1040–5.
39. Wu AH, Tseng CC, Bernstein L. Hiatal hernia, reflux symptoms, body size, and risk of
esophageal and gastric adenocarcinoma. Cancer 2003;98:940–8.
40. Ortiz V, Ponce M, Fernandez A, et al. Value of heartburn for diagnosing
gastroesophageal reflux disease in severely obese patients. Obesity 2006;14:696–
700.
Oesophagus
Gut 2008;57:173–180. doi:10.1136/gut.2007.131375 179
on 11 August 2008 gut.bmj.comDownloaded from
41. Ronkainen J, Aro P, Storskrubb T, et al. High prevalence of gastroesophageal reflux
symptoms and esophagitis with or without symptoms in the general adult Swedish
population: a Kalixanda study report. Scand J Gastroenterol 2005;40:275–85.
42. Nilsson M, Lagergren J. The relation between body mass and gastro-oesophageal
reflux. Best Pract Res Clin Gastroenterol 2004;18:1117–23.
43. El-Serag HB, Tran T, Richardson P, et al. Anthropometric correlates of intragastric
pressure. Scand J Gastroenterol 2006;41:887–91.
44. Nilsson M, Lundegardh G, Carling L, et al. Body mass and reflux oesophagitis: an
oestrogen-dependent association? Scand J Gastroenterol 2002;37:626–30.
45. Renehan AG, Zwahlen M, Minder C, et al. Insulin-like growth factor (IGF)-I, IGF
binding protein-3, and cancer risk: systematic review and meta-regression analysis.
Lancet 2004;363:1346–53.
46. Somasundar P, Riggs D, Jackson B, et al. Leptin stimulates esophageal
adenocarcinoma growth by nonapoptotic mechanisms. Am J Surg 2003;186:575–8.
47. Ogunwobi O, Mutungi G, Beales IL. Leptin stimulates proliferation and inhibits apoptosis
in Barrett’s esophageal adenocarcinoma cells by cyclooxygenase-2-dependent,
prostaglandin-E2-mediated transactivation of the epidermal growth factorreceptorand
c-Jun NH2-terminal kinase activation. Endocrinology 2006;147:4505–16.
48. Murad A, Nath AK, Cha ST, et al. Leptin is an autocrine/paracrine regulator of wound
healing. FASEB J 2003;17:1895–7.
49. Konturek PC, Brzozowski T, Sulekova Z, et al. Role of leptin in ulcer healing.
Eur J Pharmacol 2001;414:87–97.
50. Ring BD, Scully S, Davis CR, et al. Systemically and topically administered leptin both
accelerate wound healing in diabetic ob/ob mice. Endocrinology 2000;141:446–9.
Robin Spiller, editor
Obstructive jaundice following a
myocardial infarct
Clinical presentation
A 70-year-old man presented with a non-ST elevation myo-
cardial infarction. Physical examination, ECG and blood tests
including liver function tests were normal. Treatment with
aspirin, clopidrogel and enoxaparin was commenced.
The chest pain resolved. However, from the third day there
was an obstructive pattern in his liver function tests without
abdominal symptoms (bilirubin 238 mmol/l, alkaline phospha-
tase 480 IU/ml, aspartame transaminase 156 IU/ml). This
derangement coincided with a decrease in haemoglobin by
3 g/l. Given a recent diagnosis of prostatic carcinoma, a
differential diagnosis of pancreatic head mass, possibly of
metastatic or primary malignant aetiology, causing obstructive
jaundice was made on initial imaging.
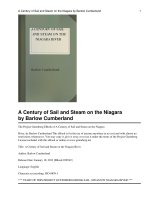
Multi-slice computed tomography (CT) illustrated calcifica-
tion within the pancreatic head, consistent with chronic
pancreatitis and a 6.5 cm mass was demonstrated within the
pancreatic head intimately related to the gastroduodenal artery,
with similar enhancement to that in the aorta (fig 1).
Question
What is your diagnosis and how would you manage this
condition?
See page 187 for answer.
J N Khan,
1
R Sanyal,
2
A Pallan,
1
J Ferrando,
1
J Ment,
1
S Roy-
Choudhury
1
1
Heart of England NHS Trust, Birmingham, UK;
2
Walsgrave Hospital, Coventry, UK
Correspondence to: Dr Shuvro H Roy-Choudhury, Heart of England NHS Foundation
Trust, Bordesley Green East, Birmingham B9 5SS, UK;
Competing interests: None.
Gut 2008;57:180. doi:10.1136/gut.2006.103804
Figure 1 Contrast enhanced multi-slice abdominal CT scan showing
the gastroduodenal artery (large arrow), with the 6.5 cm intimately
related enhancing mass (small arrows).
Editor’s quiz : GI snapshot
Oesophagus
180 Gut February 2008 Vol 57 No 2
on 11 August 2008 gut.bmj.comDownloaded from