Bóa cáo y học: "Review of Australian health economic evaluation – 245 interventions: what can we say about cost effectiveness" ppsx
Bạn đang xem bản rút gọn của tài liệu. Xem và tải ngay bản đầy đủ của tài liệu tại đây (277.9 KB, 12 trang )
BioMed Central
Page 1 of 12
(page number not for citation purposes)
Cost Effectiveness and Resource
Allocation
Open Access
Research
Review of Australian health economic evaluation – 245
interventions: what can we say about cost effectiveness?
Kim Dalziel
1
, Leonie Segal
1
and Duncan Mortimer*
1,2
Address:
1
Health Economics and Policy Group, Division of Health Sciences, University of South Australia, Adelaide, Australia and
2
Centre for
Health Economics, Monash University, Melbourne, Australia
Email: Kim Dalziel - ; Leonie Segal - ;
Duncan Mortimer* -
* Corresponding author
Abstract
Background: There is an increasing body of published cost-utility analyses of health interventions
which we sought to draw together to inform research and policy.
Methods: To achieve consistency in costing base and policy context, study scope was limited to
Australian-based cost-effectiveness analyses. Through a comprehensive literature review we
identified 245 health care interventions that met our study criteria.
Results: The median cost-effectiveness ratio was A$18,100 (~US$13,000) per QALY/DALY/LY
(quality adjusted life year gained or, disability adjusted life year averted or life year gained). Some
modalities tended to perform worse, such as vaccinations and diagnostics (median cost/QALY
$58,000 and $68,000 respectively), than others such as allied health, lifestyle, in-patient
interventions (median cost/QALY/DALY/LY all at ~A$9,000~US$6,500). Interventions addressing
some diseases such as diabetes and impaired glucose tolerance or alcohol and drug dependence
tended to perform well (median cost/QALY/DALY/LY < A$3,700, < US$5,000). Interventions
targeting younger persons < 25 years (median cost/QALY/DALY/LY < A$41,200) tended to
perform less well than those targeting adults > 25 years (median cost/QALY/DALY/LY <
A$16,000). However, there was also substantial variation in the cost effectiveness of individual
interventions within and across all categories.
Conclusion: For any given condition, modality or setting there are likely to be examples of
interventions that are cost effective and cost ineffective. It will be important for decision makers
to make decisions based on the individual merits of an intervention rather than rely on broad
generalisations. Further evaluation is warranted to address gaps in the literature and to ensure that
evaluations are performed in areas with greatest potential benefit.
Background
Because resources are limited not all potentially beneficial
services can be funded. Choices must be made in allocat-
ing scarce resources. Economic evaluation can help
inform resource allocation choices by comparing costs
and consequences of two or more alternatives. Compari-
sons between interventions will be more robust where
they are country specific, at least in terms of input costs,
which differ considerably between countries. To date Aus-
tralian economic evaluations have not been systemati-
Published: 20 May 2008
Cost Effectiveness and Resource Allocation 2008, 6:9 doi:10.1186/1478-7547-6-9
Received: 1 November 2007
Accepted: 20 May 2008
This article is available from: />© 2008 Dalziel et al; licensee BioMed Central Ltd.
This is an Open Access article distributed under the terms of the Creative Commons Attribution License ( />),
which permits unrestricted use, distribution, and reproduction in any medium, provided the original work is properly cited.
Cost Effectiveness and Resource Allocation 2008, 6:9 />Page 2 of 12
(page number not for citation purposes)
cally described, appraised or explored, except for
decisions of the PBAC (Pharmaceutical Benefits Advisory
Council) between 1991 to 1996[1]. However, given con-
fidentiality of data, the performance of specific interven-
tions was not reported. There is now a substantial body of
published health economic evaluations in Australia that
have used 'final and global' measures of performance (life
years, quality adjusted life years and disability adjusted
life years) which allows comparison across health care
interventions.
The aim of the current paper is to describe and explore
Australian published economic evaluations and to ana-
lyse the distribution of published cost-effectiveness ratios.
This analysis will determine whether there is any identifi-
able pattern in published cost-effectiveness ratios. The
results will potentially to assist policy makers with
resource allocation decisions and will identify gaps in the
types of interventions evaluated.
Methods
Searching for cost-effectiveness studies
The Medline OVID database from 1966 to present was
searched in April 2005 for relevant studies using key
words for "cost effectiveness" and "economic evaluation"
combined with the key word "Australia". In addition web-
sites of Australian health economics centres and govern-
ment health departments were searched [See Additional
file 1]. Key words such as "cost", "economic" and "evalu-
ation" were used separately. Bibliographies of the articles
reviewed were searched for further relevant articles, and a
key author search was conducted for authors identified
with multiple relevant publications. No restrictions were
made by year of publication, and all publicly available
reports and papers were eligible for inclusion.
Selection
Studies of economic analysis of lifesaving or quality
enhancing "health" interventions were eligible for inclu-
sion, defined as broadly fitting within the context of the
health care system. An initial selection of potentially rele-
vant articles was made by one reviewer (KD). This selec-
tion was broad and overly inclusively.
The following inclusion criteria were then applied by two
reviewers (KD and DM) independently to each full text
article initially identified as potentially relevant. Consen-
sus was reached by discussion.
• Resources were estimated in Australian dollars.
• The economic evaluation presented as cost per LY saved,
death averted, QALY gained or DALY averted, or this
could be simply calculated from the figures provided.
• The article was published in English.
• The article was not a duplicate publication. The most
complete or recent work by the authors was selected for
inclusion with supplementary information retrieved from
other reports. Publication on similar interventions by dif-
ferent authors did not class as duplicate.
• The study was primary research. Review articles citing
the work of others were excluded, although the reference
lists were searched for additional relevant publications.
Validity assessment
An assessment of the quality of the economic evaluations
was performed by one reviewer (KD) following study
inclusion. The quality criteria reflect items taken from a
framework for quality of cost-effectiveness models devel-
oped by Sculpher et al[2]. This instrument was chosen as
it incorporates economic modelling as well as evaluation
and is therefore broader in scope than other quality
appraisal checklists that only apply to economic evalua-
tion. The Sculpher framework provides a list of dimen-
sions of a quality economic model and what constitutes
good practice. In addition a list of questions is provided in
order to enable the framework to be used as a practice tool
for critical appraisal. There are a number of dimensions to
the framework including structure, disease states, options
(comparators), time horizon, cycle length, data identifica-
tion, data incorporation, internal and external consist-
ency. The items deemed most appropriate for our brief
appraisal were taken from the categories 'options', 'data
identification' and 'data incorporation'.
The strength of underlying evidence was rated strong (RCT
or meta-analysis) or limited (not RCT or meta-analysis).
The comparator chosen for the evaluation was rated either
as appropriate (described and justified) or inappropriate
(not described or justified). Measurement of costs was
rated as appropriate (marginal, clearly described, sources
of price and quantity data cited) or inappropriate. Each
evaluation was rated as having sensitivity analysis per-
formed or not performed.
Data abstraction
Where articles included analysis of more than one inter-
vention, data were extracted for each separate interven-
tion. Data abstraction was performed by one reviewer
(KD) with checking of key variables by a second reviewer
(LS). The following types of variables were extracted: the
characteristics of the target disease and patients, details of
the intervention, nature of publication and study method-
ology, and estimated performance. Policy relevant varia-
bles, including funding status were separately ascertained
(Table 1). These variables were chosen for their possible
relationship to cost effectiveness, based on the author's
Cost Effectiveness and Resource Allocation 2008, 6:9 />Page 3 of 12
(page number not for citation purposes)
knowledge of the literature and their experiences with pri-
ority setting exercises.
Data synthesis
Cost per LY/QALY/DALY estimates were reviewed and
recalculated where necessary to ensure each referred to
marginal costs and benefits. Estimates were standardised
by translating values into June 2005 estimates using the
health component of the CPI[3]. If a study reported a
range for the cost-effectiveness results, the study was
examined to determine if different estimates related to dif-
ferent interventions and/or distinct target populations. If
this was the case, the cost-effectiveness ratio for each dis-
tinct population and/or intervention was extracted. How-
ever where such sub-groups were the result of post hoc
analysis not consistent with delivery of the intervention a
standardised figure across all groups was calculated using
Australian population data (eg proportion male/female in
target age group). If the range simply represented upper
and lower limits from sensitivity analyses, a central esti-
mate was used where reported or calculated as the mean if
not.
In the event that a reference year was not reported for
costs, we used the publication year minus two to reflect
the usual delay in publishing original research. Categori-
sation of the type of intervention, type of patients and
results was possible for all studies included in the review.
The only sources of missing data were discount rate, time
horizon and length of intervention benefit which were
purely descriptive variables.
Analysis
Data were described using medians and interquartile
ranges for continuous data and proportions for categori-
cal data. The pattern of cost-effectiveness results across the
245 interventions was explored through a combination of
descriptive and regression analyses. Ordinary least squares
regression was undertaken to identify variables that might
explain variation in the cost per LY/QALY/DALY esti-
mates. Ordered logit regression was undertaken to iden-
tify variables that might explain variation in the cost per
LY/QALY/DALY group. All regressions adjusted for intra-
cluster correlation present in the data because data on
multiple interventions were drawn from many of the
papers included in our review. We used the robust Huber/
White sandwich estimator to adjust population-average
models for intra-cluster correlation, yielding robust stand-
ard errors suitable for calculating confidence intervals
around estimated regression coefficients[4].
All potentially relevant intervention and publication char-
acteristics listed in Table 2 were initially included in the
regression and retained on the basis of their contribution
to the regression as evaluated by t- and F-tests (enter p ≤
0.05) for individual and joint significance, with care taken
to ensure stability in the magnitude and direction of the
beta coefficients when adding or dropping a potentially
relevant variable. Collinearity between included variables
and potentially relevant variables excluded from the
regression was investigated using standard diagnostics
and by methodically entering, removing and re-entering
combinations of variables. Results were confirmed by
examining outputs from backwards and forwards step-
wise regression analyses as evaluated by the probability of
F (enter p ≤ 0.05, remove p ≥ 0.10).
Results
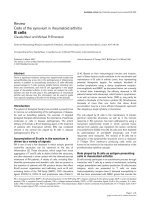
Trial flow
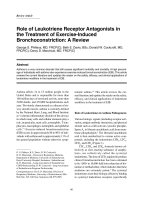
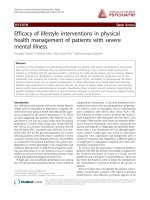
The Medline search lead to 912 results, of which 42
(4.6%) were identified as potentially relevant through
screening titles and abstracts. An additional 11 papers or
reports were identified through key author searches, 9
through reviewing bibliographies of identified articles
and 52 through the website searches. A total of 114 full
text documents were examined for inclusion in this review
(Figure 1 describes the exclusion process) with a total of
77 (68%) included.
Descriptive results
Of the 77 included documents, sufficient information was
available to calculate cost per QALY, DALY or LY estimates
Table 1: Details of variables extracted
Type of variables Variables extracted (See also table 3)
Nature of Publication Type of publication, Source of publication, Type of journal.
Target of intervention (eg Patient characteristics) DRG, Age, General vs. specific population, Ability to reduce own risk of disease/death (eg
obesity reduction), Condition caused by own behaviour (eg smoking related)
Intervention characteristics Year, Type of program (medical vs lifestyle), Prevention stage, Intervention objective (eg
treatment, diagnosis, screening), Modality (pharmaceutical, primary/specialist medical care,
community/media/education, hospital inpatient, vaccination, allied health, other).
Methodology Type of evidence, Level of evidence, Economic perspective, Type of evaluation, Discount rate,
Time horizon for model, Duration of benefit for model, Appropriateness of comparator,
Appropriateness of cost measurement, Use of sensitivity analysis.
Cost effectiveness Cost per LY/QALY/DALY, Intervention dominated or dominant.
Cost Effectiveness and Resource Allocation 2008, 6:9 />Page 4 of 12
(page number not for citation purposes)
Table 2: Descriptive statistics of the 245 interventions
No. Interventions (%)Total 245
Patient/disease characteristics
AR-DRGs Musculoskeletal and connective tissue 33 (13)
Mental diseases and disorders 32 (13)
Alcohol or drug use 29 (12)
Circulatory system 22 (9)
Endocrine nutritional and metabolic disorder/disease 20 (8)
Infectious and parasitic diseases 20 (8)
Other 89 (36)
Target Age Children aged 0 to 14 years 34 (14)
Young adults age 14 to 25 years 5 (2)
Working age adults 25 to 65 years 14 (6)
Elderly aged 65+ years 20 (8)
Children and young adults aged 0 to 25 years 2 (1)
Young adults and adults aged 14 to 65 years 63 (26)
Adults and elderly aged 25 to 65 plus years 92 (38)
All 11 (5)
Mixture of the above groups 4 (2)
Target population Specific 200 (82)
General population 45 (18)
Ability to reduce own risk To some extent 123 (50)
No 122 (50)
Condition caused by patients' own behaviour To some extent 127 (52)
No 118 (48)
Intervention details
Type Medical 177 (72)
Lifestyle 68 (28)
Objective Treatment 119 (49)
Prevention 78 (32)
Screening 33 (14)
Diagnosis 7 (3)
Combination 8 (3)
Prevention stage Primary (completely avert disease) 78 (32)
Secondary (slow/halt progression of disease) 119 (49)
Tertiary (limit disability after harm) 48 (20)
Modality Pharmaceutical 52 (21)
Primary medical care or specialist care 65 (27)
Community/media/education 39 (16)
Hospital inpatient 26 (11)
Vaccination 17 (7)
Allied health 29 (12)
Combination of modalities 9 (4)
Other 8 (3)
Nature of publication & study methodology
Cost Effectiveness and Resource Allocation 2008, 6:9 />Page 5 of 12
(page number not for citation purposes)
Year of publication Median (range) 2002 (1989 to 2005)
Strength of evidence Strong-RCT/meta-analysis 132 (54)
Limited 113 (46)
Where published Peer reviewed journal 185 (76)
Government report 18 (7)
Other peer-reviewed report 26 (11)
Other non peer reviewed report 16 (7)
Publication type General medicine 52 (21)
Specialist medicine 85 (35)
Health economics/policy/HTA/public health 108 (44)
Perspective Health system 212 (87)
Societal 33 (14)
Measure of Outcome Life year 79 (32)
QALY 119 (49)
DALY 46 (19)
HYE 1 (1)
Discount rate 0% 27 (13)
3% 22 (10)
5% 190 (78)
Missing 12 (6)
Time horizon of the model in years Median 15
Interquartile range 1 to 25
Missing 89 (36)
Duration of benefit in years Median 4
Interquartile range 1 to 6
Missing 81 (33)
Downstream costs/savings Included 140 (57)
Quality
Q-Comparator Appropriate 215 (88)
Q-Costs Appropriate (marginal and clear) 185 (76)
Q-Sensitivity analysis Performed 239 (98)
Q-Overall Met all three requirements above 173 (71)
Cost effectiveness
More effective but more costly 214 (87)
Median $19,017
Interquartile range $5,997 to $45,670
Dominated 11 (5)
Dominant 20 (8)
Funding & implementation
Funding status Fully funded 87 (35)
Partially funded 75 (31)
Not funded 83 (34)
Patients required to make contribution to costs Yes 178 (73)
Table 2: Descriptive statistics of the 245 interventions (Continued)
Cost Effectiveness and Resource Allocation 2008, 6:9 />Page 6 of 12
(page number not for citation purposes)
for 245 interventions. Table 2 summarises the patient/dis-
ease characteristics, intervention details, methodology,
quality and implications related to these 245 interven-
tions.
Cost effectiveness
For studies reporting LYs, the median value was A$18,720
per LY gained and for those reporting QALYs or DALYs,
the median value was A$17,830 per QALY/DALY. The
median economic performance using QALYs/DALYs
where available or LYs otherwise across all 245 interven-
tions was A$18,100 per LY/QALY/DALY. Eleven interven-
tions (5%) were more costly and less effective than their
comparators and were therefore dominated, 21 interven-
tions (8%) were both more effective and cheaper than
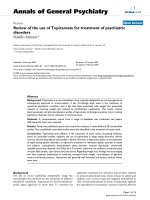
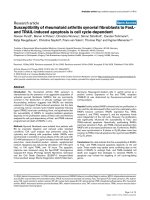
their comparator and thus dominant. Figure 2 illustrates
the distribution of incremental cost per LY/QALY/DALY
ratios. A large number of interventions (n = 91, 37%)
reported ICERS that were less than A$10,000 per LY/
QALY/DALY, (including the 8% that were dominant).
One hundred and forty-six interventions (60%) reported
ICERs that were less than A$25,000 per LY/QALY/DALY.
A further 41 interventions (17%) were reported with an
incremental cost of greater than A$100,000 per LY/QALY/
DALY (including the 5% that were dominated).
Table 3 presents the median, 25
th
and 75
th
percentile cost-
effectiveness ratio of each category and reports statistical
significance. Statistically significantly higher median
incremental cost-effectiveness ratios (ICERs) (performed
worse) were found for interventions targeted at children/
youth compared to adults, for medical interventions com-
pared with lifestyle interventions, vaccinations compared
to all other modalities, evaluations where downstream
cost impacts were not included. In relation to quality var-
iables, the small number of evaluations that did not use
an appropriate comparator and did not meet minimum
standards of quality performed better. Evaluations based
on strong quality evidence (strength of evidence) with
regards to treatment effect were associated with similar
median cost-effectiveness estimates as evaluations with
limited quality evidence. Those that were associated with
statistically significantly lower median ICERs, included
the following:
• non-medical interventions (allied health community,
media, education) compared to medical (physician con-
sult, pharmaceutical, in-patient, vaccinations),
• treatment interventions compared to diagnosis/screen-
ing/prevention,
• interventions where the individual was able to reduce
their own risk of disease or injury,
• interventions where the condition was cause by patients'
own behaviour, and
• interventions that were partially funded (some govern-
ment subsidy but not to meet all clinical need) rather than
fully or not funded all.
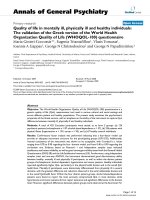
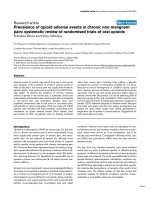
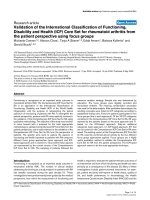
Figures 3, 4 and 5 illustrate results for the variables modal-
ity, objective and type of disease (DRG). Diagnostic tests
were associated with higher cost-effectiveness ratios and
greater variation than were screening, treatment and pre-
vention. Because there were small numbers of interven-
tions in some DRG groups, we have reported on the 6
DRG groups containing a sufficient number of interven-
tions for meaningful between-group comparisons. The
cost-effectiveness ratios varied across DRG groups with
the 'alcohol and drug use' and 'metabolic disease' catego-
ries having relatively little variation around a particularly
low median cost-effectiveness ratio, the 'mental disease/
disorder' group having the highest median cost-effective-
ness ratio and the 'musculoskeletal' and 'infection groups'
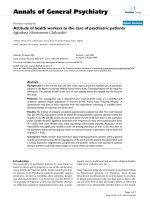
having the most variability. Examining modality; pharma-
ceuticals and vaccinations had higher and more varied
cost-effectiveness ratios than other modalities, whilst
allied health interventions and inpatient care had the low-
est median cost-effectiveness ratios.
That said, the extent of variation in the data is such that
there were examples of highly cost-effective and cost-inef-
fective care within most categories.
Description of study flowFigure 1
Description of study flow.
Full text articles reviewed (n= 114)
-Reports (n=32)
-Published papers (n=77)
-Unpublished papers (n=5)
Studies excluded (n=37)
-Not Australian (n=5)
-LY/QALY/DALYs couldn’t be
derived (n=15)
-Duplicate publication (n=5)
-Review article (n= 12)
Studies included in
the systematic
review
(n= 77)
Cost Effectiveness and Resource Allocation 2008, 6:9 />Page 7 of 12
(page number not for citation purposes)
Exploring determinants of cost effectiveness
Linear regression analysis using the enter method was
undertaken to identify variables from those listed in Table
2 that might explain variation in the cost per LY/QALY/
DALY estimates. The intra-cluster correlation coefficient
for cost per LY/QALY/DALY (ICC = 0.332, 95%CI: 0.17,
0.49) suggested that some adjustment should be made for
clustering by paper in this analysis. Table 4 summarises
parameter estimates, model fit and individual significance
of included variables from the Huber/White sandwich
estimator. MODALITY 1 (pharmaceutical = 1 versus all
else = 0), REDUCE RISK OF DEATH/DISEASE (yes = 1 ver-
sus no = 0), AGE (25 to 65 years = 1 versus all else = 0),
PATIENT CONTRIBUTION TO COSTS (yes = 1 versus no
= 0) and Q-SENSITIVITY (sensitivity analysis performed =
1 versus not = 0) were significant predictors but explained
just 1.5% of variance in economic performance as meas-
ured by cost per LY/QALY/DALY. MODALITY 1 was the
most important independent variable based on the size of
the beta coefficient (β = -129,593, p = 0.038). Ramsey's
Reset Test for the presence of omitted variables in the
residuals was insignificant (F(3,236) = 0.18, p = 0.909),
suggesting that the majority of between-intervention vari-
ation in cost per LY/QALY/DALY ratios is random.
Interpretation of the parameter estimates is straightfor-
ward. Pharmaceuticals (compared to non-pharmaceuti-
cals) and interventions primarily benefiting persons aged
between 25 and 65 years would generally have a lower
cost per LY/QALY/DALY than an intervention benefiting
older or younger age groups. The quality of evaluation
also made a significant contribution to the regression such
that a failure to conduct sensitivity analysis was associated
with a lower cost per LY/QALY/DALY ratio. Interventions
targeting persons able to reduce their own risk of death/
disease and interventions that are partially funded out of
patient contributions would also generally have a higher
cost per LY/QALY/DALY than otherwise. It is, however,
important to note that the regression explains only a small
proportion of the overall variance in cost per LY/QALY/
DALY group.
We also undertook an ordered logit regression to identify
variables from those listed in Table 2 that might explain
variation in economic performance expressed in terms of
cost per LY/QALY/DALY group. The intra-cluster correla-
tion coefficient for cost per LY/QALY/DALY group (ICC =
0.392, 95%CI: 0.23, 0.56) suggested that some adjust-
ment should be made for clustering by paper in this anal-
Number of interventions in each cost per LY/QALY/DALY group category (A$)Figure 2
Number of interventions in each cost per LY/QALY/DALY group category (A$).
91
55
37
18
3
24
17
0
20
40
60
80
100
$0* to $10,000 $10,000 to
$25,000
$25,000 to
$50,000
$50,000 to
$75,000
$75,000 to
$100,000
$100,000 to
$500,000
>$500,000†
Combined cost per LY/QALY/DALY
*Includes the 20 interventions that were dominant
†Includes the 8 interventions that were dominated
Count (n=245)
Cost Effectiveness and Resource Allocation 2008, 6:9 />Page 8 of 12
(page number not for citation purposes)
Table 3: Cost per QALY/DALY/HYE by patient/disease characteristics, intervention characteristics, methodological attributes, quality of study, funding of intervention
Variable name Categories ICER χ
2
, p-value
a
25
th
percentile 50
th
percentile
(median)
75
th
percentile
Target population General population $8,798 $20,449 $150,496
Specific (targeted high risk group) $2,392 $17,220 $45,068 2.446, 0.118
Age group 0 to 25 years $11,586 $41,195 $149,581
> 25 years $2,370 $15,927 $42,801 8.903, 0.003
Type of intervention Medical eg physician consult, pharmaceuticals, vaccinations, diagnostic tests, inpatient visits $5,946 $21,898 $57,363 8.247, 0.004
Lifestyle eg advice to alter diet/physical activity $1,678 $10,015 $24,920
Modality1 Pharmaceutical $11,781 $26,871 $53,986
All else (primary/specialist care, vaccination, allied health, community/media/education, inpatient) $2,232 $15,270 $44,558 2.787, 0.095
Modality2 Allied health, community/media/education $1,899 $9,591 $31,749 4.609, 0.032
All else $5,507 $20,449 $57,363
Vaccination Vaccination $12,625 $56,408 $156,400
All else $2,642 $17,827 $44,711 4.310, 0.038
Objective of intervention Treatment (eg cox2 inhibiters to ameliorate symptoms of osteoarthritis) $2,045 $14,161 $38,620 2.275, 0.131
All else (prevention, screening, diagnosis, combination) $4,674 $20,650 $58,817
Disease stage 1) Treatments designed to completely avert disease/injury or slow, halt or reverse progression of disease/injury
(primary and secondary prevention)
$2,514 $17,827 $43,805 2.534, 0.111
2) Treatments designed to limit disability after harm has occurred (tertiary prevention) $6,048 $19,310 $133,284
Ability to reduce own risk of disease/injury To some extent (eg heart disease) $1,671 $13,778 $32,644
No $7,679 $25,747 $111,031 14.723, < 0.001
Condition caused by patients' own behaviour To some extent (eg liver cirrhosis) $1,664 $13,311 $25,894
No $10,299 $29,609 $100,871 24.001, < 0.001
Year Pre-1993
b
$1,698 $6,259 $97,213
1993
†
to 1997
c
$11,367 $34,820 $81,629
Post-1997
c
$3,436 $17,616 $43,769 3.177, 0.204
Strength of evidence Strong – RCT and/or meta-analysis $3,524 $18,282 $44,794
Limited – other study design $2,356 $18,039 $56,608 0.072, 0.788
Perspective Health system $2,642 $17,613 $46,738
Societal $8,122 $20,165 $75,116 1.335, 0.248
Outcome Life year $18,724
QALY/DALY/HYE $17,827 0.080, 0.777
Discount rate < 5% $7,981 $25,747 $43,761
= 5% $2,407 $15,553 $54,028 0.436, 0.509
Downstream costs/savings Included $1,846 $13,871 $40,658
Not $6,897 $21,405 $59,317 3.866, 0.049
Q-Comparator Appropriate $6,437 $20,891 $58,318
Not $983 $2,257 $6,409 27.392, < 0.001
Q-Costs Appropriate (marginal and clear) $3,802 $21,885 $54,483
Not $2,045 $12,706 $25,082 3.554, 0.059
Q-Sensitivity Performed $3,189 $18,360
$51,583
Not $1,695 $10.895
$30,736 0.756, 0.385
Q-Overall Adequate $4,406 $22,437
$56,395
Not $2,221 $14,082
$22,887 5.111, 0.024
Funding status Fully funded $5,735 $20,165
$53,558
Partially funded $1,358 $9,011
$35,429 10.870, 0.004
Not funded $6,351 $20,850
$97,378
Patients required to contribute to costs Yes (eg co-payment for pharmaceuticals) $3,789 $18,724
$43,769 0.035, 0.852
No (eg immunisations provided free of charge) $7,981 $15,733
$110,806
a) Statistical significance was assessed using the median value and the Kruskall-Wallace H test for independent samples, all degrees of freedom were equal to one with the exception of the test for year of publication where df = 2, statistically
significant results are highlighted in bold
b) From January 1993, the PBAC required to take into account cost effectiveness when making recommendations for listing.
c) Establishment of the Medical Services Advisory Committee (MSAC) in 1998.
Cost Effectiveness and Resource Allocation 2008, 6:9 />Page 9 of 12
(page number not for citation purposes)
ysis. Table 5 summarises parameter estimates, model fit
and individual significance of included variables from the
Huber/White sandwich estimator. TARGET (general pop-
ulation = 1 versus specific = 0), DISEASE STAGE (limit dis-
ability after harm has occurred = 1 versus avert, slow or
halt disease or injury = 0), CAUSED BY (patient's own
behaviour contributed to condition = 1 verus not = 0)
DOWNSTREAM (downstream costs/savings = 1 included
versus not = 0), NOT FUNDED (not funded = 1 versus
fully or partially funded = 0) and Q-OVERALL (adequate
comparator, costs and sensitivity analysis = 1 versus not =
0) were significant predictors but explained just 8.1% of
variance in economic performance as expressed in terms
of cost per LY/QALY/DALY group. CAUSED BY was the
most important independent variable based on the size of
the beta coefficient (1.4, P < 0.001).
Discussion & conclusion
Through this study, data are now available on the eco-
nomic performance, expressed in Australian costs, of a
wide range of interventions that address different health
problems, using alternative modalities and intervening at
various stages in disease development. The identification
of a large number of interventions (37%) reported at less
than A$10,000 per LY/QALY/DALY (including 8% that
were dominant), which is below any putative funding
threshold is important in itself. It raises issues about the
relationship between cost effectiveness and funding deci-
sions and the appropriateness of current funding thresh-
olds. These matters are explored elsewhere[5].
We identified some interesting findings by category, for
example that interventions targeted at children were gen-
erally less cost-effective than those targeting adults. This is
perhaps not surprisingly, especially in relation to chronic
disease prevention where benefits are typically delayed at
least into middle age. Similarly, 'population approaches'
were not found to be more cost effective than more tar-
geted approaches, which may reflect very large differences
in effectiveness. It would be interesting to explore the
especially good and especially poor performance of some
classes of intervention; such as the poor performance of
diagnostics and vaccinations or the favourable perform-
ance of allied health and lifestyle interventions and those
addressing diabetes and drug/alcohol abuse. That said cat-
egory averages should be interpreted with care due to the
identified wide variation in cost effectiveness with no
'magic bullet' answers to resource allocation. In terms of
policy decision it would be best to assess each potential
intervention on its own merits rather than rely on broad
generalisations [6-10].
We also note that this is the first review of publicly availa-
ble Australian economic evaluations, which provides val-
uable information to guide policy and research, but also
highlights the continued need for improvement in quality
of economic evaluation and transparency. This type of
exercise, summarising the cost effectiveness of different
interventions and subgroups has been proposed as a use-
ful priority setting task [11], with precedents in the United
States[12,13]. This review, in summarising all the pub-
lished Australian economic evaluations also provides a
platform for investigating where evaluations have been
targeted and what this says about implicit priorities. It
also allows an exploration of the distribution of cost-effec-
tiveness ratios relative to funding thresholds and an anal-
ysis of the quality of evaluations. From this work we can
for instance map the areas subject to economic evaluation
in Australia against the existing burden of disease, and
Distribution of cost per LY/QALY/DALY by modality (A$)Figure 4
Distribution of cost per LY/QALY/DALY by modality (A$).
vaccinationpharmaceuticalallied healthcommunity/medi
a/education
inpatientprimary
care/specialist
medical care
$200,000
$180,000
$160,000
$140,000
$120,000
$100,000
$80,000
$60,000
$40,000
$20,000
$0
Distribution of cost per LY/QALY/DALY by selected major diagnostic groups (A$)Figure 3
Distribution of cost per LY/QALY/DALY by selected major
diagnostic groups (A$).
Infection and
parasites
Metabolic
disease and
endocrine
Alcohol and
drug use
Mental disease
and disorders
MusculoskeletalCirculatory
system
$200,000
$180,000
$160,000
$140,000
$120,000
$100,000
$80,000
$60,000
$40,000
$20,000
$0
Cost Effectiveness and Resource Allocation 2008, 6:9 />Page 10 of 12
(page number not for citation purposes)
assess the scope of coverage of modalities and delivery set-
tings to check for alignment of research priorities. In order
to achieve system wide allocative efficiency in health care,
information is required across a broad range of interven-
tions, considering target diseases, age groups, disease
stage, modality and delivery settings.
The limitations of this review include a reliance on pub-
licly available evaluation reports. While it is possible that
some studies were missed through our original search
focus on Medline, a later search of the HEED (NHS Eco-
nomic Evaluation Database, Cochrane Library) database
using the same search terms identified no additional stud-
ies.
With regards to quality, this review has inherited the qual-
ity of the original work, which we have attempted to
describe. Interestingly, the pattern of cost effectiveness of
interventions where evaluations were based on limited
non-RCT evidence did not differ from those based on
stronger RCT evidence. There is no reason to presume that
potential biases will systematically impact on cost-effec-
tiveness results.
A significant limitation of this work is that the economic
evaluation methods varied significantly between interven-
tions thus impacting on the comparisons made. This is
illustrated in identified differences in discounting, per-
spective, time horizons, choice of comparators and
strength of underlying evidence. The strength of this work
therefore lies in the rich description of existing evalua-
tions. Ideally all outcome measures would be identical to
assist with comparisons. However, we would contend that
there is enough common ground between the outcome
measures QALY, DALY and LY for cost-effectiveness ratios
to be sensibly compared. Evaluations reporting cost per
LYs gained may have generally focused on length of life
because quality of life was not expected to vary greatly rel-
ative to the impact on mortality. Despite differences in the
concept of 'health' underlying adjustments for morbidity
using the QALY or the DALY, these do include both mor-
tality and morbidity effects. However, we acknowledge
that this is a potential source of error. We were limited in
that study resources only permitted one person to perform
data extraction of variables. This is unlikely to have lead to
bias against single interventions or group of interventions,
but may have involved a particular interpretation of vari-
ables extracted across all studies.
The list of interventions and associated cost-effectiveness
ratios is reported [See Additional file 2](the authors
would be pleased to provide a copy of the full database on
request). However, the use of these cost-effectiveness
results as a strict league table was not the intended pur-
pose of this exercise; rather this work was intended as a
broader information resource for research and policy. The
review is not a complete priority setting tool as it does not
include all potentially important interventions and in that
context, methodological differences between studies that
we have drawn on are important.
Relation to previous research
The cost effectiveness of Australian Pharmaceuticals has
been previously reported in a review of PBAC (Pharma-
ceutical Benefits Advisory Council) decision making from
1991 to 1996[1]. Twenty-six submissions were analysed
with a median cost per LY of A$43,550 ($1998/1999)
which is higher than the median estimate for pharmaceu-
Distribution of cost per LY/QALY/DALY by objective of intervention (A$)Figure 5
Distribution of cost per LY/QALY/DALY by objective of
intervention (A$).
DiagnosisScreeningPreventionTreatment
$200,000
$180,000
$160,000
$140,000
$120,000
$100,000
$80,000
$60,000
$40,000
$20,000
$0
Table 4: Parameter estimates and model fit for OLS regression on cost per LY/QALY/DALY
Predictor β Robust SE t Sig. R
2
(Constant) 160,830 99,591 1.61 0.111 -
AGE -211,012 40,081 -3.04 0.003 0.0035
Q-SENSITIVITY -108,172 51,011 -2.12 0.037 0.0043
MODALITY1 -129,593 58,881 -2.20 0.031 0.0071
REDUCE RISK^ 125,527 59,489 2.11 0.038 0.0101
PATIENT CONTRIBUTION^ 106,676 64,718 1.65 0.104 0.0150
^Jointly significant at 0.05 level (F(2, 73) = 5.70, p = 0.005).
Cost Effectiveness and Resource Allocation 2008, 6:9 />Page 11 of 12
(page number not for citation purposes)
ticals reported here of $A22,000 ($2005). The interven-
tions were all drawn from submission by the
pharmaceutical companies to the PBAC. Companies have
a vested interest in these evaluations which are used both
to inform whether a drug will be listed on the PBS (Phar-
maceutical Benefits Schedule) and subsidized by govern-
ment and the approved price. This creates an incentive to
report a cost/LY just below the apparent funding thresh-
old, which on the basis of funding decisions would seem
to lie within the range of $A40,00 to $A70,000/LY or/
QALY[1]. Our sample of pharmaceuticals was also larger
than the previous sample. However, it is also true that the
cost-effectiveness profile will depend on the actual list of
interventions included, with individual results also
impacted by any 'agendas' of the researchers. For this rea-
son our review was limited to reports in the public
domain.
In the US a large scale review exercise was undertaken of
500 life saving interventions across the areas of health,
transport and environment[14]. Tengs et al[14] reported a
median medical intervention cost of 1993 US$19,000 per
life year, with wide variation, which is not dissimilar to
our median estimate of A$18,100 (US$15,400 based on
exchange rates 30 June 2007), even allowing inflation to
current values, given the cost difference between the US
and Australian health care systems. Tengs et al[14]
reported a lower cost-effectiveness ratio for primary pre-
vention medical interventions of US$5,000 compared to
US$23,000 for secondary and US$22,000 for tertiary pre-
vention. This compares with our estimates of A$14,900
(US$11,100) for primary prevention, A$18,200
(US$13,500) for secondary and A$28,800 (US$21,400)
for tertiary prevention, using the same definitions (note
that dollars are standardised to 2005 for our work but to
1993 for the Tengs et al[14] review).
A more recent review was conducted of cost-utility analy-
ses in the United States (494 studies and 1433 cost-effec-
tiveness ratios)[12,13,15]. The results of this review are
also comparable with a median ICER of US$20,133 (with
dollar estimates taken from studies covering 1976 to 2001
– unadjusted and non-standardised).
Published cost-effectiveness results may reflect the
research interests or priorities of researchers or industry,
the visibility of certain diseases, the strength of advocacy
and industry backing rather than the health needs of soci-
ety[13]. The results of this review identify implicit priori-
ties. Knowing where economic evaluations have been
focused in the past, it would be useful to determine where
cost-effectiveness efforts in Australia are likely to yield the
greatest benefit. A more coordinated approach to health
economic evaluation may lead to a better coverage of the
priority health areas and important interventions and
could also be used to encourage greater consistency in
results, aiding comparability.
Implications for further research
This exercise should be repeated for other countries, as
findings are likely to vary according to the delivery
arrangements and costing structure of different health sys-
tems. There is the opportunity using datasets such as this
for a more in depth analysis of the quality of economic
evaluation, which could be used to inform evaluator
training and guide methodological advances. It would
also be possible to compare the quality of evaluations
over time to assess improvements.
Another application of this work is to explore the extent to
which economic evaluation informs policy making. Our
recent extension to this work [5] addresses some of the
issues concerning the funding of interventions including
an exploration of the characteristics of interventions that
are related to a higher chance of funding at particular cost-
effectiveness thresholds. This provides evidence of the
apparent success of current priority setting arrangements
in guiding the health sector towards a more efficient allo-
cation of resources across modalities and across disease-
stage [16].
Abbreviations used
A$: Australian Dollar; ABS: Australian Bureau of Statistics;
AIHW: Australian Institute of Health and Welfare; AR-
DRG: Australian refined diagnosis-related group; CPI:
consumer price index; DALY: disability-adjusted life year;
DM: Duncan Mortimer; DRG: diagnosis-related group;
HEED: NHS Economic Evaluation Database; HYE:
healthy-year equivalent; HTA: health technology assess-
Table 5: Parameter estimates and model fit for ordered logit
regression on cost per LY/QALY/DALY group
Predictor β Robust SE Z Sig. R
2
TARGET 0.693 0.265 2.61 0.009 0.003
DISEASE STAGE^ 0.904 0.543 1.67 0.096 0.006
CAUSED BY 1.545 0.230 5.15 0.000 0.035
DOWNSTREAM^ -0.561 0.302 -1.86 0.063 0.039
NOT FUNDED 0.956 0.267 3.58 0.000 0.051
Q-OVERALL 1.378 0.395 3.49 0.000 0.081
Thresholds β Robust SE
Dominant to $10 K = 1
$10 K to $25 K = 2 1.383 0.470
$25 K to $50 K = 3 2.500 0.491
$50 K to $75 K = 4 3.363 0.560
$75 K to $100 K = 5 3.902 0.596
$100 K to $500 K = 6 4.005 0.607
> $500 K = 7 5.111 0.771
^Jointly significant at 0.05 level (Wald χ
2
= 6.43, p = 0.040).
Publish with BioMed Central and every
scientist can read your work free of charge
"BioMed Central will be the most significant development for
disseminating the results of biomedical research in our lifetime."
Sir Paul Nurse, Cancer Research UK
Your research papers will be:
available free of charge to the entire biomedical community
peer reviewed and published immediately upon acceptance
cited in PubMed and archived on PubMed Central
yours — you keep the copyright
Submit your manuscript here:
/>BioMedcentral
Cost Effectiveness and Resource Allocation 2008, 6:9 />Page 12 of 12
(page number not for citation purposes)
ment; ICC: intra-cluster correlation coefficient; ICER:
incremental cost-effectiveness ratio; KD: Kim Dalziel; LS:
Leonie Segal; LY: life-year; MSAC: Medical Services Advi-
sory Committee; PBAC: Pharmaceutical Benefits Advisory
Committee; PBS: Pharmaceutical Benefits Schedule; RCT:
randomised controlled trial; SD: standard deviation; US:
United States of America; US$: United States Dollar.
Competing interests
The authors declare that they have no competing interests.
Authors' contributions
KD participated in the design of the study, coordinated
the data collection, participated in the data analysis and
interpretation of results, and drafted the manuscript. LS
participated in the design of the study and data collection,
and suggested edits and revisions to the manuscript. DM
participated in the data collection, data analysis and inter-
pretation of results, and suggested edits and revisions to
the manuscript. All authors read and approved the final
manuscript.
Additional material
Acknowledgements
This work was supported by a grant from the Australian Research Council.
The views expressed herein are the sole responsibility of the authors.
References
1. George B, Harris A, Mitchell A: Cost-effectiveness analysis and
the consistency of decision making: evidence from the Phar-
maceutical Reimbursement in Australia (1991 to 1996). Phar-
macoeconomics 2001, 19:1103-09.
2. Sculpher M, Fenwick E, Claxton K: Assessing quality in decision
analytic cost-effectiveness models: A suggested framework
and example of application. Pharmacoeconomics 2000, 17:461-77.
3. Australian Bureau of Statistics: 5206.0 Australian National Accounts:
National Income, Expenditure and Product Canberra; 2005.
4. Greene WH: Econometric Analysis New Jersey: Prentice Hall; 1993.
5. Segal L, Dalziel K, Mortimer D: Review of Australian Economic
Evaluation in Health: Time to look at the bigger picture – the
role of the funding environment. Health Econ 2007. forthcoming,
accepted March 2008
6. Australian Institute of Health and Welfare: GP Prevention better than
cure says new report Canberra. 22
nd
October 2002
7. Gandjour A, Wilhelm Lauterbach K: Does prevention save costs?
Considering deferral of the expensive last year of life. J Health
Econ 2005, 24:715-24.
8. Godfrey PO, Johnston RB: Balancing benefits and harms in pub-
lic health prevention programmes mandated by govern-
ments. BMJ 2004, 329:41-3.
9. Epstein LH, Valoski AM, Kalarchian MA, McCurley J: Do children
lose and maintain weight easier than adults: a comparison of
child and parent weight changes from six months to ten
years. Obes Res 1995, 3:411-7.
10. Cohen DR: Introducing quality into cost effectiveness. Int J
Qual Health Care 1990, 2:312-9.
11. Cookson R, McDaid D, Maynard A: Wrong SIGN, NICE mess: is
national guidance distorting allocation of resources? BMJ
2001, 323(7315):743-5.
12. Bell CM, Urbacj DR, Ray JG, Rosen AB, Greenberg D, Neumann PJ:
Bias in published cost effectiveness studies: systematic
review. BMJ 2006, 332:699-703.
13. Neumann PJ, Rosen AB, Greenberg D, Olchanski V, Pande R, Chap-
man RH, Stone PW, Ondategui-Parra S, Nadai J, Siegel JE, Weinstein
MC: Can we better prioritize resources for cost-utility
research? Med Decis Making 2005, 25:429-436.
14. Tengs TA, Adams ME, Pliskin S, Safran DG, Siegel JE, Weinstein MC,
Graham JD: Five-hundred life-saving interventions and their
cost-effectiveness. Risk Anal 1995, 15:369-90.
15. Neumann PJ, Stone PW, Chapman RH, Sandberg EA, Bell CM: The
quality of reporting in published cost-utility analyses, 1976–
1997. Ann Intern Med 2000, 132:964-972.
16. Segal L, Mortimer D: A population-based model for priority set-
ting across the care continuum and across modalities. Cost
Effectiveness and Resource Allocation 2006, 4:6.
Additional file 1
APPENDIX 1_CERA. A copy of the first appendix detailing the search
strategy used in the systematic review
Click here for file
[ />7547-6-9-S1.doc]
Additional file 2
APPENDIX 2_CERA. A copy of the second appendix which provides a list
of the 245 Australian health interventions included in the systematic
review along with an estimate of their cost effectiveness.
Click here for file
[ />7547-6-9-S2.doc]