Báo cáo y học: "The economic burden of inpatient paediatric care in Kenya: household and provider costs for treatment of pneumonia, malaria and meningitis" ppsx
Bạn đang xem bản rút gọn của tài liệu. Xem và tải ngay bản đầy đủ của tài liệu tại đây (513.6 KB, 13 trang )
BioMed Central
Page 1 of 13
(page number not for citation purposes)
Cost Effectiveness and Resource
Allocation
Open Access
Research
The economic burden of inpatient paediatric care in Kenya:
household and provider costs for treatment of pneumonia, malaria
and meningitis
Philip Ayieko*
1
, Angela O Akumu
1
, Ulla K Griffiths
2
and Mike English
1,3
Address:
1
Kenya Medical Research Institute/Wellcome Trust research Programme P.O. Box 43640-00100 GPO, Nairobi Kenya,
2
Health Policy Unit,
London School of Hygiene and Tropical Medicine, Keppel Street, London WC1E 7HT, UK and
3
Department of Paediatrics, University of Oxford,
John Radcliffe Hospital, Headington, Oxford, UK
Email: Philip Ayieko* - ; Angela O Akumu - ;
Ulla K Griffiths - ; Mike English -
* Corresponding author
Abstract
Background: Knowledge of treatment cost is essential in assessing cost effectiveness in
healthcare. Evidence of the potential impact of implementing available interventions against
childhood illnesses in developing countries challenges us to define the costs of treating these
diseases. The purpose of this study is to describe the total costs associated with treatment of
pneumonia, malaria and meningitis in children less than five years in seven Kenyan hospitals.
Methods: Patient resource use data were obtained from largely prospective evaluation of medical
records and household expenditure during illness was collected from interviews with caretakers.
The estimates for costs per bed day were based on published data. A sensitivity analysis was
conducted using WHO-CHOICE values for costs per bed day.
Results: Treatment costs for 572 children (pneumonia = 205, malaria = 211, meningitis = 102 and
mixed diagnoses = 54) and household expenditure for 390 households were analysed. From the
provider perspective the mean cost per admission at the national hospital was US $95.58 for
malaria, US $177.14 for pneumonia and US $284.64 for meningitis. In the public regional or district
hospitals the mean cost per child treated ranged from US $47.19 to US $81.84 for malaria and US
$54.06 to US $99.26 for pneumonia. The corresponding treatment costs in the mission hospitals
were between US $43.23 to US $88.18 for malaria and US $ 43.36 to US $142.22 for pneumonia.
Meningitis was treated for US $ 189.41 at the regional hospital and US $ 201.59 at one mission
hospital. The total treatment cost estimates were sensitive to changes in the source of bed day
costs. The median treatment related household payments within quintiles defined by total
household expenditure differed by type of facility visited. Public hospitals recovered up to 40% of
provider costs through user charges while mission facilities recovered 44% to 100% of costs.
Conclusion: Treatments cost for inpatient malaria, pneumonia and meningitis vary by facility type,
with mission and tertiary referral facilities being more expensive compared to primary referral.
Households of sick children contribute significantly towards provider cost through payment of user
fees. These findings could be used in cost effectiveness analysis of health interventions.
Published: 22 January 2009
Cost Effectiveness and Resource Allocation 2009, 7:3 doi:10.1186/1478-7547-7-3
Received: 7 November 2007
Accepted: 22 January 2009
This article is available from: />© 2009 Ayieko et al; licensee BioMed Central Ltd.
This is an Open Access article distributed under the terms of the Creative Commons Attribution License ( />),
which permits unrestricted use, distribution, and reproduction in any medium, provided the original work is properly cited.
Cost Effectiveness and Resource Allocation 2009, 7:3 />Page 2 of 13
(page number not for citation purposes)
Background
The 4
th
Millennium Development Goal (MDG4) is to
reduce child mortality by two-thirds between 1990 and
2015 [1]. Kenya is currently not on track to reach this goal
[2]. In 1990 the Kenyan under-five mortality rate was
reported as 97 deaths per 1000 live births, but in 2006 it
had increased to 121 deaths per 1000 live births [3].
Kenya is thus among the ten countries with least progress
towards MDG 4 and substantial changes are needed to
reach the goal of 32 deaths per 1000 live births in 2015
[3].
The most common causes of deaths in Kenyan children
after the neonatal period are pneumonia, diarrhoea, mea-
sles, malaria, and malnutrition or a combination of these
conditions [4]. It has been estimated that 63% of global
childhood deaths could be prevented if interventions of
proven efficacy were universally available [5]. These inter-
ventions are a mixture of prevention strategies, such as
vaccination and insecticide-treated bed nets, and case
management. Case management is currently undertaken
at different levels of the Kenyan health system, from out-
patient clinics to tertiary hospitals. The increase in under-
five mortality during the past decade can be plausibly
linked to limited access to case management, sub-optimal
quality of care at the facilities and late health care seeking
behaviour [6-8].
A possible barrier to accessing case management care in
Kenya is the costs of treatment, but knowledge of such
costs is limited. The objective of this study is therefore to
describe the costs associated with treatment of pneumo-
nia, malaria and meningitis among children admitted to
Kenyan hospitals. The viewpoint of the analysis is the
public health sector as well as households. Although care
for children under five years is officially free of charge in
Kenya, households frequently pay for hospital stay and/or
drugs and supplies (henceforth all termed user fees).
These payments made by poor households directly to
service providers are high and continue to grow [9].
Hence, an objective of the study was to estimate the pro-
portion of total treatment costs covered by households.
Analysis of meningitis and pneumonia treatment costs
was undertaken because a proportion of these cases can be
prevented by Haemophilus Influenzae type b (Hib) and
pneumococcal vaccines. Recent projections show that
introduction of Hib and pneumococcal conjugate vac-
cines could reduce the global burden of pneumonia
severe enough to require hospitalization by half while
impacting significantly on all cause childhood mortality
[10,11]. Treatment cost data of the present study can be
integrated into cost-effectiveness analyses of these vac-
cines. Malaria was included to achieve a more compre-
hensive overview of the costs of childhood illnesses and to
provide a comparator to pneumonia, as these two diseases
are the primary cause of inpatient admissions in Kenyan
children [4].
Methods
Study sites and sample selection
Resource utilisation data were collected from a sample of
7 hospitals selected purposefully from the facility list of
the Ministry of Health. For the public health sector, the
selection strategy aimed to ensure representation of large
tertiary hospitals (1 of 2 possible sites), medium sized
regional hospitals (1 of 7 possible sites), and smaller dis-
trict hospitals (3 of 65 possible sites), with representation
of different geographic and climatic regions within Kenya.
In addition, we selected 2 not-for-profit (mission) hospi-
tals providing first referral level services equivalent to dis-
trict hospitals. The selected sites are summarized in Table
1.
The study population included all admissions under 5
years of age with a clinical diagnosis of pneumonia,
malaria or meningitis. Based on the mean costs of paedi-
atric admissions reported in two previous studies [12,13]
we estimated that 30 patients for each diagnostic group
would allow reporting of results around a mean cost of
US$ 100 with estimated precision represented by a stand-
ard error of US$ 6 and 95% confidence interval of ± US$
12. Hence, we aimed to collect data on resource use from
a sample consisting of at least 30 patients with a diagnosis
of malaria and 30 patients with pneumonia per site. For
meningitis, known to be a considerably less common
diagnosis, the aim was to obtain data from at least 30
cases across all sites.
Data collection
Data were collected from November 2004 to October 2005
using two methods: review of medical records and inter-
views with caretakers. The aim was to recruit children pro-
spectively over a 6 week period at each site with the option
to include cases identified retrospectively from those
admitted in the immediate preceding months if case num-
bers were small, particularly likely for meningitis. To ensure
accuracy and uniformity across sites an investigator (AA)
visited each hospital for the first 10 days of data collection
and trained a nurse in the use of two data collection tools.
At the end of the study period AA returned to the sites and
checked the data quality. We selected nurses for data collec-
tion with careful attention to the task of abstracting infor-
mation from medical records. To minimise the potential
for reporting bias as a result of interaction between health
worker and caregiver, study nurses did not perform regular
clinical work during the data collection period. In most
cases we recruited nurses on annual leave.
Cost Effectiveness and Resource Allocation 2009, 7:3 />Page 3 of 13
(page number not for citation purposes)
With the first tool the nurse collected patient specific
resource utilisation data as described in patient records.
The process involved recording the length of hospital stay
(by type of department), the quantity of pharmaceuticals
and supplies used by each patient, and the use of diagnos-
tic tests and other specialized services. Using the second
tool, the nurse completed a structured interview with the
caretaker of each child. The interview was initiated during
admission with the nurse asking about out-of-pocket
spending on health care prior to admission, transport and
costs related to the admission episode, including user fees.
The facility based nurse continued collecting data on
expenses incurred by caretakers on a daily basis until dis-
charge. These included transportation of household mem-
bers visiting the child and all additional out-of-pocket
payments.
It was concluded from a number of pilot interviews that
questions about household income generated unrealistic
answers, as most caretakers were not head of households
and therefore lacked knowledge about this. Instead, infor-
mation on monthly household spending was collected by
asking caretakers for estimates of amounts spent on food,
rent, education and healthcare. To reduce recall bias care-
takers were required to report on the most recent expend-
iture with the option of breaking down the recall period
into daily, weekly or fortnightly expenditure on specified
cost items. Before a cost item was recorded as unknown,
caretakers were asked to enquire about expenditure on
that specific item from household heads. The question-
naire used is included in additional file 1.
Caretakers who participated provided informed written
consent. The Kenya National Ethical Review Committee
and the WHO Ethical Committee approved the study.
Unit costs
Unit costs were estimated in 2005 US$. The average 2005
exchange rate of US$ 0.01329 to the Kenyan shilling was
used
.
Medication costs
While the Kenya Medical Supply Agency (KEMSA) is the
leading supplier of essential drugs to government health
facilities, mission facilities procure their drugs from the
not-for-profit Mission for Essential Drugs Supply (MEDS)
and from private-for-profit distributors [14]. We mainly
estimated drug unit costs from the KEMSA price list, but
for drugs not included in this list and for mission facilities
we used the hospitals' own purchase price lists or the
MEDS list. We applied either a dose-specific cost or the
full cost, depending on whether a drug was reusable or
had to be discarded once it was opened and partially used.
For blood transfusion the cost attributed to each episode
Table 1: Location and characteristics of the 7 study hospitals
Hospital identifier
(location)
Hospital type
(referral level)
Number
of beds
(bed occupancy)
Malaria endemicity Funding source User charging policy
H1
(Nairobi province)
National (tertiary) 1520
(138%)
Low Government budgetary
allocation, user fees and
occasional donations.
To offer free health
care services to all
children under 5 years.
H2
(Rift valley province)
Provincial (secondary) 453
(80%)
Moderate
H3
(Nyanza province)
District (primary) 234
(80%)
High
H4
(Central province)
District
(primary)
208
(120%)
Moderate
H5
(Eastern province)
District
(primary)
182
(108%)
Moderate
H6
(Rift valley province)
Mission (primary) 308
(49%)
Moderate User fees (approx 80% of
the budget), government
seconded staff, donations
(unpredictable and
occasional).
Operate waiver and
credit facilities for
patients not able to pay.
H7
(Rift valley province)
Mission (primary) 160
(59%)
Moderate
Cost Effectiveness and Resource Allocation 2009, 7:3 />Page 4 of 13
(page number not for citation purposes)
was based on the reported costs of providing one unit of
blood from the National Blood Transfusion Service (Table
2).
Diagnostic tests
There was limited information across study sites on the
cost of conducting basic clinical and laboratory diagnostic
investigations. We therefore used the user charge price list
from Kenyatta National Hospital as well as cost estimates
for conducting these investigations at the Kenya Medical
Research Institute/Wellcome Trust clinical laboratories in
Kilifi District Hospital. The unit cost for laboratory inves-
tigations on cerebrospinal fluid (CSF) was estimated from
both sources. The (lower) estimate from Kilifi that cov-
ered only essential CSF examination was applied in most
cases unless specific, additional investigations were
ordered in hospitals that had the capacity to perform these
tests (Table 2).
Table 2: Unit cost estimates for selected items used in the cost analysis (2005 US$)
Investigation/Procedure Unit cost
(2005 US$)
Source
Inter costal drainage 21.91 Kilifi District hospital
Blood transfusion 34.60 National blood transfusion centre
Resuscitation 3.78 Tenwek Mission Hospital
Chest X-ray 1.94 Kilifi costing, KNH
Blood count 8.26 Kilifi District hospital
Lumbar puncture laboratory supplies 1.40 NetSPEAR*
CSF Kenyatta procedures 37.80 Kenyatta National Hospital
CSF Kilifi procedures 14.69 Kilifi District hospital
Blood culture 18.36 Kilifi District hospital
HIV test 3.68 Kilifi District hospital
Ultrasound 6.05 Kenyatta National Hospital
Electrolytes 4.04 Kilifi District hospital
Glucose 3.68 Kilifi District hospital
Blood slide for malaria parasites 3.50 Kenyatta National Hospital
Other microbiology 14.69 Kilifi District hospital
Day in Kenyatta National Hospital 17.46 Guinness et al (2002)[16]
8.85 WHO CHOICE 2005
Day in provincial hospital 13.52 Average Nganda et al (2003)[17] & Guinness et al 2002[16]
6.48 WHO CHOICE 2005
Day in primary referral hospital 9.57 Nganda et al (2003)[17]
4.97 WHO CHOICE 2005
*NetSPEAR – The Network for Surveillance of Pneumococcal Disease in the East African Region
CSF: Cerebrospinal fluid
Cost Effectiveness and Resource Allocation 2009, 7:3 />Page 5 of 13
(page number not for citation purposes)
Costs per hospital bed day
Bed day costs represent the "hotel" component of hospital
costs, i.e. excluding drugs and diagnostic tests which vary
by patient, but including other costs such as personnel,
buildings, food, laundry and capital costs. As illustrated
by Adam et al. [15] one of the most important determi-
nants of bed day costs is the hospital bed occupancy rate;
the higher the occupancy rate, the lower the costs per bed
day. Occupancy rates of the studied facilities are included
in Table 1. It is seen that the occupancy rates at mission
hospitals are considerably less than at Government facili-
ties.
It was not possible to conduct a full micro costing at the
hospitals, so we used estimates based on average bed day
costs derived from two costing studies conducted around
the time of our data collection. One of these studies was
conducted at Kenyatta Hospital, which was also a hospital
included in our sample [16]. For the tertiary hospital we
used the estimates by Guinness et al (2002) and for the
primary referral hospitals the values presented by Nganda
et al (2003) [17] were used. These studies estimated pro-
vider costs and presented costs for each component of
treatment, including a day in hospital. The cost per bed
day in a provincial hospital was estimated as an average
between these two unit costs. Adjustments were made for
inflation to reflect 2005 values. For comparison, the 2005
estimates produced by the WHO-CHOICE project for dif-
ferent facility levels in Kenya />country/ken/cost/en/index.html are presented along with
the unit costs in Table 2 and these values are used in a sen-
sitivity analysis. It is seen that the WHO-CHOICE esti-
mates are approximately half as much as found in the case
studies.
Caretaker time
All hospitalised children were accompanied by an adult
caretaker. The total time lost by caretakers was estimated
by adding the time spent seeking health care prior to
admission and the duration of inpatient stay. Two main
methods that are generally accepted for attaching a mon-
etary value to time lost due to morbidity and health care
seeking. With the human capital approach a focus is
placed on the impact of lost work time and the gross wage
is used to place a value on time [18]. In the friction cost
approach the gross wage is still used to value time, but
unemployment is taken into account with the argument
that output may be made up on return to work or by
replacing workers from the unemployed [18]. Hence, the
productivity costs estimates are lower in the friction than
the human capital approach. However, since the gross
wage is not a meaningful term in a subsistence economy
like rural Kenya, none of these approaches are directly
applicable. We used instead an estimate by Larson et al in
a study on the cost of uncomplicated childhood fevers to
Kenya households [19]. Based on a review of existing lit-
erature on poverty, adult daily income and wages in
Kenya, Larson et al. concluded that US$ 1.00 per day pro-
vides a reasonable estimate of the average monetary value
of caretaker time. This value is less than the 2001 average
daily wage of US$ 1.31 of female horticultural workers
reported by Dolan and Sutherland [20]; thus adjusting for
unemployment and the fact that a relatively large percent-
age of women work in subsistence agriculture [18]. To
assess the importance of this value we reduced it by half
in the sensitivity analysis.
Estimation of total costs
Individual patient resource use data were coupled with
unit cost estimates to generate a patient specific cost esti-
mate for meningitis, pneumonia and malaria cases. To
obtain the average total cost of treatment per case we
added up the cost of drugs, diagnostic investigations and
hospital stay costs. Average treatment costs at the national
hospital and pooled data from the three district hospitals
were compared using t-test. The 95% confidence interval
for difference in arithmetic mean between treatment
groups is likely to be very similar whether t-test based
methods or bootstrapping is used, even with moderate
sample sizes and highly skewed cost data [21].
For the subset of children with caretaker interview infor-
mation we calculated direct caretaker expenses by adding
up pre-admission treatment, transport costs, user fees, and
out-of-pocket costs for items not supplied by the hospital.
When calculating the sum of provider and household
costs we excluded user charges to avoid double-counting.
Results
Sample characteristics
In total, we reviewed 572 records (418 prospective, 154
retrospective) of children with pneumonia, malaria and
meningitis. 90% of the children had only a single diagno-
sis: 211 had malaria, 205 had pneumonia, and 102 had
meningitis. The remaining 54 children had more than one
of the diagnoses, with 41 of these having a combined
diagnosis of malaria and pneumonia. We excluded the 13
children with other co-morbidity diagnoses from further
analyses.
Preliminary analysis showed that data collected prospec-
tively by the study nurse during the 6 week period were
not different to those of retrospective cases and we there-
fore pooled and analysed the data together. We obtained
interviews with 393 (94%) out of the 418 caretakers for
whom we had prospective treatment cost data. Age and
sex distributions for the different diagnoses were similar.
The median age (interquartile range, IQR) of children in
the entire sample was 12 months (5.5–24) and 323
(56%) children were boys.
Cost Effectiveness and Resource Allocation 2009, 7:3 />Page 6 of 13
(page number not for citation purposes)
Meningitis diagnoses were over represented within three
hospitals; 43 out of the 102 cases were treated at the
national hospital and a further 46 at either the regional
hospital or a single district hospital. Table 3 shows that
the number of patients with a diagnosis of malaria or
pneumonia ranged from 17 to 49 cases per site. Overall,
48 (8.4%) children died while admitted at the facilities.
The disease specific case fatality rates were 5% for malaria,
10% for meningitis and 11% for pneumonia.
Resource use
Children in the study were admitted to hospital after a
median duration (IQR) of 3 days (2–6 days) following the
onset of symptoms. Approximately half of the caretakers
sought care from other sources before going to hospital.
The length of stay in hospital ranged from 1 day to 68 days
with a median (IQR) of 5 days (3–8 days). The admission
prescriptions across all sites frequently included non
essential drugs which were not related to the admission
diagnosis. All children with pneumonia as a single diag-
nosis received at least 4 drugs. Over half the children with
malaria and 78% of the meningitis cases received 5 or
more drugs. For investigations, at least one basic diagnos-
tic test was ordered in 91% of the children during inpa-
tient stay. The most common request was a blood slide for
malaria parasites. 27% of the malaria cases and 21% of
the pneumonia cases had more than 2 tests done. Blood
culture was available at only two sites and HIV testing was
rarely done although it was reportedly available across
sites.
Provider cost estimates
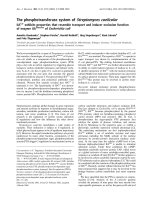
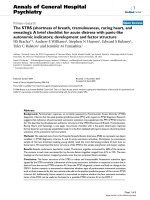
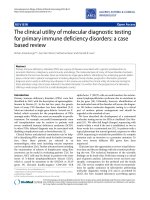
Figure 1 shows the right-skewed distribution of provider
costs for children with malaria. A similar pattern was seen
for pneumonia and meningitis costs. We therefore report
the median cost and inter-quartile range in Table 3 as
most appropriately representing the central tendency and
range of costs, but also the mean costs as these are the
most useful for estimating total costs for any number of
patients [21]. At the seven facilities the mean total pro-
vider costs for treating a case of malaria ranged from US$
42.23 to US$ 95.58, while the cost of an episode of pneu-
monia was between US$ 43.36 and US$ 177.14. At the
national hospital the mean treatment costs of meningitis
were US$ 290.42. At the other two hospitals where chil-
dren with meningitis were seen the mean treatment costs
were US$ 189.41 and US$ 205.74 per case.
The mean provider costs of investigations and drugs for
pneumonia patients were consistently higher at the terti-
ary referral hospital compared to the 3 public district hos-
pitals (Table 4). On the whole, there was a difference in
total costs for children with pneumonia (P < 0.0001) and
malaria (P = 0.004) at the national hospital and the dis-
trict facilities. Similarly, the costs of treatment at one of
the mission hospitals with more advanced diagnostic
facilities approximated that at the tertiary referral level
and differed significantly from other district hospitals (P
< 0.0001).
Caretaker costs
Caretakers spent an average of 1 hour and 49 min (range,
15 min to 10 hours) travelling to seek health care services
for their sick children. Consequently, an average round
trip would last 3 hours and 38 min, or approximately 0.5
working days. Table 3 presents the average length of stay
(days) according to facility and diagnosis. The average
time caretakers spent in caring for an admitted child
regardless of diagnosis was 6.5 days (SD = 7.5).
All the caretakers, both in government and mission hospi-
tals reported that they were required to pay a user charge.
For those who used public facilities 89% reported making
either partial or complete payments of the total amount
required. The remaining cases were waived by the hospi-
tals with most of the waivers being at the national hospi-
tal. At one mission hospital all the caretakers reported
having made payments while the second hospital waived
2 cases and discharged 4 children whose caretakers were
to pay for the services later.
At least 25% of the children admitted at the tertiary hos-
pital were still in the ward waiting for relatives to be able
to pay user fee bills on average 4 days after being medi-
cally discharged at a cost of US$17.46 to the provider and
a charge of US $ 5.32 to the household per each extra day
spent in hospital. The longest stay by a patient awaiting
administrative discharge at this institution was 22 days. At
the district hospitals it was found that 10% of admissions
remained in the wards 2 to 3 days after medical discharge
because the family did not have funds to pay the bill. The
mission hospitals on the other hand operated an early dis-
charge system, at times offering credit terms of payment to
households with difficulties in raising the required funds.
Payment of user fees by caretakers resulted in recovery of
a substantial proportion of the treatment costs. Approxi-
mately 44% to 100% of provider costs at the mission hos-
pitals were recovered from user fees. At the government
tertiary referral facility an average of US$ 65.10 was recov-
ered per admission accounting for approximately 40% of
total costs. At public district hospitals the costs recovered
from households amounted to between US$ 6.1 and US$
19.66 per child admitted, which is approximately 15% of
the treatment costs.
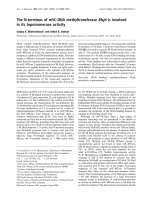
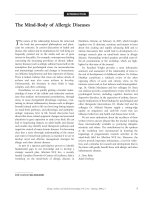
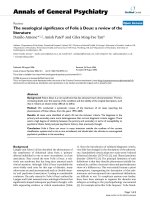
The distribution of household costs according to expense
category and facility type is illustrated in Figure 2. The rel-
ative contribution of user charges to total household
spending on healthcare is lower in public district facilities
Cost Effectiveness and Resource Allocation 2009, 7:3 />Page 7 of 13
(page number not for citation purposes)
Table 3: Mean cost for malaria, pneumonia and meningitis treatment in 2005 US$ among children admitted to seven Kenyan hospitals
Hospital Diagnosis No of patients Average length
of stay (days)
Mean drug
costs
Mean cost of
investigations
Mean bed-day
cost
Mean (SD)
health sector
cost per
patient*
Median (IQR)
health sector
cost*
National hospital
H1 Malaria 27 4.3 4.07 16.49 75.03 95.58 (78.27) 78.72
(40.36–125.41)
Pneumonia 49 8.2 15.17 18.70 143.26 177.14
(206.76)
117.40
(58.97–201.90)
Meningitis 43 12.8 24.33 36.95 223.37 284.64
(239.38)
222.60
(159.68–
317.06)
Provincial hospital
H2 Malaria 29 4.7 8.68 9.77 63.40 81.84 (73.60) 58.73
(37.46–103.60)
Pneumonia 31 6.6 6.57 3.53 89.67 99.26 (71.14) 71.94
(55.26–109.75)
Meningitis 24 11.7 18.41 13.29 157.71 189.41
(141.58)
165.31
(126.24–
237.23)
District hospitals
H3 Malaria 44 4.8 3.06 26.25 45.91 75.22 (42.09) 75.13
(36.33–102.84)
Pneumonia 29 4.8 2.23 8.44 45.89 56.55 (60.37) 41.42
(23.75–69.89)
H4 Malaria 25 4.7 4.11 5.85 45.19 55.16 (30.67) 46.64
(34.13–67.76)
Pneumonia 30 6.7 2.88 4.94 64.14 71.96 (29.38) 56.00
(52.65–84.09)
H5 Malaria 25 3.8 2.68 8.51 36.00 47.19 (43.16) 37.98
(33.21–45.01)
Pneumonia 17 4.2 4.29 9.79 39.98 54.06 (33.82) 50.65
(30.90–66.61)
Malaria and
pneumonia
20 4.5 2.42 8.03 43.08 53.53(34.41) 79.00
(34.91–121.16)
Mission hospitals
H6 Malaria 30 4.5 13.15 31.62 43.40 88.18 (59.92) 72.82
(43.65–113.83)
Pneumonia 30 7.8 32.15 35.39 74.68 142.22
(103.39)
140.49
(51.04–185.23)
Cost Effectiveness and Resource Allocation 2009, 7:3 />Page 8 of 13
(page number not for citation purposes)
compared to mission hospitals and the tertiary referral
hospital. Transportation costs associated with completing
referrals contribute significantly to household costs at ter-
tiary referral level (11% of total costs). The reported
sources of funds for payment of inpatient care was per-
sonal savings (64%), borrowing to repay later (8%),
applications for waivers (5%), and donation from friends
and relatives (4%).
Table 5 compares the median household out of pocket
costs with the median reported monthly household
expenditure within household expenditure quintiles
(lower, middle and upper tertiles) at different facilities.
The households in the lowest expense category within
mission facilities paid a median user charge of US$ 61.81
compared to their median total household expenditure of
US$ 44.11 per month. The median user charge paid across
Meningitis 22 11.8 44.03 44.85 112.71 201.59(126.41) 162.00
(115.16–
248.14)
H7 Malaria 31 3.1 6.34 6.55 29.34 42.23 (23.60) 36.46
(32.80–46.45)
Pneumonia 19 3.4 3.05 7.56 32.75 43.36 (29.75) 35.53
(31.96–51.01)
*Excluding pre-admission costs, caretaker time and transport costs, but including revenues generated from user fees.
Table 3: Mean cost for malaria, pneumonia and meningitis treatment in 2005 US$ among children admitted to seven Kenyan hospitals
Distribution of provider costs for treating malaria (Pooled data from all facilities)Figure 1
Distribution of provider costs for treating malaria (Pooled data from all facilities).
Cost Effectiveness and Resource Allocation 2009, 7:3 />Page 9 of 13
(page number not for citation purposes)
expenditure quintiles were comparable within facility
types, apart from the national hospital where households
in the lowest expenditure category made lower payments
(US$28.94) compared to those in the middle (US$ 41.33)
and upper (US$ 52.63) expenditure tertiles. The lowest
median payment for transportation was within the lowest
expenditure tertile (US$ 1.46) at secondary referral facility
while the highest median payment was (US$ 10.10)
within the highest expense group at the national referral.
Preadmission treatment costs were generally low (median
payments from US $ 0.03 to 4.39) and caretaker time
costs were comparable across facilities and expenditure
groups (median time costs US $5.29 to 9.00).
Total costs
The societal cost (direct costs plus caretaker time costs) for
meningitis was not calculated because 70% of the menin-
gitis data was retrospective and lacked caretaker informa-
tion. Using prospective data only the mean total cost for
malaria treatment was US$ 135.57 and US$ 197.54 for
pneumonia at the national hospital. Hence, within this
facility pre-admission costs, transport costs and the
opportunity costs of caretaker time amounted to US$
16.12 for malaria and US$ 27.28 for pneumonia, repre-
senting 12% and 14% of total costs, respectively. At public
district hospitals the mean total costs were US$ 75.21 for
malaria and US$ 74.64 for pneumonia, and at the mission
hospitals total costs were US$ 89.59 and US$ 135.26 for
malaria and pneumonia, respectively. The costs of pre-
admission, transport and time were on average US$ 12.49
and US$ 11.93 for malaria and US$ 12.54 and US$ 18.82
for pneumonia in public district hospitals and mission
hospitals, respectively.
Sensitivity analysis
The base case results were relatively insensitive to one-way
variation in our major assumption on the value of care-
taker time. Assuming that we had overestimated the value
of caretaker time in the base case analysis by 100%, the
corresponding effect would be a 2% reduction in costs at
the national referral hospital and a 5% reduction at dis-
trict facilities. However, the treatment cost estimates were
sensitive to the source of bed day costs (published costing
case studies or WHO CHOICE values) used. The costs of
treatment for all the 3 diagnoses were lower across facili-
ties when bed day cost values used in base case analysis
were replaced by WHO CHOICE values. Across the seven
hospitals the treatment costs were between 23% and 40%
lower for malaria and 25% to 47% lower for pneumonia
when WHO CHOICE estimates were used.
Discussion
Our findings indicate that there exist significant differ-
ences in the provider costs of treating pneumonia, malaria
and meningitis in childhood within public and mission
facilities in Kenya. There are further cost differences
Table 4: Mean cost* for pneumonia and malaria treatment at national referral hospital and pooled data from the 3 district hospitals
(2005 US$)
Cost category Facility type Difference between facilities (95%CI) P value
National hospital District hospitals
Pneumonia
Investigations 18.70 7.36 11.34 (5.10–17.59) < 0.001
Drug cost 15.17 2.95 12.23 (6.46 – 17.99) < 0.001
Hospital stay 143.27 51.77 91.50 (48.21–134.78) < 0.001
Total 177.14 62.08 115.06 (66.54–163.59) < 0.001
Malaria
Investigations 16.49 16.10 0.38 (-8.15–8.91) 0.93
Drug costs 4.07 3.24 0.83 (-1.0–2.66) 0.37
Hospital stay 75.03 43.08 31.95 (13.56–50.33) <0.001
Total 95.58 62.42 33.15 (10.84 – 55.47) 0.004
*Excluding pre-admission costs, caretaker time and transport costs
Cost Effectiveness and Resource Allocation 2009, 7:3 />Page 10 of 13
(page number not for citation purposes)
Distribution of caretaker cost according to expense category and facility typeFigure 2
Distribution of caretaker cost according to expense category and facility type.
Cost Effectiveness and Resource Allocation 2009, 7:3 />Page 11 of 13
(page number not for citation purposes)
within the public sector depending on the level of the
facility and presenting diagnosis. Households subsidise
provider costs partially through payment of user charges
in the public sector and within the mission sector the
entire provider costs may be passed on to households.
The difference in costs of treating malaria, pneumonia
and meningitis according to type of facility depends to a
certain extent on existing diagnostic capacity. For malaria,
a disease with a standard and widely available diagnostic
approach, the cost of investigation and drug treatment in
Table 5: Median monthly household expenditure and median user charge payments by household expenditure tertiles within different
facility types
National referral hospital Secondary (provincial) referral District hospitals Missionary hospitals
Lower expenditure tertile
Number of households, n 28 16 58 26
Median household monthly expenditure (US$) 55.93 46.74 35.33 44.11
Median user charge payment (US$) 28.94 15.48 5.45 61.81
Median transport costs (US$) 6.38 2.99 1.86 3.99
Median preadmission cost (US$) 0.53 1.53 1.26 0.03
Median time costs (US$) 6.91 6.5 6.5 6.58
Middle expenditure tertile
Number of households, n 27 16 58 27
Median household monthly expenditure (US$) 96.80 73.76 69.12 96.35
Median user charge payment (US$) 41.33 17.88 6.25 53.16
Median transport costs (US$) 13.29 1.46 1.86 3.32
Median preadmission cost (US$) 2.69 2.75 0.70 0.93
Median time costs (US$) 7.00 8.25 5.29 6.00
Upper expenditure tertile
Number of households, n 27 16 58 24
Median household monthly expenditure (US$) 169.67 122.02 140.62 191.27
Median user charge payment (US$) 52.63 17.01 7.97 60.00
Median transport costs (US$) 10.10 1.59 2.26 6.51
Median preadmission cost (US$) 4.39 4.45 1.40 1.13
Median time costs (US$) 6.50 5.63 6.0 9.00
Cost Effectiveness and Resource Allocation 2009, 7:3 />Page 12 of 13
(page number not for citation purposes)
the national hospital was not significantly different from
the district hospitals. However, for pneumonia the costs
were higher at the national hospital and one mission facil-
ity. In this mission facility with advanced diagnostic
capacity the cost of treating pneumonia approximated
that of the national hospital and differed from the remain-
ing district hospitals.
In line with earlier studies meningitis was the most expen-
sive condition to treat [22,23]. However, the recently esti-
mated cost of US$ 2,043 per case of meningitis treated in
Pakistan is six-fold higher than the estimates we have
reported [22]. This is likely to reflect the difference in
health care setting and the range of investigations and
drugs used in the treatment of meningitis that signifi-
cantly impact total costs. In our sample, treatment was
predominantly based on inexpensive first line drugs and
in most sites laboratories conducted only basic aspects of
CSF analysis, and very rarely any imaging investigations.
For malaria and pneumonia our estimates are similar to
those appearing in the literature. When adjusting the
1993/4 study of malaria treatment costs in 2 Kenyan dis-
trict hospitals [13] to 2005 values, the average costs range
from US$ 46 to US$ 63, depending on disease severity,
which is very comparable to our provider cost estimates of
between US$ 47 and US$ 75 for treatment of malaria in a
district hospital. The range of treatment costs we report
(US$ 46–U$ 172) for pneumonia compares with the aver-
age cost of US$ 71 per episode of pneumonia and US$
236 for severe pneumonia reported recently in Pakistan
[22].
An important finding was that rationalising resource use
can have a significant impact on the cost of treatment.
Firstly, national treatment guidelines for severe pneumo-
nia recommend that inpatients be treated with a single
antibiotic only and those with very severe disease receive
a combination of two antibiotics. However, over half the
children with pneumonia as a stand-alone diagnosis
received at least 4 drugs. Adherence to clinical guidelines
and rational resource use could be effective in reducing
costs of treatment. We found that the mean cost of a drug
prescription for a child with pneumonia across the hospi-
tals was between US$ 3.0 – US$ 31.2, but the mean cost
for essential drugs only in this sample would be US$ 0.36
for severe pneumonia and US$ 0.9 in a case of very severe
pneumonia. Secondly, the inability of households to raise
user charges in time resulted in prolonged hospital stay
and additional costs, especially at tertiary referral. The
opportunity costs of having children that have already
been discharged occupying limited hospital beds is con-
siderable, so there is an urgent need for change in practice
in this area.
The finding of high user charge is not surprising for two
reasons. Patients admitted within health facilities com-
monly fail to raise the charges requested on discharge in
both public and private facilities. Secondly, a report of
user fees charge in Kenyan faith-based health institution
has reported 120% cost recovery for treatment costs of
childhood malaria [24]. Such high recoveries cover cost
deficits for more expensive to treat conditions.
Similar to an earlier report by the ministry of health [9],
household earnings and personal savings were the most
common sources of payment in our study. The National
Hospital Insurance Fund (NHIF) set up in 1996 provides
medical insurance to employed Kenyans earning more
than US $13.29 (KES 1000) per month [25]. The fund cur-
rently has a membership of 1.8 million out of 14.9 mil-
lion people in the 15 to 65 years age group [25], implying
most Kenyan household are not covered. These house-
holds pay for their healthcare directly from their earnings
and savings.
The findings reported have a number of limitations. The
estimates we used for bed-day cost of hospitals are based
on results of two studies each representing a single hospi-
tal in Kenya and it is known that bed-day costs vary signif-
icantly between hospitals within countries, especially due
to differences in occupancy rates [15]. Unfortunately,
overcoming this limitation is difficult given the expense of
conducting multiple formal hospital costing studies. Sec-
ondly, pre-admission costs were underestimated in our
study as outpatient facilities were not included. Future
studies should extend such analyses to cover children
attending outpatient facilities, as this will provide more
comprehensive information on the cost of treatment.
Conclusion
The treatments cost estimates we report vary by facility
type and significantly increase the body of data available
in Kenya. These costs can be interpreted as approximate
values for disease specific treatment costs in similar facil-
ity types in Kenya, and perhaps similarly placed low-
income countries. It was revealed that the tertiary public
facility charged similar levels of user fees as a mission hos-
pital included in the analysis and that these payments
were a major challenge to households. The second mis-
sion hospital recovered entire provider costs by charging
user fees.
Competing interests
The authors declare that they have no competing interests.
Those funding the work had no role in study design,
reporting or the decision to submit the manuscript for
publication.
Publish with Bio Med Central and every
scientist can read your work free of charge
"BioMed Central will be the most significant development for
disseminating the results of biomedical research in our lifetime."
Sir Paul Nurse, Cancer Research UK
Your research papers will be:
available free of charge to the entire biomedical community
peer reviewed and published immediately upon acceptance
cited in PubMed and archived on PubMed Central
yours — you keep the copyright
Submit your manuscript here:
/>BioMedcentral
Cost Effectiveness and Resource Allocation 2009, 7:3 />Page 13 of 13
(page number not for citation purposes)
Authors' contributions
PA participated in the analysis and wrote the manuscript.
AOA was responsible for data collection and participated
in cost analysis. UKG designed the study, participated in
the cost analysis and in writing the manuscript. ME con-
ceived of the study, oversaw its design and coordination,
and participated in writing the manuscript. All authors
read and approved the final manuscript.
Additional material
Acknowledgements
The authors gratefully acknowledge the caretakers who agreed to partici-
pate in the study and the staff in the hospitals for their input and help with
data collection. We are grateful to Dr Catherine Goodman for her com-
ments on earlier drafts of the paper. This paper is published with permis-
sion of the Director of KEMRI. Funding for the data collection part of the
study was granted by the Immunization, Vaccines and Biologicals Depart-
ment of WHO, Geneva. Mike English and Philip Ayieko are funded through
a Wellcome Trust Senior Research Fellowship awarded to Mike English
(#076827).
References
1. United Nations Statistics Division: Millenium Development Goals
Indicator. [ />].
2. Ministry of Planning and National Development: Millenium devel-
opment goals in Kenya. Needs and costs. [http://
www.ke.undp.org/KenyaMDGNeedsAssessment.pdf].
3. The United Nations Children's Fund (UNICEF), 2008. Track-
ing progress in maternal, newborn & child survival: The 2008
report. ISBN 978-92-806-4284-1. .
4. Ministry of Health. Republic of Kenya. Health management
information systems. Report for the 1996 to 1999 period.
2001.
5. Jones G, Steketee RW, Black RE, Bhutta ZA, Morris SS: How many
child deaths can we prevent this year? Lancet 2003, 362:65-71.
6. English M, Esamai F, Wasunna A, Were F, Ogutu B, Wamae A, Snow
RW, Peshu N: Assessment of inpatient paediatric care in first
referral level hospitals in 13 districts in Kenya. Lancet 2004,
363:1948-1953.
7. Nolan T, Angos P, Cunha AJ, Muhe L, Qazi S, Simoes EA, Tamburlini
G, Weber M, Pierce NF: Quality of hospital care for seriously ill
children in less-developed countries. Lancet 2001, 357:106-110.
8. Snow RW, Mung'ala VO, Foster D, Marsh K: The role of the dis-
trict hospital in child survival at the Kenyan Coast. Afr J Health
Sci 1994, 1:71-75.
9. Ministry of Health, Republic of Kenya. Kenya National
Health Accounts 2000–2001. 2003.
10. Cutts F, Zaman S, Enwere G, Jaffar S, Levine O, Okoko J, Oluwalana
C, Vaughan A, Obaro S, Leach A, et al.: Efficacy of nine-valent
pneumococcal conjugate vaccine against pneumonia and
invasive pneumococcal disease in The Gambia: randomised,
double-blind, placebo-controlled trial. Lancet 2005,
365:1139-1146.
11. Scott J, Brooks W, Peiris J, Holtzman D, Mulholland E: Pneumonia
research to reduce childhood mortality in the developing
world. J Clin Invest 2008, 118:1291-1300.
12. Flessa S: The costs of hospital services: a case study of Evan-
gelical Lutheran Church hospitals in Tanzania. Health Policy
Plan 1998, 13:397-407.
13. Kirigia J, Snow R, Fox-Rushby J, Mills A: The cost of treating pae-
diatric malaria admissions and the potential impact of insec-
ticide-treated mosquito nets on hospital expenditure. Trop
Med Int Health 1998, 3:145-150.
14.
Christian Health Association of Kenya: Health financing in
church health facilities; A report of the CHAK annual health
conference. 2003.
15. Adam T, Evans DB, Murray CJ: Econometric estimation of coun-
try-specific hospital costs. Cost Eff Resour Alloc 2003, 1:3.
16. Guinness L, Arthur G, Bhatt S, Achiya G, Kariuki S, Gilks C: Costs of
hospital care for HIV-positive and HIV-negative patients at
Kenyatta National Hospital, Nairobi, Kenya. AIDS 2002,
16:901-908.
17. Nganda B, Wang'ombe J, Floyd K, Kangangi J: Cost and cost-effec-
tiveness of increased community and primary care facility
involvement in tuberculosis care in Machakos District,
Kenya. Int J Tuberc Lung Dis 2003, 7:S14-20.
18. Pritchard C, Sculpher M: Productivity costs: principles and practice in eco-
nomic evaluation. London 2000.
19. Larson BA, Amin AA, Noor AM, Zurovac D, Snow RW: The cost of
uncomplicated childhood fevers to Kenyan households:
implications for reaching international access targets. BMC
Public Health 2006, 6:314.
20. Dolan C, Sutherland K: Gender and employment in the Kenya
horticultural value chain. Discussion Paper 8. School of
Development Studies and Overseas Development Group,
University of East Anglia, Norwich NR47TJ, United King-
dom. 2002.
21. Thompson SG, Barber JA: How should cost data in pragmatic
randomised trials be analysed? BMJ 2000, 320:1197-1200.
22. Hussain H, Waters H, Omer S, Khan A, Baig I, Mistry R, Halsey N:
The cost of treatment for child pneumonias and meningitis
in the Northern Areas of Pakistan. Int J Health Plann Manage
2006, 21:229-238.
23. Nelson E, Weikert M, Phillips J: Paediatric treatment costs and
the HIV epidemic. Cent Afr J Med 1995, 41:139-144.
24. Christian Health Association of Kenya (CHAK): Cost analy-
sis of essential curative health services in church health facil-
ities. Study report. March 2006. .
25. Ministry of Health. Republic of Kenya. A report on the per-
formance status. Health Management Information System
2003 – 2004 annual report. .
Additional file 1
Study questionnaire. Caregiver and Out-of-Pocket Costs Questionnaire.
Click here for file
[ />7547-7-3-S1.doc]