Báo cáo y học: "Prevention, screening and treatment of colorectal cancer: a global and regional generalized cost effectiveness analysis" docx
Bạn đang xem bản rút gọn của tài liệu. Xem và tải ngay bản đầy đủ của tài liệu tại đây (1.75 MB, 16 trang )
RESEARC H Open Access
Prevention, screening and treatment of colorectal
cancer: a global and regional generalized cost
effectiveness analysis
Gary M Ginsberg
1*
, Stephen S Lim
1
, Jeremy A Lauer
1
, Benjamin P Johns
1
, Cecilia R Sepulveda
2
Abstract
Background: Regional generalized cost-effectiveness estimates of prevention, screening and treatment
interventions for colorectal cancer are presented.
Methods: Standardised WHO-CHOICE methodology was used. A colorectal cancer model was employed to
provide estimates of screening and treatment effectiveness. Intervention effectiveness was determined via a
population state-transition model (PopMod) that simulates the evolution of a sub-regional population accounting
for births, deaths and disease epidemiology. Economic costs of procedures and treatment were estimated,
including programme overhead and training costs.
Results: In regions characterised by high income, low mortality and high existing treatment coverage, the addition
of screening to the curr ent high treatment levels is very cost-effective, although no particular intervention stands
out in cost-effectiveness terms relative to the others.
In regions characterised by low income, low mortality with existing treatment coverage around 50%, expanding
treatment with or without screening is cost-effective or very cost-effective. Abandoning treatment in favour of
screening (no treatment scenario) would not be cost effective.
In regions characterised by low income, high mortality and low treatment levels, the most cost-effective interven-
tion is expanding treatment.
Conclusions: From a cost-effectiveness standp oint, screening programme s should be expanded in developed
regions and treatment programmes should be established for colorectal cancer in regions with low treatment
coverage.
Background
In 2000 , colorectal cancer accounted for approximately
579,000 deaths (equivalent to 1% of all deaths and 8% of
deaths due to malignant neoplasms) worldwide. In bur-
den-of-disease terms, colorectal cancer accounts for
0.38% of all DALYs and 7.2% of DALYs due to malig-
nant neoplasms [1]. Geographical disparities in the bur-
den of colorectal cancer are pronounced. For example,
colorectal cancer incidence rates are 5-10 times higher
in the most developed regions of the world than in
developing regions (personal communication, K.Shibuya,
World Health Organization).
Cost effectiveness analyses of the many interventions
(primary prevention, screening or treatment) for redu-
cing the burden of colorectal cancer have usually been
restricted to developed co untry settings and with often
considerable variation in the analytical methods used.
This limits the value of the exist ing literature to info rm
colorectal cancer control policies in low to middle-
income country settings. Assessment of costs and effects
of different strategies can help guide decisions on the
allocation of resources across interventions, as well as
between interventions for colorectal cancer and inter-
ventions for other conditions or risk factors.
This research presents estimates on the costs and
effects of various comb inations of available interven tion
strategies for colo rectal cancer across regions usi ng
standardised methods, data sources and tools [2-10] that
* Correspondence:
1
Costs, Effectiveness, Expenditure and Priority Setting, World Health
Organization, Geneva, Switzerland
Ginsberg et al. Cost Effectiveness and Resource Allocation 2010, 8:2
/>© 2010 Ginsberg et al; licensee BioMed Cent ral Ltd. This is an Open Access article distributed under the terms of the Crea tive
Commons Attribution License ( which permits unrestricted use, distribution, and
reproduction in any mediu m, provided the original work is properly c ited.
have been developed by the WHO-CHOICE (CHOosing
Interventions that are Cos t Effective) program. The
results should help answer policy questions such as
whether and what type of screening programmes should
be added in populations with a high level of access to
treatment, or, in developing countries, whether to put
scarce resources into screening or into expanding levels
of treat ment coverage. In addition, the study will f acili-
tate the prioritisation process by allowing comparisons
to be made, using similar methodologies, with interven-
tions (whether, primary prevention, screening or treat-
ment) for cardiovascular [11] and other diseases [12].
Methods
WHO-CHOICE framework
WHO-CHOICE comprises sectoral, population-level
cost-effective ness analyses based on a generalized cost-
effectiveness analysis framework [6]. Generalized cost-
effectiveness analysis is characterized by the assessment
of costs and effects against a reference scenario defined
as the absence of all curre nt interventions against the
disease or risk factor (the “ null scenario ”). This
approach facilitates [13] the comparison of cost-effec-
tiveness findings across competing interventions [14].
Costs and effects of key interventions for colorectal
cancer were modeled at the population level in 14
WHO regions [15].
Basically there are two stages to the calculations:-
i) We first constructed a model that predicted inter-
vention-specific decreases in incidence and case
fatality rates.
ii) The data from the first model was then combined
with regional specific demographic and cost data
and run over a time period of one hundred years in
order to predict regional intervention specific out-
comes in terms of costs and DALYs saved.
Choice of interventions
The interventions analyzed are listed in Table 1 repre-
sent protocols that are either recommended [16] or
used in some countries [17] or combinations there of.
The reference strategy in keeping with the metho dology
of generalized cost-effectiveness an alysis is the null con-
sisting of no intervention or treatment.
These can be grouped into the following categories:-
Repeated Screening (followed by removal of polyps or
potentially cancerous lesions)
i) Five interventions represent longit udinal screening
programs based on current consensus recommendations
[16]. These interventions (Annual and Biannual FOBT,
Sigmoidoscopy every 5 years, Colonoscopy every 10 years
and Annual FOBT with Sigmoidoscopy every 5 years)
are analysed first in a scenario where no treatment
(radiotherapy, surgery or chemotherapy) for cancers is
available. Individuals screened positives are assumed to
have follow-up colonoscopy with the removal of any
detected polyps or lesions.
One-off Screening (with polyp and lesion removal)
ii) Four additional interventions (FOBT, Sigmoidoscopy,
Colonoscopy and Annual FOBT with Sigmoidoscopy com-
bined) represent a one-off screening program (with polyp
and lesion removal) for persons aged 50 years, akin to the
sigmoidoscopy program recently introduced in France.
Treatment
iii) Treatment interventions include combinations of
surgery, radiotherapy and chemotherapy, consistent with
current practice in developed countries.
Repeated Screening (with polyp and lesion removal) and
treatment
iv) A combination intervention consisting of each of the
five repeated screening programs in a scenario where
treatment is available.
One-Off Screening (with polyp and lesion removal) and
treatment
v) A combination intervention consisting of each of the
four one-off screening programs at age 50 in a scenario
where treatment is available.
Prevention
vi) Increasing fruit and vegetable consumption by means
of mass media campaigns. The cost-effectiveness of this
intervention is likely to be underestima ted in this analy-
sis as the likely benefits of decreases in other diseases,
such as cardiovascular disease and strokes, was beyond
this analysis’s scope [17].
Other interventions of uncertain efficacy
vii) The final two interventions are annual Digital Rect al
Exams (DRE) with and without medical treatment.
These were included because of its “low-technological”
approach for possible use in developing countries,
despite the fact that evidence for this interv ention vis-à-
vis colore ctal cancer is based on non-sign ificant results
from a lone case-control [18]. Despite not being recom-
mended in most developed countries, results have been
presented for comparative completeness. While we
included ben efits of DRE o f reducing colorectal cancer,
we did not incl ude any possible benefits resulting from
reducing prostate cancer.
Interventions not included
Double contrast barium enema was not analyzed due to
the lack of evidence of reductions i n incidence or mor-
tality [19-22]. Furthermore,bariumscreeninghaslow
sensitivity for diagnosing symptom atic patients [19] and
polyps [23] and hence limited applicability to population
screening. Finally, compliance is likely to be low due to
the perceived unpleasant nature of the test [22].
Ginsberg et al. Cost Effectiveness and Resource Allocation 2010, 8:2
/>Page 2 of 16
Despite the availabilit y of data on consumption a nd
price elasticity [24,25], price subsidies to increase fruit
and vegetable consumption were not analyzed due to
theoretical difficulties in calculating intervention costs in
economic terms (since subsidies are transfer payme nts
from the government to consumers). A further compli-
cation is a possible increase in red meat consumption,
itself a potential risk factor for colorectal cancer [26,27],
due to income effects.
Other preventive interventions like mass media cam-
paigns to increase physical activity [28,29] and reduce
body mass index we re excluded because of insufficient
data on the large-scale efficacy of such campaigns. The
effects of changing transport modes (e.g. increasing rail
and bike travel) and of urban planning (eg. decreasing
“sprawl”) o n physical activity were also excluded due to
lack of time-series data [30,31].
Reducing tobacco use was not considered because
available evidence is insufficient to show a causal link
with colorectal cancer [32]. Lack of data on efficacy was
the primary reason for excluding palliative care for late-
stage cancers.
Aspirin [33] or Foli c Acid [34] were not conside red as
potential interventions because evidence for their efficacy
is only based on case-control and cohort studies. This
level of evidence does not meet the WHO-CHOICE
requirement of evidence from randomized controlled
trials in order to evaluate pharmacological interventions.
Table 1 Estimated Effects of Interventions (based on model of AMRA region) and assumed Compliance data that were
inputted into POPMOD model
Intervention Description Decrease
in Incidence
Decrease
in
Case-Fatality Rate
Compliance
FOB1 Annual Fecal Occult Blood Tests
a
35.0% 0% 56.8%
FOB2 Biannual Fecal Occult Blood Tests
a
21.9% 0% 61.8%
SIG5 Sigmoidoscopy every 5 years[1]
a
38.9% 0% 45.0%
COL10 Colonoscopy every 10 years
a
52.6% 0% 45.0%
FOB1SIG5 Annual FOBT, SIG every 5 years
a
51.5% 0% 45.0%
FOB50 FOBT at age 50
a
2.6% 0% 71.8%
SIG50 Sigmoidoscopy at age 50
a
11.8% 0% 55.0%
COL50 Colonoscopy at age 50
a
25.9% 0% 55.0%
FOBSIG50 FOBT & SIG at age 50
a
13.2% 0% 55.0%
RX Medical Treatment of cancers
b
0% 91.9% 100%
FOB1RX Combination of FOB1 & RX 35.0% 17.9%
c
56.8%
FOB2RX Combination of FOB2 & RX 21.9% 12.9%
c
61.8%
SIG5RX Combination of SIG5 & RX 38.9% 3.4%
c
45.0%
COL10RX Combination of COL10 & RX 52.6% 3.9%
c
45.0%
FOB1SIG5RX Combination of FOB1SIG5 & RX 51.5% 18.3%
c
45.0%
FOB50RX Combination of FOB50 & RX 2.6% 0.5%
c
71.8%
SIG50RX Combination of SIG50& RX 11.8% 0.3%
c
55.0%
COL50RX Combination of COL50& RX 25.9% 0.4%
c
55.0%
FOBSIG50RX Combination of FOBSIG50 & RX 13.2% 0.5%
c
55.0%
FVCAMP Fruit & Vegetables campaign d) 0% —
FVCAMPRX Combination of FVCAMP & RX d) 0%
c
—
DRE1 Digital Rectal Exam annually
a
17.6% 0% 50%
DRE1RX Combination of DRE1 & RX 17.6% 1.8%
c
50%
Notes:
Subscripts 1,2,5,10 (eg: SIG5] in the intervention column denote the frequency of screening in years.
Subscript 50, denotes a one off intervention at age 50.
RX denotes the availabily of treatments for cancers in addition to the intervention program.
Efficacy varied slightly between regions due to demographic differences.
Efficacy considered on an age-sex specific basis.
a) Denotes colonoscopy performed on all positive tests, with subsequent removal of lesions or polyps if discovered.
b) Including surgical, radiotherapy and chemotherapy.
c) In excess of decrease in CFR caused by treatment.
d) Varies by region
Ginsberg et al. Cost Effectiveness and Resource Allocation 2010, 8:2
/>Page 3 of 16
Estimates of efficacy of interventions (Table 1]
To date, there have only been four randomized trials on
Fecal Occult Blood Tests [35] (FOBT), the longest trial
based on 18 years of follow up [36] reported decreases
in incidence o f colorectal cancer of 20% and 17% for
annual and biennial screening respectively. Since these
randomized trials reported results of guaiac FOBT as
opposed to immunological tests, all the results in this
paper r elate to guaiac FOBT testing. Results from cur-
rent randomized sigmoidoscopy trials (a once-per-life-
time study performed in the UK and a penta-annual
USA study that included additional annual FOBT test-
ing), are not yet published. To date, there have been no
randomized trials of colonoscopy.
Evidence is not available from randomized trials of the
efficacy of various screening interventions (except for
FOBT). Therefore researchers often rely on modeling
techniques in order to estimate the effects of screening
for colorectal cancer. As a resu lt of variations in quality,
specification and parameter values, model results vary
considerably (as detailed in the opening paragraph of
the discussion).
Since no single model can be regarded as a “gold-stan-
dard”, we constructed our ownmodel using a spreadsheet
to estimate the effects of various screening interventions
aimed at the gene ral population aged 50 to 80 years old.
The model a llowed for examining the effects of varying
the frequency of screening and age at time of screening.
This model was based on demographic data from the
WHO AmrA region (i.e. Canada, Cuba and the USA)
and colorectal cancer incidence rates from the SEER reg-
istry in the USA for the period 1995-2000 [37]. Age-spe-
cific polyp incidence was estimated from prevalence data
based on the weighted average polyp prevalence from
studies on populations in the USA [38-46].
Age-specific rates of cancers originating in a denoma-
teous polyps were calculated under the consensus-based
ass umption that 70% of cancers originated in adenoma-
teous polyps [47,48] and that the average waiting time
for development of canc er was ten years [22,47-50]
(assumed normally distributed with a standard deviation
of four years). The incidence of polyps was matched
with future inci dence of cancers originating from polyps
in order to calculate the conversion rates from polyps to
cancers, taking into account intervening mortality. Thus
a proportion of polyps at each stage were assumed to be
potentially carcinogenic and placed in a waiting state
from which they were allowed to become malignant at a
constant rate. Cancers were assumed to wait for two
years in stage A and for one year in each of the three
subsequent stages, if left untreated [47,51,52].
Using stage-specific fatality rates, the expected number
of cancer cases and cancer fatality were estimated under a
baseline scenario of no screening. Data on sensitivity and
specificity of screening [47] was used to estimate the num-
ber of persons undergoing follow-up colonoscopy (assum-
ing 100% compliance after a positive test) and the number
undergoing polypectomy during the colono scopy. For
each intervention, based on the sensitivity, specificity and
frequency of screening, the model estimated the numb er
of polyps that would progress to cancers.
Despite their being some misgiv ings [53], our model
was based on the mainstream accepted wisdom [54]
that scree ning enables detection and removal of poten-
tially cancerous polyps, thereby reducing the incidence
of colorectal cancer even when cancer treatment was
not available.
When medical treatment is available, screening
enables detection of cancers at an earlier less-severe
stage, thus reducing case-fatality rates (CFR). It was
assumed that persons screened positive in areas which
lack availability of treatment will only benefit via reduc-
tion in incidence (via polyp removal) and not via
decreases in case-fatality rate due to the lack of treat-
ment. We assume d that there would not be a change to
more frequent protocols in persons who had a polyp
removed.
These modeled intervention-specific estimates of CFR
reductions, together with estimates of incidence reduc-
tions (Table 1) form the main inputs into a population
based model described later on in this article.
The eff ectiveness of the fruit and vegetable campaign
was calcul ated fro m the results of the campaign in V ic-
toria, Australi a [55], which achieved an increased intake
of around 12.4% by weight in fruit and vegetable con-
sumption. Assuming each 80 mg increase in average
regional daily consumption results in a 1% decrease
[95%CI, -2%, +3%) in colorectal cancer risk [24], this
translates into risk reductions ranging from 0.34% in
South America to 0.78% in Western Europe.
Validation of model
For a specific validation of the model, the estimated
decrease in incidence due to annual FOBT screening
was found to be almost equal to benc hmark data from
18-year follow up of the randomized controlled trial
after adjustment for the period during the trial when
screening was temporarily halted, as well as adjustment
for compliance [36].
For g eneral validity, across the various interventions,
the estimated decreases in incidence and fatality over
and above that due to treatment (Table 1) fell within
the 25th and 75
th
percent ile range of the many modeled
studies [47,49,56-73].
Compliancy
The effects of each intervention were modified by their
specific adherence or compliancy. The estimated
Ginsberg et al. Cost Effectiveness and Resource Allocation 2010, 8:2
/>Page 4 of 16
magnitude of compliancy that was calibrated into the
model w as based on r eported compliancy and assump-
tions as follows:-
Informat ion on compliance with FOBT screening pro-
tocols we re obtained from a d emonstration project for
annual screening [74] (i.e. 56.8%); biannual screening
was assumed to result in 5% higher compliance. Compli-
ance with screening by colonoscopy every 10 years, as
well as annual FOTB combined with sigmoidoscopy
every 5 years, was assumed to be the same as that found
for a pre-intervention pilo t study for sigmoidoscopy [75]
(i.e. 45%), the greater invasiveness and more intensive
preparations required for colonoscopy were assumed to
be balanced by the longer interval required between
screenings. Estimates of complian ce for one-off screen-
ing at age 50 years was assumed to be 10% higher than
that for repeated screening starting at age 50 and finish-
ing at age 80 (Table 1). Due to the d ifficulties of esti-
mating compliancy over a 30 year period, involving
between 4 and 30 screening visits, all estimates of com-
pliancy used in the model should be viewed as rough
approximations. Interventio n effectiveness was adjusted
for the compliance a ssuming a target coverage rate o f
100% for all regions.
Definition of the null scenario
There is little direct evidence regarding the natural his-
tory of colore ctal cancer in the absence of treatment.
One small study in the USA found a 4.2% ten-year sur-
vival rate in persons who refused treatment (n = 24), for
unstated reasons [76].
Our estimates of regional cancer incidence, mortality
and remission rates were based on aggregated country
datafromtheWHO.Incountrieswheremortalitydata
was incompletely reported, the WHO proxied estimates
of cancer mortality by estimating survival data based on
a function of the level of economic development of the
specific countries [77,78].
AfrE and AmrA have low and high remission rates as
a result of their treatment coverage rates (in the 30-69
age group) being respectively low [6.7%) and high [95%-
100%). Linear extrapolations were made to this data in
order to e stimate age-and-sex-specific remission (and
hence ten-year fatality) rates in the absence of treatment
(ie: 0% treated).
Ten-year remission and fatality rates were converte d to
annual hazards according to the following formulas [79]:
ln 1 remitting
1 years
ln 1 dying from colorectal
%%
0
and
ccancer
1 years
0
Similarly, based on data from the AmrA region, where
treatment coverage ranged from 90%-100%, linear extra-
polationsweremadetoestimateage-and-sex-specific
ten-year fatality and remission rates assuming complete
treatment of all colorectal cancers. The resutling esti-
mates of overall remission and fatality rates were used
for the various analysed treatment scenarios.
In 2000, the AmrA region of WHO was the only
region globally where any significant level of population
screening for colorectal cancer was being carried out
(personal communication, Wendy Atkin, UK Colorectal
Cancer Unit, St Marks Hospital, Middlesex). Based on
modeled estimates of the effectiveness of screening, the
observed incidence of colorectal cancer in AmrA was
adjusted to reflect the higher inci dence that would have
occurred if a small percentage of the population had not
been screened [80].
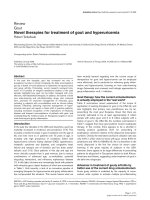
Population Model (PopMod) for colorectal cancer
Based on the estimates obtained from the epidemiologi-
cal model, population-level intervention effectiveness
was estimated using a popul ation state transition model
[78] simulating the regional population demography
(Additional file 1) and the eff ects of the disease in ques-
tion (Fig. 1).
Health state valuations (HSV), based on data used by the
WHO to estimate the Global Burden of Disease (GBD)
(Personal Communication K. Shibuya, WHO), were spe-
cified (on a 0-1 scale, where 1 equals full health) for time
spent in susceptible or diseases states (0.8 for diagnosis
and treatment, 0.8 for watchful waiting whether in a trea-
ted or not treated person, 0.25 for metastasis and 0.19 for
terminal stage). In keeping with the GBD methodology,
no additional disability weight was ascribed to a case
after a person had survived five years unless they pos-
sessed a permanent colostomy, which was ascribed a
HSV of 0.79 as a result of perforation of the colon occur-
ring in 0.129% [48,56-59,64,66,70,71] of colonoscopies
and an assumed 9% of all colorectal cancer related surgi-
cal procedures.
Based on the categories “treated and survived” ,
“treated and died” , “not treated and died”, “died from
background causes”, the weighted average age-and-sex-
specific health state valuation were calculated for the
null scenario, the complete treatment scenario and the
scenarios of screening with treatment.
For each scenario, the initial population data inputted
into the model, was projected forward for a period of
100 years. The differ ence in the total nu mber of healthy
years between each intervention simulation and the
baseline (null) scenario was the estimate of population-
level health gain d ue to the intervention. In keeping
with the standardized WHO-CHOICE methodology
DALYs averted were calculated a nd are discounted at a
rate of 3% per a nnum and are age-weighted by weight-
ing a year of healthy life lived at younger and older ages
lower than a year lived at other ages [81].
Ginsberg et al. Cost Effectiveness and Resource Allocation 2010, 8:2
/>Page 5 of 16
Costs of Colorectal cancer interventions
Costs for the 10-year intervention implementation per-
iodwerediscountedat3%andexpressedininterna-
tional do llars ($I) at year 2000 price leve ls. An
international dollar is a unit of currency with purchasing
power e quivalent to a US dollar in the USA [11]. Cost s
in local currency units were converted to international
dollars using purchasing-power-parity (PPP) exchange
rates. Expressing costs in international dollars facilitates
more meaningful comparisons across subregions by
adjusting for differences in local relative prices.
For the annual FOBT, program costs (excluding the
actual costs of the FOBT), were based on an estimate of
around 27 administrative posts (for notification, sending
out test kits, results etc.) per 5 million population in
each region in addition to a budget for me dia, office
space and other items. Program costs for the other
screening interventions and regions were adjusted to
reflect the type of intervention (eg: no test kits need to
be sent for sigmoidoscopy or colonoscopy), the interven-
tion’s relative frequency and the size of the target popu-
lation. In less developed sub-regions (ie: regions
characterized by mortality stratum D or E in reference
15) it was assumed that in the absence of a postal sys-
tem, health workers would deliver t he FOBT kits by
hand and the kits would be returned to laboratories en
bloc from the district health centers. In addition, each
program had a provision for staff training and national
posts for management, monitoring and evaluation based
on the British NHS Cancer Screening Programs.
Quantities (manpower time, rooms, drugs, disposable
and reusable equipment) for screening tests and treat-
ment procedures were based on the WHO Collaborating
Centre for Essential Health Te chnologies data base. Pro-
vision was made for pre-ope rative work-up tests such as
CT scan and Chest X-rays [82]. If further data was
available from published literature we adjusted the man-
power time to be in accord with the published literature.
For example, recent literature estimated 145.5 and 165.5
minutes average time for a colectomy [83] with and
without colostomy respectively, bringing the cost of the
operation up to $I845 and $I906 in AmrA, i ncluding a
provision f or an assumed 10% of procedures to be car-
ried out under combined spinal-epidural anaesthesia
[84]. Proctectomies were assumed to take 60 minutes
longer than colectomies.
Estimates of direct cost per test (excluding programme
and training overheads) for the AmrA region of $I 4, $I
71 and $I 190 for FOBT, diagnostic sigmoidoscopy and
diagnostic colonosc opy, respectively, were similar to
those reported in Holland [65] and Israel [72]. Colono-
scopy costs included not only preparation, obtaining
consent, procedure and recovery t ime but also one f ull
hour for pre-screening counseling. Discounted costs of
lifetime care for perforated colon were assumed to be
around $I 13,000 [58], consisting of hospitalization,
anesthesia, colon suture, elec trocardiography, X-ray and
initial care costs.
Unit costs of secondary and tertiary hospital in-patient
days and out-patient visits were based o n an econo-
metric analysis of a multinational dataset of hospital
costs [3]. Prices of pharmaceuticals were obtained from
international [ 85] or from British National Health Ser-
vice prices [86] adjusted to year 2000 price levels.
Annual resource use per case on a stage-specific basis (i.
e. initial, watchful waiting and terminal) was based on
Medicare data from the USA (personal communication,
Martin L. Brown, Health Services and Economic Branch,
National Cancer Institute, Bethesda MD.). Liver function
tests were assumed to be given monthly for one year,
CT scans a nnually for three years, carcino-embrionic
antigen tests every 6 months for three years, chest
Figure 1 POPMOD model of Colorectal Cancer. ic is colorectal cancer incidence rate, rc is colorectal cancer remission rate, m is background
mortality rate, fx is colorectal cancer mortality rate.
Ginsberg et al. Cost Effectiveness and Resource Allocation 2010, 8:2
/>Page 6 of 16
X-rays annually for 3 years and follow-up colonoscopies
biannually [49].
Average unit costs (see Additional file 2) were multi-
plied by the number of units of care required by the
sub-regional population, to estimate the total annual
intervention cost.
Decision rules
An intervention was termed very cost-effective and cost-
effective if the cost per DALY was less than the per
capita GNP or between 1 and 3 times per capita G NP,
respectively. If the cost per DALY was m ore than three
times the GNP per capita, then the intervention was
regarded as not cost effective [87]. Sensitivity analyses
were performed to generate costs per DALY under sce-
narios with no age-weighting and without discounting at
3% per annum.
For each region, graphical plots for each intervention
of DALYs gained against costs were made in order to
identify the most cost-effective interventions. The lines
joining the loci of the most cost-effective points form
the “expansion path”, which reveals the mix of interven-
tions that would be chosen on cost-effective grounds for
any given level of resource availability [5].
Results
We present the results for three representative regions
(Table 2]: AmrA, characterised according to the WHO
rubrick [1] by high income ($I 31,477 GNP per head)
and low child and adult mortality, EurC, characterised
by lo w income ($I 6,916 GNP per head), low child and
high adult mortality and AfrE, characterised by very
low income ($I 1,576 GNP per head), high child and
very high adult mortality.
AmrA (Canada, United States Of Ameri ca, Cuba)Two
main groups of interventions emerge in the AmrA
region (Fig. 2) which are based on the results presented
in Table 2.
The first consists of the screening interventions (with
surgical removal of polyps) in an environment where
treatment (in the form of surgery, radiotherapy and che-
motherapy) was not provided. Campaigns to increase
fruit and vegetable consumption are close to the expan-
sion path (indicating the lowest costs per DALY for that
level of resource usage) despite the omiss ion of benefits
from decreases in diseases besides colorectal cancer.
However such an intervention only accounted for a
small absolute reduction in DALYs. One-off colono-
scopy at age 50 falls on the expansion path. However,
because of the variability inherent in both the effective-
ness (i.e: increase in DALYS saved) and cost estimates,
it is unlikely that there are any significant differences in
the cost per DALY generated by any of the screening
methods, implying no one single method can be thought
of a s dominant. Interve ntions in this group are all very
cost effective (including t he use of the DRE) shown by
their f alling to the right of the broken-arrow line indi-
cating t he points where the cost per DALY are exactly
equal to the GDP per capita.
The second group consists of screening interventions
with treatment. Interventions in this group cost more and
yield more DALYs than interventions in the first (no-treat-
ment) group, although they are still very cost effective. In
this treatment scenario, annual FOBT combined with sig-
moidoscopy every five years is now indicated by being on
the expansion path (Fig. 3), having an incremental cost
effectiveness ratio (ICER) well below the GNP per head
threshold. Once again due to variations in the estimates,
no single intervention combined with treatment can be
thought of as being superior to the others.
EurC (Belarus, Estonia, Hungary, Kazakhstan, Latvia,
Lithuania, Republic of Moldova, Russian Federation,
Ukraine)
Again two main distinct groupings emerge (Fig. 4)
which are based on t he results presented in Table 2.
However the no-treatment group is less homogeneous
than in AmrA. The one off screening interventions at
age 50 (colonoscopy, sigmoidoscopy with and without
FOBT) were very cost-effective as was sigmoidoscopy
every five years and colonoscopy every ten years. The
other screening interventions (including the DRE) were
just cost-effective, falling between the dotted and dashed
lines repr esenting the three and one times the GNP per
head thresholds respectively.
All the screening interventions with treatment are very
cost eff ective falling to the right of the d ashed line. As
more resources become available the expansion path
shifts interventions in the current scenario (charac-
terised by medium levels of treatment coverage ) to uni-
versal treatment, then to sigmoidoscopy at age 50,
colonoscopy at age 50, to colonoscopy screening every
10 years, gaining the most DALYS when a combined
FOBT and sigmoidoscopy programme is complemented
by full treatment (Fig. 5).
The ICER of moving along the expansion path showed
that all the interventions up to supplying colonoscopies
every 10 years to be very cost- effective. However expan-
sion to a combined FOBT and sigmoidoscopy interven-
tionmightbeconsideredasjustcosteffectiveasits
ICER is between one and three times the per capita
GNP. Once again, no single intervention combined with
treatment dominates.
AfrE (Botswana, Burundi, Central African Republic,
Congo, Côte d’ Ivoire, Democratic Republic Of The
Congo, Eritrea, Ethiopia, Kenya, L esotho, Malaw i,
Mozambique, Namibia, Rwanda, South Africa, Swazi-
land, Uganda, United Republic of Tanzania, Zambia,
Zimbabwe)
Ginsberg et al. Cost Effectiveness and Resource Allocation 2010, 8:2
/>Page 7 of 16
As a result of cost differentials associated with pro-
gramme implementation, there is a wide range of costs
between screening programmes without treatment (Fig.
6) which are based on the results presented in Table 2.
All of the screening interventions (in the no treatment
scenario) were found to be not cost effective (ie: they
fall to the left of the dotted arrowed line) due primarily
to the lower incidence of the disease in the region.
Universal treatment, (ie: 100% treatment scenario),
colonoscopy at age 50 (with polyp removal), colono-
scopy every 10 years and sig moidoscopy every five years
combined with annual FOBT with treatment appear on
the expansion path, only the first three being cost-effec-
tive (ie: falling b etween the dotted and dashed lines)
(Fig. 7). However, using the yardstick that any interven-
tionwhoseICERisinexcessofthreetimestheper
capita GNP is not cost effective, then adding any of the
screening programme s to treatment will not be consid-
ered as being cost effectiv e. Screening persons aged
under 50 years old yielded less favourable cost-effective-
ness ratios than commencing screening at age 50 years.
Sensitivity analysis
Applying age weights to health effects is not without
controversy [79]. Removing age weighting results in an
overall decrease in the cost per DALY of interventions
(Additional file 3). In AmrA, Colonoscopy every 10
years (with polyp removal) joins the expansion path, in
Table 2 Average Cost per DALY in relation to the null of interventions to reduce Colorectal Cancer in selected WHO
subregions
AFRE AMRA EURC
Intervention COST DALYS saved COST
per
DALY
COST DALYS
saved
COST
per
DALY
COST DALYS
saved
COST
per
DALY
I$ (mill) I$ I$ (mill) I$ I$ (mill) I$
Current Scenario (a) 116 27,546 4,206 64,937 14,135,241 4,594 4,677 1,801,461 2,596
FOB1 4,193 98,525 42,557 11,745 1,603,126 7,326 5,440 548,649 9,915
FOB2 2,222 66,502 33,410 6,448 1,082,872 5,954 2,954 370,055 7,984
SIG5 1,407 90,077 15,620 6,807 1,463,474 4,651 2,716 492,378 5,516
COL10 1,561 117,977 13,231 7,858 2,020,645 3,889 3,070 661,542 4,641
FOB1SIG5 4,915 121,374 40,491 15,989 1,969,383 8,119 7,069 665,773 10,617
FOB50 380 12,222 31,055 1,082 198,064 5,465 526 59,843 8,786
SIG50 531 41,910 12,669 2,446 679,950 3,597 984 205,514 4,786
COL50 1,040 91,092 11,415 5,027 1,491,646 3,370 1,980 449,523 4,404
FOBSIG50 478 46,981 10,183 3,032 762,325 3,977 860 230,391 3,734
RX 1,394 837,066 1,666 73,225 14,991,673 4,884 12,145 4,200,308 2,891
FOB1RX 5,461 912,458 5,984 77,579 16,300,533 4,759 16,481 4,630,614 3,559
FOB2RX 3,524 890,163 3,959 74,346 15,929,042 4,667 14,328 4,507,099 3,179
SIG5RX 2,706 896,387 3,019 75,839 15,864,896 4,780 14,100 4,518,157 3,121
COL10RX 2,844 909,822 3,126 76,031 16,131,444 4,713 14,301 4,604,861 3,106
FOB1SIG5RX 5,110 922,577 5,539 74,917 16,382,245 4,573 15,584 4,672,483 3,335
FOB50RX 1,758 850,239 2,067 74,130 15,200,680 4,877 12,633 4,275,966 2,954
SIG50RX 1,897 867,915 2,185 74,793 15,433,538 4,846 12,975 4,357,438 2,978
COL50RX 2,377 899,415 2,643 76,236 15,881,346 4,800 13,780 4,509,360 3,056
FOBSIG50RX 2,188 871,888 2,509 75,660 15,494,325 4,883 14,712 4,377,287 3,361
FVCAMP 275 7,618 36,074 366 84,085 4,354 360 17,804 20,222
FVCAMPRX 1,681 842,102 1,996 73,476 15,037,102 4,886 12,513 4,210,885 2,972
DRE1 818 9,438 86,676 2,370 153,861 15,401 1,008 52,939 19,038
DRE1RX 2,421 846,382 2,861 75,207 15,145,147 4,966 13,299 4,259,810 3,122
Cost-effective threshold 4,728 94,431 20,748
Very cost-effective threshold 1,576 31,477 6,916
(Discounted at 3% per annum & Age-Weighted).
Note: Interventions that fall on expansion path are in bold type.
(a) The current scenario represents the interventions which are currently being provided in the sub-regions. This differs from the reference strategy, the null,
where no intervention or treatment is provided.
Ginsberg et al. Cost Effectiveness and Resource Allocation 2010, 8:2
/>Page 8 of 16
Figure 2 Cost-Effectivene ss of Interventions for colorectal Cancer in AMRA su b-region. Note: Interventions falling above the broken line
are not cost-effective, Interventions falling between the broken and continuous line are cost-effective. Interventions falling below the continuous
line are very cost effective.
Figure 3 Interventions falling on Expansion path for AMRA sub-region.
Ginsberg et al. Cost Effectiveness and Resource Allocation 2010, 8:2
/>Page 9 of 16
Figure 4 Cost-Effectiveness of Interventions for colorectal Cancer in EURC sub-region. Note: Interventions falling above the broken line are
not cost-effective, Interventions falling between the broken and continuous line are cost-effective. Interventions falling below the continuous line
are very cost effective.
Figure 5 Interventions falling on Expansion path for EURC sub-region.
Ginsberg et al. Cost Effectiveness and Resource Allocation 2010, 8:2
/>Page 10 of 16
EurC annual FOB with sigmoidoscopy every 5 years
(with polyp removal and treatment) joins the expansion
path. For AfrE, sigmoidoscopy at age 50 (with polyp
removal and treat ment) joins th e expansion path. The
remo val of age-weighting means that treating everybody
becomes very cost-effective, falling below the GNP per
capita threshold.
When both discounting and age-weighting are
removed (Additional file 4), costs per DALY fall s till
further. The expansion path of AmrA consists of colo-
noscopy at age 50, colonoscopy every 10 years, and sig-
moidoscopy every five years combined with annual
FOBT (with polyp removal and treatment). In EurC the
expansion path consists of treatment only, colonoscopy
every 10 years with treatment and sigmoidoscopy every
five years combined with annual FOBT with treatment.
In AFRE, sigmoidos copy at age 50 with and without
annual FOBT joins universal treatment as being very
cost-effective.
Discussion
Cost-effectiveness estimates for developed countries
(mainly USA and countries in Europ e) have reported a
wide range of incremental costs per life year for the col-
orectal cancer interventions examined in this, over and
above that of treatment alone. Baseline costs per life
year (in USD at 2000 price levels) relative to a no
screening strategy for both the one-off and repetitive
screening vary considerably. Seven studies reported
costs p er life year of $20,000 or more [49,58-60,69-71],
eight reported in the range $10,000 - $19,999
[47,48,56-59,62,70], three between $5,000 - $9,999
[55,57,58] and three between $0-$4999 [56,64, 88]. Some
models e ven indicated incremental cost-savings (along-
side effectiveness gains), both for one-off [72] and
repeated screening interventions [56,72].
Such wide ranges in the cost-ut ility ratio and the sub-
sequent lack of dominance of any one screening mode
(reflected by dif ferent rankings between the screening
Figure 6 Cost-Effectiveness of Interventions for colorectal Cancer in AFRE sub-region. Note: Interventions falling above the broken line
are not cost-effective, Interventions falling between the broken and continuous line are cost-effective. Interventions falling below the
continuous line are very cost effective.
Ginsberg et al. Cost Effectiveness and Resource Allocation 2010, 8:2
/>Page 11 of 16
methods) are a consequence of the heterogeneous nat-
ure of the model specifications (on the effectiveness
side), variations in the duration of operation of screen-
ing programmes and wide variations in t he estimates of
the interventions unit costs. These ranged considerably,
with sigmoidoscopy costing between six [69] to 27 times
[70] that of FOBT, colonoscopy costing between 10 [72]
to 100 times that of FOBT [57,66]. Our estimates
showed sigmoidoscopy and colonoscopy costs to be
between 18 and 48 times that of the basic FOBT test.
Additional research is clearly needed on estimating
screening programme costs as these considerably affect
the cost per DALY outcomes, especially in developing
countries.
Our epidemiological model was simpler than most of
published models and lack ed refinements such as taking
into account the distribution of multiple polyps and
biphasic polyp dwelling times [68]. In addition, our
model did not include pro vision for more frequent
screening of persons identified as having a polyp or with
a familial history of CRC.
While our model was based on regional specific age
and gender distributions, information on age-specific
polyp incidence distribution was based only on available
USA data. If a developing country’ s relati ve distribut ion
of polyp incidence is skewed to a younger age than the
USA, then this would mean that the screening pro-
gramme would have a lower efficacy (unless screening
ages were adjusted) and so our cost-effective ness ratios
are lik ely to be upwardly biased. On the other hand, our
somewhat optimistic compliancy assumption that all
persons screened positive on FOBT or Sigmoidoscopy
would receive a subsequent colonoscopy served to
downwardly bias the presented cost per DAYS, as some
cases are likely to be lost to follow-up in practice.
Our estimated cost-effectiveness ratios for the incre-
mental addition of various screening programmes to
treatment (for comparability with the literature, dis-
counted at 3% but not age-weighted; see Additional file
2) in AmrA of $800-$2,200 per DALY (for screening
from age 50 to 80) and $2,400-$3,500 (for one-off inter-
ventions) fell towards the lower end of the wide spec-
trum of results presented in the opening paragraph o f
this discussio n. This could be attributed to a v ariety of
causes, such as the use of economic costs as opposed to
charges or prices for procedures and the longer duration
(relative to much of the literature) of the time-horizon
used to evaluate our interventions. Inclusion of morbid-
ity gains in our denominator reduced still further our
ratios, although this was somewhat counterbalanced by
our use of healthy life years in the denominator (as
opposed to l ife years as reported in most of the
literature).
In general the following policy recommendations
could be inferred from our results. In subregions char-
acterised by high income, low mortality and high
Figure 7 Interventions falling on Expansion path for AFRE sub-region.
Ginsberg et al. Cost Effectiveness and Resource Allocation 2010, 8:2
/>Page 12 of 16
existing treatment coverage (eg: AmrA subregion), both
the incremental (ie: the additional cost per DALY of
adding a screening programme to the existing treatment
provision) and gener al (ie: compared to the null) cost-
effect iveness results point to the very cost -effective nat-
ure o f the screening intervention, although no particular
specific intervention is indicated as being dominant.
In subregions characterised by low in come, low mor-
tality with existing treatment c overage around 50% (eg:
EurC subregion), expanding treatment with or without
combining it with screening programmes appears to be
cost-effective or very cost-effective. Abandoning treat-
ment in favour of funding screening programmes that
would operate in a no treatment scenario would not be
a cost-effective measure.
In subregions which have low income, low mortality
and l ow treatment levels (eg; AfrE subregion), the best
strategy is to provide resources to treat persons with
colorectal cancer as opposed to providing a screening
programme.
UseoftheDREalonewasverycost-effectiveinthe
AmrA subregion and cost -effective in EurC. However it
has low efficacy and provides a low level of absolute
DALY gains. Despite its low technological approach,
DRE is not cost-effective in the low incide nce AfrE sub-
region. However, the low cost simple DRE (both with
and without follow-up diagnostic colonoscopy), suffers
from a lack of direct evidence that the exam reduces
mortality from colorectal cancer, our modelled efficacy
being based on a sing le no-significant result (OR = 0.96,
95% CI 0.56-1.70) from a case control study from north-
ern California [18]. Sensitivity is low, as fewer than 10%
of colorectal cancer causing polyps are within reach of
the examining finger. There is t herefore no solid basis
for recommending this method as a stand alone screen-
ing i ntervention for colorectal cancer. Moreo ver, a com-
prehensive assessment of this intervention should
include its effect on reducing mortality from prostate
cancer.
Like the digital rectal examination, the in troduction of
a fruit and vegetable campaign gains fewer DALYS then
any of the screening interventions. Such a campaign was
however found to be very cost effective in AmrA even
without the inclusion of additional benefits resulting
from decreases in other diseases. The fruit and vegetable
campaign was marginally cost-effective in EurC, but was
not cost-effective a t all in AfrE. However, the external
validity of applying the effectiveness results from one
health promotion campaign in Australia [55] to other
regions of the world can be questioned.
The20%pricesubsidywillactuallybelesseffective
than health promotion in increasing fruit and vegetable
consumption, and hence in reducing colorectal cancer.
Estimating the economic cost of such an intervention is
beyond the scope of this paper. Moreover, an evaluation
of such an intervention requires the effectiveness bene-
fits of reductions in heart disease, stroke and other can-
cers to be included. The cost per DALY, however, might
be underestimated since the income freed up by the
food subsidy might result in increased consumption of
red meat, which could well be a risk factor for colorectal
cancer [26,27].
Our use of a single measure of relative risk reduction
for each age and gender specific intervention simplifies
the reality, where the risk reduction and subsequent
cost-effectiveness ratio can differ depending on the
socio-economic context of the screening subg roups [88].
One could also argue that present models on colorectal
cancer screening are inadequa te for aiding public health
decision-making because the efficacy evidence is too
preliminary for any screening modal ity other than
FOBT [89]. Lack of s uch randomized controlled trial
evidence precluded an evaluation of immunological
FOBT testing, which is likely to yield lower costs per
QALY than guaiac-based tests [61], due to the higher
sensitivity of immunological FOBT to detect colorectal
neoplasms [90-92] outweighing increased unit costs.
Our analysis also did not co nsider the options of target-
ing screening to high-risk populations which despite
reducing the overall DALY gains may well increase the
cost-effectiveness of the interventions [51].
The C EAs presented represent first order poi nt esti-
mates of various interventions. When allowance is made
for variations of the estimates by sensitivity analysis
then it appears there is no clear disc ernable difference
in terms of cost-effectivene ss between the major screen-
ing options. Perhaps another key factor in deciding what
option or mix of options to adopt, would be those
interventions which have the highest expected attainable
coverage rates. Adoption of screening policies between
the ages of 50 and 80 will only eradicate a small portion
(between 14%-24%) of the existing colorectal cancer
burden, since the application of the compliancy rate to
the intervention efficacy, even in the case o f colono-
scopy every 10 years will only result in a 24.1% reduc-
tion in i ncidence. One-off screening polici es will reduce
an even lower percentage of the total disease burden.
The cost-effectiveness ratios are insensitive to changes
in compliancy, particularly in scenarios that include
access to treatment and where programme operational
overheads are low. Basically, the increases or decreases
in programme efficacy resulting from changes in com-
pliancy are somewhat counterbalanced (except for the
programme cost overheads) by decreases or increases in
costs.
The cost-effectiveness ratios are also biased upwards
(or downwards) to the extent that transport costs and
costs of work lost due to treatment exceed (or are
Ginsberg et al. Cost Effectiveness and Resource Allocation 2010, 8:2
/>Page 13 of 16
exceeded by) the transport costs and costs of work lost
due to screening [93,94].
Decisions to adopt interventio ns are usually made by
health services and gove rnments at the country level.
Although the model used in this analysi s is based on
regions, the parameters defining the model can be
adjusted to country level.
Additional file 1: Selected Variables by Region.
Additional file 2: Unit Cost ($ International) by Selected Regions.
Additional file 3: Average Cost per DALY in relation to the null of
interventions to reduce Colorectal Cancer in selected WHO sub-
regions.
Additional file 4: Average Cost per DALY in relation to the null of
interventions to reduce Colorectal Cancer in selected WHO sub-
regions.
Abbreviations
CEA: Cost Effectiveness Analysis; CFR: Case Fatality Rate; CHOICE: Choosing
Interventions that are Cost-Effective; DALY: Disability Adjusted Life Year; DRE:
Digital Rectal Exams; EIP: Evidence and Information in policy; FOBT: Fecal
Occult Blood Test; GBD: Global Burden of Disease; GCEA: Generalized Cost
Effectiveness Analysis; GNP: Gross National Product; HSV: Health Status
Valuation; ICER: Incremental Cost Effectiveness Ratio; Ln: Natural Logarithm;
POPMOD: A state transitional population model; PPP: Purchasing Power
Parity; HO: World Health Organization.
Acknowledgements
The authors wish to thank the following for contributing data and/or
knowledge to the study. Taghreed Adam (WHO/EIP), Wendy Atkin, UK
Colorectal Cancer Unit, Middlesex), Melanie Bertram (WHO/EIP), Martin L.
Brown (NIH, Bethesda MD), Peter Heinmann (Essential Health Technologies
Medical Research Council, Cape Town). Cedric Mahe (IARC, Lyon), Julia
Patnick (NHS Screening Programme, Sheffield), Arnaud Roth (Geneva
University Hospital), Kenji Shibuya (WHO/EIP), RJC Steele (Ninewells Hospital
and Medical School, Dundee).
Author details
1
Costs, Effectiveness, Expenditure and Priority Setting, World Health
Organization, Geneva, Switzerland.
2
Chronic Diseases Prevention and
Management, World Health Organization, Geneva, Switzerland.
Authors’ contributions
GG collected data, designed, calculated and wrote up the study. SL provided
technical assistance with the modelling and commented on earlier drafts. JL
provided technical assistance with the modelling and wrote up the study. BJ
provided assistance on the costings. CS provided assistance related to the
medical and epidemiological aspects.
All authors have read and approved the final manuscript.
Competing interests
This study was undertaken by persons who were on the salaried staff of the
WHO at the time of the study. None of the authors have any competing
interests.
Received: 29 April 2008 Accepted: 17 March 2010
Published: 17 March 2010
References
1. WHO: The World Health Report 2001. Mental Health; New Understanding,
New Hope WHO Geneva 2001.
2. Johns B, Baltussen R, Hutubessy R: Programme costs in the economic
evaluation of health interventions. Cost Eff Resour Alloc 2003, 1(1):1.
3. Adam T, Evans DB, Murray CJ: Econometric estimation of country-specific
hospital costs. Cost Eff Resour Alloc 2003, 1(1):3.
4. Adam T, Koomanchap MA: Cost-effectiveness analysis: can we reduce
variability in costing methods? Int J Tech Assess Health Care 2002,
19:407-20.
5. World Health Organization: Making choices in health: WHO guide to cost-
effectiveness analysis. WHO GenevaTan-Torres Edejer T, Baltussen R, Adam
T, Hutubessy R, Acharya A, Evanns DB, Murray CJL 2003.
6. Murray CJ, Evans DB, Acharya A, Baltussen RM: Development of WHO
guidelines on generalized cost-effectiveness analysis. Health Econ 2000,
9:235-51.
7. Hutubessy RC, Baltussen RM, Torres-Edejer TT, Evans DB: Generalised cost-
effectiveness analysis: an aid to decision making in health. Appl Health
Econ Health Policy 2002, 1:89-95.
8. Baltussen RM, Hutubessy RC, Evans DB, Murray CJ: Uncertainty in cost-
effectiveness analysis. Probabilistic uncertainty analysis and stochastic
league tables. Int J Technol Assess Health Care 2002, 18:112-9.
9. Hutubessy RC, Baltussen RM, Evans DB, Barendregt JJ, Murray CJ: Stochastic
league tables: communicating cost-effectiveness results to decision-
makers. Health Econ 2001, 10:473-7.
10. Baltussen RM, Adam T, Tan Torres T, Hutubessy RC, Acharya A, Evans DB:
Generalized Cost-Effectiveness Analysis: A Guide. Global Programme on
Evidence for Health Policy Geneva, World Health Organization 2002.
11. Murray CJ, Lauer JA, Hutubessy RC, Niessen L, Tomijima N, Rodgers A,
Lawes CM, Evans DB: Effectiveness and costs of interventions to lower
systolic blood pressure and cholesterol: a global and regional analysis
on reduction of cardiovascular-disease risk. Lancet 2003, 361:717-25.
12. WHO-CHOICE: Choosing Interventions that are Cost Effective. [http://
www.who.int/choice/en/], Accessed Feb 3rd 2010.
13. Baltussen R, Adam T, Tan-Torres Edejer T, Hutubessy R, Acharya A, Evans DB,
Murray CJL: Chapter 1. What is Generalised Cost-Effectiveness Analysis?
Making Choices in Health. WHO Guide to Cost-Effectiveness Analysis WHO
GenevaTan-Torres Edejer T, Bltussen R, Adam T, Hutubessy R, Acharya A,
Evans DB, Murray CJL 2003.
14. WHO: The World Health Report 2002. Reducing Risks, Promoting Healthy
Life WHO Geneva 2002.
15. Global Burden of Disease Regions used for WHO-CHOICE Analyses.
WHO [ />Accessed 11th November 2009.
16. Fulfilling the potential of Cancer Prevention and Early Detection.
National Cancer Policy Board, Institute of Medicine 2003 [.
edu/books/ETC].
17. Lock K, Pomerleau J, Causer L, McKee M: Inadequate Fruit and Vegetable
Consumption. Draft Sept 2001. European center on Health of Societies in
Transition London School of Hygiene and Tropical Medicine, London.
18. Herrinton LJ, Selby JV, Friedman GD, Queensberry CP, Weiss NS: Case-
control study of digital-rectal screening in relation to mortality from
cancer of the distal rectum. Am J Epidemiol 1995, 142:961-4.
19. Pignone M, Rich M, Teutch SM, Berg AO, Lohr KN: Screeing for colrectal
cancer in adults at average risk: A summary of evidence for the U.S.
preventive services task force. Annals of Internal Medicine 2002,
137:132-41.
20. Winawer SJ, Fletcher RH, Miller L, Godlee F, Stolar MH, Mulrow CD,
Woolf SH, Glick SN, Ganiats TG, Bond JH, Rosen L, Zapka JG, Olsen SJ,
Giardiello FM, Sisk JE, Van Antwerp R, Brown-Davis C, Marciniak DA,
Mayer RJ: Colorectal cancer screening: clinical guidelines and rationale.
Gastroenterology 1997, 112:594-642, Published errata in Gastroenterology
1997; 112: 1060 and 1998; 114: 625.
21. Byers T, Levin B, Rothenberger D, Dodd GD, Smith RA: American Cancer
Society guidelines for screening and surveillance for early detection of
colorectal polyps and cancer: update 1997. CA Cancer J Clin 1997,
47:154-60.
22. Fletcher RH: The end of barium enemas? N Engl J Med 2000, 342:1823-4.
23. Winawer SJ, Stewart ET, Zauber AG, Bond JH, Ansel H, Waye JD, Hall D,
Hamlin JA, Schapiro M, O’Brien MJ, Sternberg SS, Gottlieb LS: A comparison
of colonoscopy and double-contrast barium, enema for surveillance
after polypectomy. National Polyp Study Work Group. N Engl J Med 2000,
342:1766-72.
24. Economics Research Service: United Nations Department of Agriculture.
International Food Consumption Patterns [ />InternationalFoodDemand/Index.asp?view=PEF#IFD], Accessed November
9th 2009.
Ginsberg et al. Cost Effectiveness and Resource Allocation 2010, 8:2
/>Page 14 of 16
25. Regmi A, Deepak MS, Seale JL, Bernstein J: Cross-Country Analysis of Food
Consumption Patterns. Changing Structiure of Global Food Consumption
and Trade/WRS-01-1 Economic Research Service USDA.
26. Norat T, Lukanova A, Ferrari P, Riboli E: Meat consumption and colorectal
cancer risk: an estimate of attributable and preventable fractions. IARC.
Nutrition and Lifestyle: Opportunities for Cancer prevention IARC Scientific
Publications No 156. IARC, Lyon, FranceRiboli E, Lambert R 2002, 223-5.
27. Norat T, Lukanova A, Ferrari P, Riboli E: Meat consumption and colorectal
cancer risk: dose-response meta-analysis of epidemiological studies. Int J
Cancer 2002, 98:241-56.
28. IARC Handbooks of Cancer Prevention: Weight Control and Physical
Activity. IARC Press, Lyon, France 2002, 6.
29. Schatzkin A, Lanza E, Corle D, Lance P, Iber F, Caan B, Shike M, Weissfeld J,
Burt R, Cooper MR, Kikendall JW, Cahill J: Lack of effect of a low-fat, high-
fiber diet on the recurrence of colorectal adenomas. Polyp Prevention
Trial Study Group. N Engl J Med 2000, 342:1149-55.
30. Frank L, Andersen M, Schmidt T: Obesity relationship with community
design, physical activity, and time spent in cars. Am J Prev Med 2004,
27:87-96.
31. Ewing R, Schmid T, Killingworth R, Zlot A, Raudenbusch S: Relationship
between urban sprawl and physical activity, obesity, and morbidity. Am
J Health Promotion 2003, 18:47-57.
32. Surgeon General: The Health Consequences of Smoking. A report of The
Surgeon General. Executive Summary CDC, Atlanta 2004.
33. IARC Handbooks of Cancer Prevention: Non-Steroidal Anti-Inflammatory
Drugs Volume 1. IARC Press, Lyon, France 1997.
34. Eichholzer M, Luthy J, Moser U, Fowler B: Folate and the risk of colorectal,
breast and cervix cancer: the epidemiological evidence. Swiss Medical
Weekly 2001, 131:539-49.
35. Towler BP, Irwig L, Glasziou P, Weller D, Kewenter J: Screening for
Colorectal Cancer Using the Faecal Occult Blood Test, Hamoccult
(Cochrane Review). The Cochrane Library Chichester, UK: John Wiley & Sons,
Ltd 2003, 4.
36. Mandel JS, Church TR, Bond JH, Ederer F, Geisser MS, Mongin SJ,
Snover DC, Schuman LM: The effect of fecal occult-blood screening on
the incidence of colorectal cancer. N Engl J Med 2000, 343:1603-7.
37. SEER cancer registry data. [ />Accessed 4th March 2004.
38. Rex DK, Smith JJ, Ulbright TM, Lehman GA: Screening colonoscopy in
asymptomatic average-risk persons with negative fecal occult blood
tests. Gastroenterology 1991, 100:64-7.
39. Disario JA, Foutch PG, Mai HD, Pardy K, Manne RK: Prevalence and
Malignant Potential of Colorectal Polyps in Asymptomatic, Average-Risk
Men. American Journal of Gastroenterology 1991, 86:941-5.
40. Johnson DA, Gurney MS, Volpe RJ, Jones DM, VanNess MM, Chobanian SJ,
Avalos JC, Buck JL, Kooyman G, Cattau EL Jr: A prospective study of the
prevalence of colonic neoplasms in asymptomatic patients with an age-
related risk. Am J Gastroenterol 1990, 85:969-74.
41. Arminski TC, McClean DW: Incidence and Distribution of Adenomateous
Polyps of the Colon and Rectum based on 1,000 Autopsy Examinations.
Dis Colon Rectum 1964, 19:249-61.
42. Blatt LJ: Polyps of the colon and rectum. Dis Colon Rectum 1961, 4:277-82.
43. Rickert RR, Auerbach O, Garfinkle L, Hammond EC, Frasca JM:
Adenomatous lesions of the large bowel. An Autopsy Survey. Cancer
1979, 43:1847-57.
44. Correa P, Strong JP, Reif A, Johnston WD: The Epidemiology of Colorectal
Polyps. Cancer 1977, 39:2258-64.
45. Stemmerman GN, Yatani R: Diverticulosis and polyps of the large
intestine. Cancer 1973, 31:1260-70.
46. Chapman I: Adenomatous polypi of large intestine: incidence and
distribution. Ann Surg 1963, 157:223-6.
47. Wagner J, Tunis S, Brown M, Ching A, Almeida R: Cost-effectiveness of
colorectal cancer screening in average risk adults. Prevention and early
detection of colorectal cancer London. SaundersYoung G, Rozen P, Levin B
1996, 321-56.
48. Wagner JL, Beheny CJ, Tunis SR, Ching A: US Congress, Office of
Technology Assessment, Cost-effectiveness of Colorectal Cancer
Screening in Average-Risk Adults, OTA-BP-H-146. Washington, DC: U.S.
Government Printing Office 1995.
49. Bolin TD, Korman MG, Stanton R, Talley N, Newstead GL, Donnelly N, et al:
Positive cost effectiveness of early diagnosis of colorectal cancer.
Colorectal disease 1999, 1:113-22.
50. Selby JV, Friedman GD, Queensberry CP, Weiss NS: A case-control study of
screening sigmoidoscopy and mortality from colorectal cancer. N Engl J
Med 1992, 326:653-7.
51. Eddy DM, Nugent FW, Eddy JF, Coller J, Gilbertsen V, Gottlieb LS, Rice R,
Sherlock P, Winawer S: Screening for colorectal cancer in a high-risk
population. Results of a mathematical model. Gastroenterology 1987,
92:682-92.
52. Ladabaum U, Chopra CL, Huang G, Scheiman JM, Chernew ME,
Fendrick AM: Aspirin as an adjunct to screening for prevention of
sporadic colorectal cancer. A cost-effectiveness analysis. Ann Intern Med
2001, 135:769-81.
53. Rubin PH, Waye JD, Colonoscopic Polypectomy: A critical review of the
literature. Current Gastroenterology Reports 2006, 8;5:430-433.
54. Winawer SJ, Zauber AG, Ho MN, O’Brien MJ, Gottleib LS, Sternberg SS,
Waye JD, Schapiro M, Bond JH, Panish JF, Ackroyd F, Shike M, Kurtz RC,
Hornsby-Lewis L, Gerdes H, Stewart ET, the National Polyp Study
Workgroup: Prevention of colorectal cancer by colonoscopic
polypectomy. The National Polyp Study Workgroup. N Engl JMed 1993,
329;27:1977-1981.
55. Dixon H, Borland R, Segan C, Stafford H, Sindall C: Public Reaction to
Victoria’s 2 Fruit ‘n’ 5 Veg Every Day” Campaign and Reported
consumption of Fruit and Vegetables. Preventive medicine 1998, 27:572-82.
56. Vijan S, Hwang EW, Hofer TP: Which Colon Cancer Screening test? A
comparison of Costs, Effectiveness, and Compliance. The American
Journal of Medicine 2001, 111:593-601.
57. Eddy DM: Screening for Colorectal cancer. Annals of Internal Medicine
1990, 113:373-84.
58. Sonnenberg A, Delco F, Inadomi JM: Cost-effectiveness of colonoscopy in
screening for colorectal cancer. Ann Intern Med 2000, 133:573-84.
59. O’Leary BA, Olynyk JK, Neville AM, Platell CF: Cost-effectiveness of
colorectal cancer screening: Comparison of community-based flexible
sigmoidoscopy with fecal occult blood testing and colonoscopy. Journal
of Gastroenterology and Hepatology 2004, 19:36-47.
60. Frazier AL, Colditz GA, Fuchs CS, Kuntz KM: Cost-effectiveness of screening
for colorectal cancer in the general population. JAMA 2000, 284:1954-61.
61. Berchi C, Bouvier V, Réaud J-M, Launoy G: Cost-effectiveness analysis of
two strategies for mass screening of colorectal cancer in France. Health
Economics 2004, 13:227-38.
62. Khandker RZ, Dulski JD, Kilpatrick JB, Ellis RP, Mitchell JB, Baine WB: A
decision model and cost-effectiveness analysis of colorectal cancer
screening and surveillance guildelines for average-risk adults. Int J Tech
Assess in Health Care 2000, 16;3:799-810.
63. Loeve F, Brown ML, Boer R, van Ballegooijen M, van Oortmarssen GJ,
Habbema JFD: Endoscopic colorectal-cancer screening, a cost-saving
analysis. Journal of the National Cancer Institute 2000, 92:557-63.
64. Loeve F, Boer R, van Oortmarssen GJ, van Ballegooijen M, Habbema JDF:
The MISCAN-COLON Simulation Model for the Evaluation of Colorectal
CancerScreening. Computers and Biomedical Research 1999, 32:13-33.
65. Geul KW, Bosman FT, van Blankenstein M, Grobbee DE, Wilson JHP:
Prevention of Colorectal Cancer. Costs and Effectiveness of
Sigmoidoscopy. Scand J Gastroenterol 1997, 32(Suppl 223):79-87.
66. Lieberman DA:
Cost-effectiveness model for colon cancer screening.
Gastroenterology 1995, 109:1781-90.
67. Lejeune C, Arveux P, Dancourt V, Fagnani F, Bonithon-Kopp C, Faivre J: A
simulation model for evaluating the medical and economic outcomes of
screening strategies for colorectal cancer. European Journal of Cancer
Prevention 2003, 12:77-84.
68. Ness RM, Holmes AM, Klein R, Dittus R: Cost-Utility of One-Time
Colonoscopic Screening for Colorectal Cancer at Various Ages. American
Journal of Gastroenterology 2000, 95:1800-11.
69. Salkeld G, Young G, Irwig L, Haas M, Glasziou P: Cost-effectiveness analysis
of screening by faecal occult blood testing for colorectal cancer in
Australia. Aust N Z J Public Health 1996, 20:138-43.
70. Wagner J, Herdman RC, Wadhwa S: Cost effectiveness of Colorectal
Cancer Screening in the Elderly. Annals of Internal Medicine 1991,
115:807-17.
Ginsberg et al. Cost Effectiveness and Resource Allocation 2010, 8:2
/>Page 15 of 16
71. Tsuji I, Fukao A, Shoji T, Kuwajima I, Sugawara N, Hisamichi S: Cost-
effectiveness Analysis of Screening for Colorectal Cancer in Japan.
Tohoku J Exp Med 1991, 164:269-78.
72. Leshno M, Halperin Z, Arber N: Cost-effectiveness of Colorectal cancer
Screening in the Average Risk Population. Health Care Management
Science 2003, 6:165-74.
73. Neilsen AR, Whynes D: Cost-effectiveness of screening for colorectal
cancer: A simulation model. IMA Journal of Mathematics Applied in
Medicine & Biology 1995, 12:355-67.
74. Results of the first round of a demonstration pilot of screening for
colorectal cancer in the United Kingdom: UK Colorectal Cancer
Screening Pilot Group. BMJ 2004, 329(7458):133, Epub 2004 Jul 5.
75. Atkin WS, Hart A, Edwards R, McIntyre P, Aubrey R, Wardle J, Sutton S,
Cuzick J, Northover JM: Yield of neoplasia, and adverse effects of flexible
sigmoidoscopy screening. Gut 1998, 42:560-5.
76. Spratt JS Jr, Spjut HJ: Prevalence and prognosis of individual clinical and
pathologic variables associated with colorectal carcinoma. Cancer 1967,
20:1976-85.
77. Mathers CD, Shibuya K, Boschi-Pinto C, Lopez AD, Murray CJL: Global and
regional estimates of cancer mortality and incidence by site: 1.
Application of regional cancer survival model to estimate cancer
mortality distribution by site. BMC Cancer 2002, 2:36.
78. Shibuya K, Mathers CD, Boschi-Pinto C, Lopez AD, Murray CJ: Global and
regional estimates of cancer mortality and incidence by site: II. Results
for the global burden of disease 2000. BMC Cancer 2002, 2:37.
79. Lauer JA, Murray CJL, Roehrich K, Wirth H: PopMod: a longitudinal
population model with two interacting disease states. Cost Effectiveness
and Resource Allocation 2003, 1:6 [].
80. Brown ML, Klabunde CN, Mzsliwiec P: Current capacity for endoscopic
colorectal cancer screening in the United States: Data from the national
cancer institute survey of colorectal cancer screening practices. Am J
Med 2003, 115:129-33.
81. Baltussen R, Adam T, Tan-Torres Edejer T, Hutubessy R, Acharya A, Evans DB,
Murray CJL: Chapter 4. Health effects. Making Choices in Health. WHO
Guide to Cost-Effectiveness Analysis WHO GenevaTan-Torres Edejer T,
Bltussen R, Adam T, Hutubessy R, Acharya A, Evans DB, Murray CJL 2003.
82. Memorial Sloan-Kettering Camcer Center: Surgery. Common Preoperative
work-up. [ Accessed 15th July
2004.
83. Laparoscopic Resection of Colonic Carcinoma: EAES consensus conference
Lisbon, June 2, 2002 Consensus Proceedings
84. Morton G, Bowler I: Combined spinal-epidural as an alternative method
of anaesthesia for a sigmoid-colectomy. Anaesthesia 2001, 56:799-820.
85. International Drug Price Indicator Guide: MSH, Arlington Virginia 2003.
86. British National Formulary No 47: Published by the British Medical
Association, London and the Royal Pharmaceutical Society of Great Britain,
London 2004.
87. WHO Commission on MacroEconomics and Health: Macroeconomics and
health: investing in health for economic development. Report of the
commission on Macroeconomics and Health Geneva: World Health
Organization 2001.
88. Gyrd-Hannsen D: Fecal occult blood tests. A cost-effectiveness analysis.
Int J Technol Assess Health Care 1998, 14:290-301.
89. Brown ML, Fintor L: Cost-effectiveness of breast cancer screening:
preliminary results of a systematic review of the literature. Breast Cancer
Res Treat 1993, 25:113-8.
90. Guittet L, Bouvier V, Mariotte N, Vallee JP, Levillian R, Tichet J, Launoy G:
Comparison of a guaiac and an immunochemical feacal occult blood
test for the detection of colonic lesions according to lesion type and
location. Br J Cancer 2009, 100;8:1230-5, Epub 2009, Mar 31.
91. Dancourt V, Lejeune C, Lepage C, Gailliard MC, Meny B, Faivre J:
Immunochemical faecal occult blood tests are superior to guaiac-based
tests for the detection of colorectal neoplasms. Eur J Cancer 2008,
44(15):2254-8.
92. Castaglione G, Zappa M, Grazzini G, Mazzotta A, Blagini M, Salvadori P,
Ciatto S: Immunochemical vs guaiac faecal occult blood tests in a
population-based screening programme for colorectal cancer. Br J
Cancer 1996, 74:141-144.
93. Boer R, deKonig HJ, van Ballegooijen M, Maas van der PJ: Important
Influences on Effectiveness and Costs to Be Considered in the
Evaluation of Cancer Screening. Quantitative Methods of Evaluation of
Cancer Screening, Arnold, a member of the Hodder Headline Group London
Oxford University Press, New YorkDuffy S, Hill C, Esteve J 2001, 13-25.
94. Redaelli A, Cranor CW, Okano GJ, Reese PR: Screening, Prevention and
Socioeconomic costs associated with the treatment of colorectal cancer.
Pharmacoeconomics 2003, 21:1213-35.
doi:10.1186/1478-7547-8-2
Cite this article as: Ginsberg et al.: Prevention, screening and treatment
of colorectal cancer: a global and regional generalized cost
effectiveness analysis. Cost Effectiveness and Resource Allocation 2010 8:2.
Submit your next manuscript to BioMed Central
and take full advantage of:
• Convenient online submission
• Thorough peer review
• No space constraints or color figure charges
• Immediate publication on acceptance
• Inclusion in PubMed, CAS, Scopus and Google Scholar
• Research which is freely available for redistribution
Submit your manuscript at
www.biomedcentral.com/submit
Ginsberg et al. Cost Effectiveness and Resource Allocation 2010, 8:2
/>Page 16 of 16