Báo cáo y học: "Burden of disease and costs of aneurysmal subarachnoid haemorrhage (aSAH) in the United Kingdom" ppsx
Bạn đang xem bản rút gọn của tài liệu. Xem và tải ngay bản đầy đủ của tài liệu tại đây (947.67 KB, 12 trang )
Rivero-Arias et al. Cost Effectiveness and Resource Allocation 2010, 8:6
/>Open Access
RESEARCH
BioMed Central
© 2010 Rivero-Arias et al; licensee BioMed Central Ltd. This is an Open Access article distributed under the terms of the Creative Com-
mons Attribution License ( which permits unrestricted use, distribution, and reproduc-
tion in any medium, provided the original work is properly cited.
Research
Burden of disease and costs of aneurysmal
subarachnoid haemorrhage (aSAH) in the United
Kingdom
Oliver Rivero-Arias*, Alastair Gray and Jane Wolstenholme
Abstract
Background: To estimate life years and quality-adjusted life years (QALYs) lost and the economic burden of aneurysmal
subarachnoid haemorrhage (aSAH) in the United Kingdom including healthcare and non-healthcare costs from a
societal perspective.
Methods: All UK residents in 2005 with aSAH (International Classification of Diseases 10
th
revision (ICD-10) code I60).
Sex and age-specific abridged life tables were generated for a general population and aSAH cohorts. QALYs in each
cohort were calculated adjusting the life tables with health-related quality of life (HRQL) data. Healthcare costs
included hospital expenditure, cerebrovascular rehabilitation, primary care and community health and social services.
Non-healthcare costs included informal care and productivity losses arising from morbidity and premature death.
Results: A total of 80,356 life years and 74,807 quality-adjusted life years were estimated to be lost due to aSAH in the
UK in 2005. aSAH costs the National Health Service (NHS) £168.2 million annually with hospital inpatient admissions
accounting for 59%, community health and social services for 18%, aSAH-related operations for 15% and
cerebrovascular rehabilitation for 6% of the total NHS estimated costs. The average per patient cost for the NHS was
estimated to be £23,294. The total economic burden (including informal care and using the human capital method to
estimate production losses) of a SAH in the United Kingdom was estimated to be £510 million annually.
Conclusion: The economic and disease burden of aSAH in the United Kingdom is reported in this study. Decision-
makers can use these results to complement other information when informing prevention policies in this field and to
relate health care expenditures to disease categories.
Introduction
Aneurysmal subarachnoid haemorrhage (aSAH) (Inter-
national Classification of Diseases 10
th
revision code I60)
is a type of cerebrovascular disease and a main cause of
disability and mortality in relatively young patients, with
an average age at first onset of 55 [1]. The incidence of
aSAH has been estimated at around 6-7 per 100,000 peo-
ple in most populations [1]. The epidemiology and effec-
tiveness of treatments of aSAH is well-documented in the
literature [2] and cost analyses of alternative therapies to
treat aSAH are also available [3-5]. However the overall
economic burden of aSAH to society remains unknown.
Making accurate economic estimates of resources asso-
ciated with particular health problems provides useful
information for Departments of Health worldwide [6].
These figures can be used by health care decision makers
to understand the overall impact of a disease on the
annual health care budget and to provide parameter esti-
mates for economic models, including value of informa-
tion studies. If performed at regular intervals such studies
help to monitor the impact of health care policies as well
as changes in clinical practice. For example, in the field of
aSAH, the increased use of endovascular intervention
with its associated shorter length of stay is likely to influ-
ence the total budget, and this may be of interest to deci-
sion makers. Detailed comparisons of such health care
expenditure estimates across countries may also play a
part in assessing the aggregate performance of health
* Correspondence:
1
Health Economics Research Centre, Department of Public Health, University
of Oxford, UK
Full list of author information is available at the end of the article
Rivero-Arias et al. Cost Effectiveness and Resource Allocation 2010, 8:6
/>Page 2 of 12
care systems [7]. Finally, the results of these studies can
provide useful information to communicate the cost bur-
den of a specific disease to a wider non-specialist audi-
ence [8].
A recent study has published detailed estimates of the
costs of cerebrovascular diseases as part of a study of car-
diovascular disease (CVD) related expenditures in the
United Kingdom [9]. The authors estimated the annual
healthcare costs for cerebrovascular diseases for the UK
National Health Service (NHS) to be £5.2 billion and the
total economic burden (including non-health care costs)
to be £8.5 billion in 2004. aSAH has been estimated to be
around 3% of all annual cerebrovascular events in the
Oxfordshire region [10]. Although it is tempting to apply
this figure to the cerebrovascular disease costs already
calculated to estimate the UK costs of aSAH, this could
produce seriously flawed results if applied generally: cere-
brovascular diseases encompass different types of condi-
tions and it is likely that each of them has different
resource use consumption patterns; e.g. length of stay
varies across cerebrovascular conditions. As a result, to
calculate reliable cost estimates of aSAH we need to
undertake a specific cost-of-illness study.
The main objectives of this study were to estimate the
economic costs of aSAH in the United Kingdom, includ-
ing direct healthcare costs, informal care costs and
employment-related costs. The number of life-years and
quality-adjusted life years (QALYs) lost due to premature
death are also reported.
Methods
Methodological background
A cost-of-illness study was designed to identify, measure
and value all resources related to aSAH [11]. The per-
spective adopted in this study was societal. Health care
costs directly related to the NHS and non-healthcare
costs associated with unpaid care and productivity losses
from morbidity or premature death were considered.
A prevalence-based approach was adopted, where all
costs related to aSAH in 2005 were measured regardless
of the date the haemorrhage occurred. Health care costs
were adjusted to 2005 UK prices using the Hospital and
Community Health Services inflation index [12]. Non-
healthcare costs were also expressed in 2005 prices.
Aggregate national data on morbidity, mortality,
resource use and disease-related costs were available and
therefore a top-down costing method was used in this
study. Epidemiological and resource use data were avail-
able from several sources [9,13-16]. Population ratios
were used to adjust to UK levels when data only covered
England or England and Wales. To complete the informa-
tion not available at a national level, data from the Inter-
national Subarachnoid Aneurysm Trial (ISAT) were used:
patients recruited to this large trial were broadly repre-
sentative of the UK aSAH population in terms of age,
geographical distribution, severity and other characteris-
tics [17].
The epidemiology of aSAH
To estimate the number of patients with aSAH in 2005,
the total number of admissions in the UK, as reported in
Hospital Episode Statistics (HES), was divided by the
number of admissions each patient incurred. The number
of admissions includes both new cases of aSAH and any
re-admissions following episodes in previous years. The
number of admissions each patient incurred was
assumed to be similar to the information from the ISAT
dataset where each patient incurred on average 1.07
admissions during the first year after the haemorrhage.
Life-years (LYs) and quality-adjusted life years (QALYs)
Sex and age-specific data on mortality due to aSAH
(ICD-10 code I60) and all-cause mortality data were
available from the Office for National Statistics (ONS)
[18]. Sex and age-specific abridged life tables were gener-
ated for a general population cohort using all-cause mor-
tality excluding aSAH, and for an aSAH cohort using
aSAH specific-mortality [19]. A hypothetical cohort of
1,000 individuals in 11 age bands by gender was defined.
The number of persons at the beginning of each interval
was calculated by subtracting from the number of people
in the previous interval the number of deaths occurring
in that interval. The number of person-years in each
interval was calculated assuming that deaths occurred in
the mid-point of the interval and adjusting for the length
of the interval. The cumulative person-years were esti-
mated as the number of person-years in an interval plus
any previous year. These were then divided by the num-
ber beginning in each interval to estimate life expectancy
in each age group. Quality-adjusted life-years (QALYs) in
each age interval were calculated by multiplying the num-
ber of persons-years by an estimate of health-related
quality of life (HRQL) in that interval. Quality-adjusted
life expectancy (QALE) was computed similarly to life
expectancy but using cumulative QALYs as the numera-
tor.
HRQL was extracted from the EuroQol EQ-5D instru-
ment [20]. The EQ-5D is a generic health outcome that
measures quality of life widely used in the economic eval-
uation of health care technologies. It includes five
domains with three possible levels in each domain.
Health states from the EQ-5D can be converted into a
utility value using a validated tariff estimated with time
trade-offs methods in a large representative British sam-
ple [21]. EQ-5D population norms for the general popula-
tion cohort and EQ-5D data at one year follow-up from
the ISAT study for the aSAH cohort were used in the life
table approach [17,21]. The same HRQL was assumed for
Rivero-Arias et al. Cost Effectiveness and Resource Allocation 2010, 8:6
/>Page 3 of 12
age bands <1-9 as for 10-19, and for those over 79 as for
70-79. LYs and QALYs in each cohort were calculated by
multiplying the aSAH population by the corresponding
life expectancy and QALE. Differences in LYs and QALYs
were computed by subtraction between the all cause and
disease specific (aSAH) cohorts.
Healthcare expenditure
Hospital inpatient admissions, operations for aSAH, cere-
brovascular rehabilitation, accident and emergency care,
hospital day cases, hospital outpatient care, primary care
and community health and social services (CHSS) were
the healthcare expenditure categories included.
Volumes of aSAH-related resources in each category
were extracted from the sources available and multiplied
by the appropriate unit costs. Unit costs were obtained
from NHS reference costs, standard national publications
and a recent study of the UK costs of endovascular and
surgical clipping following aSAH [5,22,23].
Medication costs were not included in this study as
their contribution to overall aSAH costs is expected to be
very small. In addition, medical negligence and private
healthcare costs were not included in the analysis due to
lack of data availability.
Hospital inpatient admissions
Inpatient admissions consist of aSAH-related bed days in
NHS hospitals, where aSAH is recorded as the primary
reason for the admission. The number of inpatient bed
days for England was extracted from the Hospital Episode
Statistics and adjusted to UK levels.
Operations for aSAH
A recent study of Neurosurgical Units in the UK and Ire-
land reported that 2198 out of 2397 (91.7%) patients with
a confirmed ruptured aneurysm received a repair proce-
dure[24]. This proportion was applied to the estimated
total number of UK aSAH patients to calculate the num-
ber of patients treated.
Accident and emergency care
Accident and emergency care consists of all aSAH-related
hospital emergency visits. Data for England were
obtained from the Hospital Episode Statistics database
and adjusted to UK levels.
Hospital day cases and hospital outpatient care
This category includes the number of day cases and out-
patient care in the form of follow up angiograms per-
formed on patients. The proportion of patients attending
for a follow up angiogram was extracted from the ISAT
study and was estimated to be 42%.
Cerebrovascular rehabilitation
The number of patients completing cerebrovascular reha-
bilitation programmes was calculated as the product of
the number of patients with aSAH and the proportion of
those patients attending a rehabilitation programme. The
proportion of patients attending a rehabilitation pro-
gramme was extracted from the ISAT study and was esti-
mated to be 7%.
Primary Care
Primary care consultations consist mainly of visits to a
general practitioner at a surgery. Consultations were
obtained from a large national survey performed in Eng-
land and Wales[15], and estimates were then adjusted to
UK levels.
Community Health and Social Services (CHSS)
All health and social care provided in the community
including professional advice and support, general
patient care and other healthcare services provided were
included in this category. The cost of CHSS attributable
to aSAH was calculated as a proportion of the total CHSS
spending for cerebrovascular diseases in the United King-
dom. The total UK CHSS costs for cerebrovascular dis-
eases were taken from the Department of Health Burden
of Disease publication updated to 2005 prices, [14].
Results from the Oxford Vascular Study (OXVASC) sug-
gest that 3% of all annual cerebrovascular events in the
Oxfordshire region were aSAH and therefore this was the
baseline proportion applied to total CHSS expenditure on
cerebrovascular diseases in this analysis [10].
Non-healthcare expenditure
Informal care
Informal care costs were measured as the monetary value
of time spent by carers while providing care for relatives
with aSAH (the opportunity costs of unpaid care). Rou-
tine databases on informal care for cerebrovascular dis-
eases are not available yet, and researchers have
estimated these costs using different methods. Luengo-
Fernandez et al. estimated the informal care costs of cere-
brovascular diseases in the United Kingdom using Euro-
pean and national sources [9,25-28]. They extracted
information on the proportion of care given by working
age carers, the number of hours spent caring and the
number of informal carers in each age group. They valued
informal care costs using wage rates for the employed
carers (economically active) and minimum wages for
retired or unemployed carers (economically inactive)
[29,30]. The costs of informal care attributable to aSAH
were assumed to be 3% of all informal care costs for cere-
brovascular diseases, in line with findings from the
OXVASC study [10].
Productivity losses
Productivity costs were estimated as the earnings lost as a
result of aSAH-related mortality and morbidity.
Productivity loss from aSAH-related death was calcu-
lated as the product of age and sex specific mortality
deaths and the number of working years lost due to pre-
mature death. The age and sex specific mortality rates
due to aSAH were extracted from the ONS Mortality Sta-
tistics [18]. Working years lost were adjusted to take into
Rivero-Arias et al. Cost Effectiveness and Resource Allocation 2010, 8:6
/>Page 4 of 12
account future changes in the size of the labour force
using economic activity data [16]. This product was then
multiplied by average annual earnings [29]. The number
of future working years lost due to premature death in
2005 was used as a proxy for premature deaths in previ-
ous years. As this is a prevalence study no discounting
was applied.
Productivity losses due to aSAH-related morbidity
were calculated using both the human capital and the
friction method approaches [31]. The first method esti-
mates losses as the product of the number of days off
work and average daily earnings. Information on absence
from work of patients with aSAH was extracted from the
ISAT dataset. In the friction method approach it is
assumed that absent workers are likely to be replaced by
other workers within some period of time - the friction
period. This period was assumed here to be 90 days [32].
The friction-period adjusted morbidity loss was esti-
mated by multiplying the unadjusted productivity loss
(human capital approach) by the friction period and then
dividing this product by the age and sex specific duration
of incapacity spells, which was extracted from the ISAT
dataset.
Sensitivity analysis
The impact of varying the number of admissions each
patient incurred during the first year after the haemor-
rhage extracted from the ISAT study and its impact in the
LYs and QALYs lost results was also evaluated. A thresh-
old of a 20% change in the parameter was used.
Table 1: Life expectancy and QALE in the general population life table cohort
Age
interval
Probability
of death in
interval
Number
beginning
interval
Person-
years in
interval
Cumulative
person-
years
Life
expectancy
HRQL
(EQ5D)
QALYs
person-
years
Cumulative
QALYs
person-
years
QALE
Males
<1-9 0.007 1000 9964 76618 76.6 0.94 9366 66817 66.8
10-19 0.003 993 9913 66654 67.1 0.94 9319 57451 57.9
20-29 0.008 990 9861 56741 57.3 0.935 9220 48132 48.6
30-39 0.012 982 9766 46880 47.7 0.92 8985 38912 39.6
40-49 0.024 971 9593 37114 38.2 0.875 8393 29927 30.8
50-59 0.058 948 9201 27521 29.0 0.81 7453 21534 22.7
60-69 0.149 893 8261 18320 20.5 0.78 6443 14081 15.8
70-79 0.362 760 6219 10059 13.2 0.765 4758 7638 10.1
80-89 0.715 484 3112 3840 7.9 0.75 2334 2880 5.9
90-99 0.955 138 722 728 5.3 0.75 542 546 4.0
100+ 1 6 6 6 1.0 0.75 5 5 0.8
Females
<1-9 0.006 1000 9970 80908 80.9 0.94 9372 70133 70.1
10-19 0.002 994 9932 70938 71.4 0.94 9336 60761 61.1
20-29 0.003 992 9908 61005 61.5 0.935 9264 51424 51.8
30-39 0.006 989 9862 51097 51.7 0.92 9073 42160 42.6
40-49 0.016 983 9756 41235 41.9 0.88 8585 33087 33.7
50-59 0.038 968 9496 31479 32.5 0.83 7882 24502 25.3
60-69 0.095 931 8872 21983 23.6 0.795 7054 16620 17.8
70-79 0.253 843 7364 13111 15.5 0.745 5486 9566 11.3
80-89 0.604 630 4396 5746 9.1 0.71 3121 4080 6.5
90-99 0.932 250 1333 1350 5.4 0.71 946 958 3.8
100+ 1 17 17 17 1.0 0.71 12 12 0.7
HRQL: health-related quality of life; EQ-5D: EuroQol 5D instrument; QALE: quality-adjusted life expectancy; QALY: quality-adjusted life years
Rivero-Arias et al. Cost Effectiveness and Resource Allocation 2010, 8:6
/>Page 5 of 12
To test how changes in key resource estimates, unit
costs, informal care and productivity costs affect the
baseline results, one-way sensitivity analysis was per-
formed. Only those parameters informing resource cate-
gories that contributed substantially to the overall and
NHS costs were included in the sensitivity analysis. The
effect of 20% changes on each parameter was evaluated.
The impact of altering the proportion of cerebrovascular
diseases attributable to aSAH from 3% to 1% or 6% was
also evaluated.
The 20% threshold was used to maintain comparability
and consistency across cost-of-illness studies in the area
of cerebrovascular diseases [9,33].
Results
The epidemiology of aSAH in the United Kingdom
The number of hospital admissions due to aSAH was
estimated to be 7,727 (2,962 men and 4,765 women) in
the United Kingdom in 2005. Applying the baseline esti-
mate of 1.07 admissions per patient on average, 7,221
(2,768 men and 4,453 women) patients were estimated to
have aSAH in the United Kingdom in 2005.
Life expectancy and QALE for the general population
and the aSAH cohorts by gender and age group are
reported in tables 1 and 2 respectively. Table 3 suggests
that the number of life years and quality adjusted life
years lost as a result of aSAH when compared to the life
experience of the general population was 80,356 LYs and
74,807 QALYs respectively; dividing by the annual num-
ber of aSAH cases, this gives an average loss per case of
11.1 life years and 10.4 quality adjusted life years.
Healthcare costs
Table 4 shows a summary of the results of the NHS cost
categories. Aneurysmal subarachnoid haemorrhage cost
the NHS £168.2 million with a cost per patient estimated
to be £23,294 in 2005. Hospital inpatient care accounted
for 59% of the estimated costs with 123,968 inpatient bed
days and associated costs of £98.7 million. The second
largest component with 18% of the overall aSAH costs
was Community Health and Social Services which
accounted for £30.2 million. aSAH operations cost the
NHS £25.4 million with 6,625 patients receiving a repair
procedure. Cerebrovascular rehabilitation costs were
estimated to be £10.6 million with 506 patients spending
47,540 days at a rehabilitation clinic accounting for 6% of
the health care costs. Accident and emergency, hospital
day cases, hospital outpatient care and primary care cost
the NHS £3.2 million in 2005.
Non-healthcare costs
Informal care costs
Table 4 shows that society spent 3.3 million hours of car-
ing by economically active carers and 2 million hours of
caring by economically inactive carers. The total informal
care costs due to aSAH were estimated to be £41.9 mil-
lion.
Productivity costs
Table 4 also reports the productivity costs associated with
aSAH. A total of 7,564 working years were lost by men
with future forgone earnings calculated at £152.7 million.
Females lost 9,088 years and associated future forgone
earnings were estimated to be £126.2 million.
The total number of certified incapacity days was esti-
mated to be 122,280 for males and 210,112 for females.
Morbidity costs were £21.2 million overall, however
when adjusting for the friction period the cost was esti-
mated to be £6.3 million.
The total economic burden of aSAH in the United
Kingdom was estimated to be £510 million using the
human capital approach for morbidity costs and £495
million when using the friction method.
Sensitivity analysis
Reducing the number of admissions per patient per year a
20%, increased the number of life-years and quality-
adjusted life years lost to 86,386 and 83,531 respectively.
If the same parameter is increased a 20%, the number of
life-years and quality-adjusted life years lost was esti-
mated to be 75,056 and 68,088 respectively.
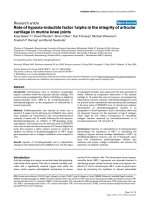
Figure 1 shows how sensitive the main estimate of NHS
healthcare costs was to different assumptions concerning
resource use or unit costs, holding everything else con-
stant. For example, reducing the number of bed days to
99,174, that is a 20% reduction, decreased total NHS
healthcare costs by 12%. Similarly, if we increase the pro-
portion of all cerebrovascular diseases associated to
aSAH to 6% (this parameter affects community and social
service costs), NHS healthcare costs increases by 18%.
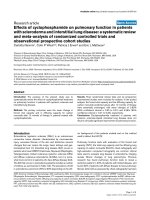
Figure 2 shows how sensitive total aSAH-related costs
(including non-healthcare costs) were to changes in key
factors holding everything else constant. Overall, changes
in the proportion of all cerebrovascular diseases associ-
ated with aSAH, and the number of inpatient bed days,
had the greatest impact on aSAH-related costs with
changes of 16% and 5% respectively.
Discussion
This paper reports the first cost-of-illness analysis of
aSAH in the United Kingdom. Aneurysmal subarachnoid
haemorrhage cost the NHS £168.2 million in 2005 with
overall aSAH-related costs estimated to be £510 million
using the human capital and £495 million when using the
friction method. This accounts for 6% of the £8.8 billion
(2005 prices) for the UK costs of all cerebrovascular dis-
eases reported by Luengo-Fernandez et al in 2004 [9], and
so constitutes a significantly greater proportion of total
CVD expenditure than of CVD events: Rothwell et al esti-
Rivero-Arias et al. Cost Effectiveness and Resource Allocation 2010, 8:6
/>Page 6 of 12
mated that 3% of CVD events in Oxfordshire from 2002
to 2005 were aSAH [10].
Age and sex-specific life expectancy and quality-
adjusted life expectancy for a general population and an
aSAH cohort are reported in this study, indicating that
aSAH is associated with a loss of 11.1 years of life expec-
tancy and 10.4 quality adjusted years of life expectancy
compared to a general population. Quality of life of aSAH
patients has also been reported recently in a study using
the Short-Form SF-36 but no utility values to derive
QALYs were included in this analysis [34]. Therefore to
our knowledge no similar estimates, as detailed as the
current research, have been reported to date. The SF-36
is a multiattribute generic quality of life outcome widely
used by the clinical community [35]. It includes 36 items
that can be summarised in eight domains plus a physical
and a mental component.
This study estimated the per patient healthcare costs of
treating aSAH to be £23,294 per annum. A recent
detailed cost study of the UK costs of endovascular and
surgical clipping following aSAH has reported that these
patients cost the NHS £19,306 (community and social
service costs not included in the study) on average during
the first year after the collapse [5]. Removing CHSS from
the cost estimates presented here, the NHS cost per
patient would be £19,107; this is similar to the result
reported by the recent UK cost study and supports the
figures presented here.
Several limitations of this study need to be highlighted.
The community and social service costs extracted from
Table 2: Life expectancy and QALE in the aSAH life table cohort
Age
interval
Probability
of death in
interval
Number
beginning
interval
Person-
years in
interval
Cumulative
person-
years
Life
expectancy
HRQL
(EQ5D)
QALYs
person-
years
Cumulative
QALYs
person-
years
QALE
Males
<1-9 0.187 1000 9037 39207 39.2 0.68 6163 27791 27.8
10-19 0.179 807 7343 30170 37.4 0.68 5008 21628 26.8
20-29 0.123 661 6181 22827 34.5 0.74 4593 16620 25.1
30-39 0.160 575 5264 16646 28.9 0.70 3706 12027 20.9
40-49 0.211 478 4227 11382 23.8 0.72 3039 8321 17.4
50-59 0.221 368 3187 7155 19.5 0.76 2406 5282 14.4
60-69 0.211 270 2254 3968 14.7 0.74 1660 2875 10.7
70-79 0.399 181 1252 1715 9.5 0.71 887 1215 6.7
80-89 0.423 69 404 463 6.7 0.71 286 328 4.7
90-99 0.536 11 58 59 5.1 0.71 41 41 3.6
100+ 1 0 0 0 1.0 0.71 0 0 0.7
Females
<1-9 0.361 1000 8175 35686 35.7 0.83 6745 27417 27.4
10-19 0.051 635 6182 27511 43.3 0.83 5101 20672 32.6
20-29 0.139 601 5589 21329 35.5 0.83 4611 15571 25.9
30-39 0.158 516 4743 15740 30.5 0.69 3265 10960 21.2
40-49 0.189 432 3889 10996 25.4 0.69 2665 7695 17.8
50-59 0.214 345 3032 7108 20.6 0.71 2143 5030 14.6
60-69 0.256 261 2185 4075 15.6 0.72 1582 2887 11.1
70-79 0.349 176 1307 1890 10.7 0.69 902 1305 7.4
80-89 0.549 85 504 583 6.8 0.69 348 402 4.7
90-99 0.592 15 79 79 5.2 0.69 54 54 3.6
100+ 1 0 0 0 1.0 0.69 0 0 0.7
HRQL: health-related quality of life; EQ-5D: EuroQol 5D instrument; QALE: quality-adjusted life expectancy; QALY: quality-adjusted life years
Rivero-Arias et al. Cost Effectiveness and Resource Allocation 2010, 8:6
/>Page 7 of 12
Table 3: Life-years (LYs) and quality-adjusted life years (QALYs) lost in the aSAH cohort compared to the general
population cohort
Age
interval
aSAH
population
Life years
aSAH
cohort (1)
Life-years
general
population
cohort (2)
Difference
(2)-(1)
QALYs
aSAH
cohort (3)
QALYs
general
population
cohort (4)
Difference
(4)-(3)
Males
<1-9 15 569 1111 543 403 969 566
10-19 46 1710 3071 1362 1226 2647 1422
20-29 114 3930 6524 2595 2861 5534 2673
30-39 339 9818 16188 6370 7094 13437 6343
40-49 598 14250 22862 8612 10417 18435 8018
50-59 687 13375 19963 6587 9874 15620 5747
60-69 536 7881 10993 3112 5711 8450 2739
70-79 271 2568 3591 1023 1820 2726 907
80-89 147 982 1168 186 696 876 180
90-99 16 80 82 2 57 62 5
100+ 15000000
LYs or
QALYs lost
males
30391 28599
Females
<1-9 4 159 361 202 122 313 191
10-19 38 1644 2707 1064 1235 2319 1084
20-29 87 3087 5350 2264 2253 4510 2257
30-39 333 10136 17176 7039 7058 14172 7113
40-49 842 21427 35332 13905 14994 28350 13356
50-59 1,186 24410 38575 14165 17274 30025 12750
60-69 904 14106 21335 7228 9992 16130 6138
70-79 705 7576 10965 3389 5230 8001 2771
80-89 301 2054 2749 696 1418 1952 534
90-99 522712841318720114
100+ 4000000
LYs or
QALYs lost
females
49964 46208
Total LYs
or QALYs
lost
80356 74807
LYs: life-years; QALY: quality-adjusted life years; aSAH: aneurysmal subarachnoid haemorrhage
Rivero-Arias et al. Cost Effectiveness and Resource Allocation 2010, 8:6
/>Page 8 of 12
Table 4: Summary of costs of aneurysmal subarachnoid haemorrhage in the UK in 2005
Type of resource
used
Unit of
measurement
Units of
resources
consumed
Average unit
cost (£2005)
Total cost (£2005
million)
Sources of data
(reference
number)
Health care cost
Hospital inpatient
care
Inpatient bed
days
123,968 £796 £98.7 6
Surgical
operations for
aSAH
Operated patients 6,625 £3,833 £25.4 6
Cerebrovascular
rehabilitation
Days at
rehabilitation
clinic
47,540 £224 £10.6 6,10
Accident and
emergency
Attendances 5,140 £106 £0.5 6
Hospital day case
and outpatient
care
Day cases 3,049 £691 £2.1 6
Primary care Doctor
consultations at
clinic
20,370 £30 £0.6 8
Community
health/social
services
£30.2 3,7,10
Health care cost
subtotal
£168.2
Non-health care
cost
Hours of informal
care
Hours of caring by
economically
active carers per
year
3,311,769 £9 £31.4 2,3,18,19,20,21
Hours of caring by
economically
inactive carers per
year
2,080,325 £5 £10.5 2,3,18,19,20,21
Informal care
cost subtotal
£41.9
Productivity loss
Mortality Working years
lost (men)
7,564 £25,100 £152.7 6,9,10,22
Working years
lost (women)
9,088 £19,400 £126.2 6,9,10,22
Morbidity Certified
incapacity days
(men)
122,280 £85 £10.4 6,10,23
Certified
incapacity days
(women)
210,112 £51 £10.8 6,10,23
Morbidity
(Friction adjusted)
men
£3.2 6,10,23,24
Morbidity
(Friction adjusted)
women
£3.1 6,10,23,24
Productivity loss
subtotal
£300.1
(Friction adjusted) £285.2
Non-health care
subtotal
£342.0
(Friction adjusted) £327.1
Total economic
burden
£510.2
(Friction adjusted) £495.3
aSAH: aneurysmal subarachnoid haemorrhage
Table 4: Summary of costs of aneurysmal subarachnoid haemorrhage in the UK in 2005 (Continued)
Rivero-Arias et al. Cost Effectiveness and Resource Allocation 2010, 8:6
/>Page 10 of 12
the Burden of Disease Report for this study are becoming
out of date [14]. The recent primary care trusts pro-
gramme budget is beginning to provide more reliable
estimates of these cost figures [36]. However, no detailed
data on aSAH were available from this new source when
performing this study. The characteristics and manage-
ment of patients in a clinical trial such as ISAT may differ
from routine clinical care and hence the parameters used
in this study may be subject to some degree of bias. For
example, the proportion of patients attending a follow-up
angiogram or a rehabilitation programme was extracted
from ISAT and therefore refers only to treated aneu-
rysms. The same proportions for untreated aneurysm
were not available when conducting this study. However,
the sensitivity analysis showed the effect of varying these
parameters on the overall costs. Finally, the one-way sen-
sitivity analysis performed ignores any possible covari-
ance across different categories of costs and hence this
aspect needs to be considered in future research.
An additional limitation of the current research was the
ability to include co-morbidity costs related to aSAH.
Aggregate data on finished admissions where aSAH was
the primary diagnosis was the main source used in the
calculation of the hospital inpatient admission costs and
the number of patients with aSAH. If co-morbidities
costs are substantial our results may be sensitive to this
parameter.
Cost-of-illness studies have been criticised for the vari-
ety of methods applied to report their results. This
reflects the fact that clear guidelines on how to conduct
these analyses are not currently available [37]. This
research mainly uses aggregate data coded by specific
aSAH diagnosis to minimise the bias of including poten-
tial costs not related to the disease. It can be argued that
using this type of data from national databases is subject
to confounding across health areas. Nevertheless, the
type of health care received by aSAH patients is very spe-
cific and therefore the impact of confounding on the
overall costs estimated is expected to be limited. In addi-
tion, cost-of-illness studies are systematically different
from traditional methods of economic evaluation and
therefore the results from such studies cannot be inter-
preted in the same manner. This has received some criti-
cism from the health economics community and
although this is partly true, cost-of-illness studies provide
useful information to prioritise healthcare. Cost-of-ill-
ness studies provide information that may be useful to
decision makers when identifying priority disease areas
for research funding and to develop prevention policies
[11]. In addition, these studies provide a framework to
Figure 1 Sensitivity of National Health Service (NHS) aSAH-related costs to ± 20% changes in key factors
Rivero-Arias et al. Cost Effectiveness and Resource Allocation 2010, 8:6
/>Page 11 of 12
evaluate the impact of population changes such as ageing
on health outcomes and overall healthcare costs. Finally,
the results reported here will provide useful information
with which to populate economic models of interventions
in the field of aSAH.
Conclusion
The economic and disease burden of aSAH in the United
Kingdom is reported in this study. Decision-makers can
use these results to complement other information when
informing prevention policies in this field and to relate
health care expenditures to disease categories. In addi-
tion, the results from this study will inform future epide-
miological and economic models with useful data on
quality of life and costs of patients with aSAH.
List of abbreviations
aSAH: Aneurysmal subarachnoid haemorrhage; CHHS:
Community Health and Social Services; CVD: Cardiovas-
cular disease; EQ-5D: EuroQol 5 dimension instrument;
HES: Hospital Episode Statistics; HRQL: Health-related
quality of life; ICD-10: International Classification of Dis-
eases 10th revision; ISAT: International Subarachnoid
Aneurysm Trial; LYs: Life-years; NHS: National Health
Service; ONS: Office for National Statistics; OXVASC:
Oxford Vascular Study; QALE: Quality-adjusted life
expectancy; QALYs: Quality-adjusted life years; UK:
United Kingdom.
Competing interests
This research was supported by an unrestricted grant from Actelion Pharma-
ceuticals Ltd. Oliver Rivero-Arias is funded by a Researcher Development
Award from the Department of Health and NHS R&D. The Health Economics
Research Centre receives some of its funding from the National Institute of
Health Research. The authors report no conflict of interest.
Authors' contributions
ORA revised the original project proposal, collected, analysed and interpreted
the data and wrote the main draft of the manuscript. AG wrote the original
project proposal, supervised the main analysis and revised the manuscript. JW
revised the original project proposal, supervised the main analysis and revised
the manuscript. All authors read and approved the final manuscript.
Acknowledgements
We thank Jose Leal and Ramon Luengo-Fernandez for advice on dealing with
national aggregate data, and Jose Leal and Borislava Mihaylova for statistical
advice on generating life tables. We are grateful to Elke Hunsche for helpful
and constructive comments on earlier drafts of this manuscript. We are
indebted to the International Subarachnoid Aneurysm Trial (ISAT) Collabora-
tive Group for access to epidemiological and cost data for this study. The com-
ments and suggestions from three anonymous referees are greatly
appreciated.
Author Details
Health Economics Research Centre, Department of Public Health, University of
Oxford, UK
Figure 2 Sensitivity of aSAH disease-related costs to ± 20% changes in key factors
Rivero-Arias et al. Cost Effectiveness and Resource Allocation 2010, 8:6
/>Page 12 of 12
References
1. van Gijn J, Kerr RS, Rinkel GJ: Subarachnoid haemorrhage. Lancet 2007,
369:306-318.
2. Suarez JI, Tarr RW, Selman WR: Aneurysmal subarachnoid hemorrhage.
New England Journal of Medicine 2006, 354:387-396.
3. Wilby MJ, Sharp M, Whitfield PC, Hutchinson PJ, Menon DK, Kirkpatrick PJ:
Cost-effective outcome for treating poor-grade subarachnoid
hemorrhage. Stroke 2003, 34:2508-2511.
4. Roos YBWE, Dijkgraaf MGW, Albrecht KW, Beenen LFM, Groen RJM, de
Haan RJ, Vermeulen M: Direct costs of modern treatment of aneurysmal
subarachnoid hemorrhage in the first year after diagnosis. Stroke 2002,
33:1595-1599.
5. Wolstenholme J, Rivero-Arias O, Gray A, Molyneux AJ, Kerr RS, Yarnold JA,
Sneade M, International Subarachnoid Aneurysm Trial (ISAT):
Collaborative Group Treatment pathways, resource use, and costs of
endovascular coiling versus surgical clipping after aSAH. Stroke 2008,
39:111-119.
6. Global Burden of Disease and Risk Factors. Edited by: Lopez AD, et al.
New York: OUP and WHO; 2006.
7. Global Comparative Assessments in the Health Sector. Edited by:
Murray CJL, Lopez AD. Geneva: World Health Organization; 1994.
8. Clabaugh G, Ward MM: Cost-of-illness studies in the United States: A
systematic review of methodologies used for direct cost. Value in
Health 2008, 11:13-21.
9. Luengo-Fernandez R, Leal J, Gray A, Petersen S, Rayner M: Cost of
cardiovascular diseases in the United Kingdom. Heart 2006,
92:1384-1389.
10. Rothwell PM, Coull AJ, Silver LE, Fairhead JF, Giles MF, Lovelock CE,
Redgrave JN, Bull LM, Welch SJ, Cuthbertson FC, Binney LE, Gutnikov SA,
Anslow P, Banning AP, Mant D, Mehta Z, Oxford VS: Population-based
study of event-rate, incidence, case fatality, and mortality for all acute
vascular events in all arterial territories (Oxford Vascular Study). Lancet
2005, 366:1773-1783.
11. Byford S, Torgerson DJ, Raftery J: Economic note: cost of illness studies.
British Medical Journal 2000, 320:1335-1335.
12. Department of Health: NHS Finance Manual. Financial Matters;
Newsletter. 2008 [ />Newsletters?OpenView]. Department of Health Last Accessed: 8 January
2010
13. Department of Health: Hospital Episodes Statistics, England: Financial
Year 2005-06. London: Department of Health; 2006.
14. Department of Health: Burden of Disease: A Discussion Document.
London: NHS Executive; 1996.
15. McCormick A, Fleming D, Charlton J: Morbidity statistics from general
practice: fourth national study 1991-92. London: HMSO; 1995.
16. Social Trends no 36. Edited by: Babb P, et al. London: Office for National
Statistics; 2006.
17. Molyneux AJ, Kerr RSC, Yu LM, Clarke M, Sneade M, Yarnold JA, Sandercock
P: International subarachnoid aneurysm trial (ISAT) of neurosurgical
clipping versus endovascular coiling in 2143 patients with ruptured
intracranial aneurysms: a randomised comparison of effects on
survival, dependency, seizures, rebleeding, subgroups, and aneurysm
occlusion. Lancet 2005, 366:809-817.
18. Office for National Statistics: Mortality Statistics. London: Office for
National Statistics; 2005.
19. Muennig PA, Gold MR: Using the years-of-healthy-life measure to
calculate QALYs. American Journal of Preventive Medicine 2001, 20:35-39.
20. EuroQol Group EuroQol - a new facility for the measurement of health-
related quality of life. Health Policy 1990, 16:199-208.
21. Kind P, Hardman G, Macran S: UK population norms for EQ-5D.
Discussion paper 172: Centre for Health Economics, University of York, UK
1999.
22. Department of Health: NHS Reference costs 2006. 2006 [http://
www.dh.gov.uk/en/Publicationsandstatistics/Publications/
PublicationsPolicyAndGuidance/DH_062884]. Department of Health Last
Accessed: 8 January 2010
23. Curtis L, Netten A: Unit costs of health and social care. University of Kent
at Canterbury: Personal Social Services Research Unit; 2006.
24. Clinical Effectiveness Unit: National Study of Subarachnoid
Haemorrhage. London: The Royal College of Surgeons of England and
the London School of Hygiene and Tropical Medicine; 2006.
25. Comas-Herrera A, Wittenberg R, Costa-Font J, Gori C, Di Maio A, Patxot C,
Pickard L, Pozzi A, Rothgang H: Future long-term care expenditure in
Germany, Spain, Italy and the United Kingdom. Ageing & Society 2006,
26:285-302.
26. Rowlands O: General household survey 1995, supplement A: informal
carers. London: The Stationary Office; 1998.
27. Green H: General household survey 1985, supplement A: informal
carers. London: HMSO; 1988.
28. EUROSTAT: Data Explorer: Hampered in daily activities by any physical
or mental health problem, illness or disability. Eurostat 2009 [http://
ec.europa.eu/eurostat]. Last Accessed: 8 January 2010
29. Office of National Statistics: Annual Survey of Hours and Earnings.
London: Office for National Statistics; 2005.
30. Department for Business, Innovation and Skills: National Minimum Wage
(NMW). 2010 [ />national-minimum-wage/index.html]. Department for Business,
Innovation and Skills Last Accessed: 8 January 2010
31. Pritchard C, Sculpher M: Productivity costs: Principles and practice in
economic evaluation. London: Office of Health Economics; 2000.
32. Koopmanschap MA, van Ineveld BM: Towards a new approach for
estimating indirect costs of disease. Soc Sci Med 1992, 34:1005-1010.
33. Leal J, Luengo-Fernandez R, Gray A, Petersen S, Rayner M: Economic
burden of cardiovascular diseases in the enlarged European Union.
European Heart Journal 2006, 27:1610-1619.
34. Katati MJ, Santiago-Ramajo S, Perez-Garcia M, Meersmans-Sanchez JM,
Vilar-Lopez R, Coin-Mejias MA, Caracuel-Romero A, rjona-Moron V:
Description of quality of life and its predictors in patients with
aneurysmal subarachnoid hemorrhage. Cerebrovascular Diseases 2007,
24:66-73.
35. Ware JEJ: SF-36 health survey update. Spine 2000, 25:3130-3139.
36. Department of Health: National Programme Budget project. 2007
[ />Financeandplanning/Programmebudgeting/index.htm]. Department of
Health Last Accessed: 8 January 2010
37. Akobundu E, Ju J, Blatt L, Mullins CD: Cost-of-illness studies: A review of
current methods. PharmacoEconomics 2006, 24:869-890.
doi: 10.1186/1478-7547-8-6
Cite this article as: Rivero-Arias et al., Burden of disease and costs of aneu-
rysmal subarachnoid haemorrhage (aSAH) in the United Kingdom Cost Effec-
tiveness and Resource Allocation 2010, 8:6
Received: 22 April 2009 Accepted: 27 April 2010
Published: 27 April 2010
This article is available from: 2010 Rivero-Arias et al; licensee BioMed Central Ltd. This is an Open Access article distributed under the terms of the Creative Commons Attribution License ( ), which permits unrestricted use, distribution, and reproduction in any medium, provided the original work is properly cited.Cost Effect iveness and Resou rce Allocation 2010, 8:6