Báo cáo y học: "Cost-effectiveness of continuous glucose monitoring and intensive insulin therapy for type 1 diabetes" ppsx
Bạn đang xem bản rút gọn của tài liệu. Xem và tải ngay bản đầy đủ của tài liệu tại đây (381.62 KB, 8 trang )
RESEARCH Open Access
Cost-effectiveness of continuous glucose
monitoring and intensive insulin therapy for type
1 diabetes
R Brett McQueen
1*†
, Samuel L Ellis
2†
, Jonathan D Campbell
1†
, Kavita V Nair
1†
and Patrick W Sullivan
3†
Abstract
Background: Our objective was to determine the cost-effectiveness of Continuous Glucose Monitoring (CGM)
technology with intensive insulin therapy compared to self-monitoring of blood glucose (SMBG) in adults with
type 1 diabetes in the United States.
Methods: A Markov cohort analysis was used to model the long-term disease progression of 12 different diabetes
disease states, using a cycle length of 1 year with a 33-year time horizon. The analysis uses a societal perspective
to model a population with a 20-year history of diabetes with mean age of 40. Costs are expressed in $US 2007,
effectiveness in quality-adjusted life years (QALYs). Parameter estimates and their ranges were derived from the
literature. Utility estimates were drawn from the EQ-5D catalogue. Probabilities were derived from the Diabetes
Control and Complications Trial (DCCT), the United Kingdom Prospective Diabetes Study (UKPDS), and the
Wisconsin Epidemiologic Study of Diabetic Retinopathy. Costs and QALYs were discounted at 3% per year.
Univariate and Multivariate probabilistic sensitivity analyses were conducted using 10,000 Monte Carlo simulations.
Results: Compared to SMBG, use of CGM with intensive insulin treatment resulted in an expected impr ovement in
effectiveness of 0.52 QALYs, and an expected increase in cost of $23,552, resulting in an ICER of approximately
$45,033/QALY. For a willingness-to-pay (WTP) of $100,000/QALY, CGM with intensive insulin therapy was cost-
effective in 70% of the Monte Carlo simulations.
Conclusions: CGM with intensive insulin therapy appears to be cost-effective relative to SMBG and other societal
health interventions.
Keywords: Cost-effectiveness analysis, Continuous Glucose Monitoring, Type 1 diabetes, Cost-utility analysis, Self-
Monitoring of Blood Glucose
Background
Diabetes mellitus and its complications continue to be a
growing burden on the United States health care system.
The American Diabetes Association (ADA) estimates
that as of 2007, the prevalence of type 1 and 2 diabetes
is over 24 million, growing at 1 million people diag-
nosed with diabetes per year since 2002 [1]. The ADA
estimated an annual cost in 2007 of $174 billion due to
diabetes, $116 b illion of that due to direct medical costs
of diabetes and chronic conditions related to diabetes
[1]. There is an obvious need for reductions in costs
related to diabetes while improving management of the
disease, thus increasing the quality of life of persons
with diabetes.
Clinical evidence shows that improvements in hemo-
globin A1c levels (i.e., < 7% recommended by the ADA
[1]) can reduce or delay complications related to both
type1and2diabetes[2-4].Diabetescomplications
include microvascular (i.e., retinopathy, nephropathy,
neuropathy), macrovascular (i.e., coronary heart disease,
cerebrovascular disease, peripheral artery disease), and
short - term severe hypoglycemic complications [5].
Minimal reductions in A1c levels have been documented
* Correspondence: Robert.mcqueen@ucd enver.edu
† Contributed equally
1
Pharmaceutical Outcomes Research Program, School of Pharmacy,
University of Colorado Denver, Aurora, Colorado, USA
Full list of author information is available at the end of the article
McQueen et al. Cost Effectiveness and Resource Allocation 2011, 9:13
/>© 2011 McQueen et al ; licensee BioMed Central Ltd. This is an Open Access article distributed under the terms of the Creative
Commons Attribution License ( which permits unrestricted use, distribution, and
reproduction in any medium, provided the original work is properly cited.
in long - term and short - term studies to reduce co mpli-
cations that can result in significant cost savings [6,7]. To
assess glycemic control the ADA has recommendations
for both glucose monitoring and A1c target levels [5].
For persons with type 1 diabetes, intensive insulin ther-
apy (e.g., inject ions, pump therapy) is needed, along with
self-monitoring of blood glucose (SMBG) often multiple
times per day [5]. While SMBG with intensive insulin
therapy has been shown to be important for managing
glucose levels [2,7-9], recent evidence has shown that
continuous glucose monitoring (CGM) with intensive
insulin therapy reduces overall A1c levels further, while
holding hypoglycemic episodes constant [10-12]. In addi-
tion, recent evidence from a clinical trial population has
examined the cost-effectiveness of CGM. The authors
found that CGM was cost-effective (< $100,000/QALY)
for type 1 diabetes meeting their clinical trial inclusion/
exclusion criteria [ 13]. Given the increasing evidence of
the clinical and economic benefit of CGM in clinical trial
populations, it is important to assess whether broadening
its use to a wider U.S. population would be cost-effective.
The objective of this analysis is to assess the cost-
effectiveness of CGM with intensive insulin therapy rela-
tive to standard care (i.e., SMBG with intensive insulin
therapy) in a general U.S. population of individuals with
type 1 diabetes.
Methods
Markov Cohort Simulation Model
A population level Markov cohort simulation was
employed to model the long-term disease progression of
patients with type 1 diabetes. Long-term (i.e., micro and
macrovascular) events for each arm were modeled via
reductions in A1c levels. The baseline characteristics of
this population cohort reflect those of the adult popula-
tion (i.e., 25 years of age and older) in the Tamborlane
et al. study on CGM [10]. All subjects were type 1 dia-
betes patients, with approximately 20 ye ars since diag-
nosis, a mean age of 40 years, and a mean A1c level of
7.6% (+ or - 0.5%). A cycle length of one year was used
for the Markov analysis, with a time horizon of 33 years,
assuming a life expec tancy of 73 years. The Markov
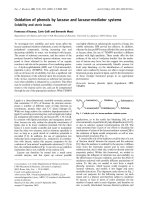
model is represented in a decision analysis format (Fig-
ure 1), using TreeAge Pro 2009 (TreeAge Software, Wil-
liamstown, MA, USA). Continuous glucose monitoring
with self-monitoring of blood glucose is compared to
self-monitoring of blood glucose alone. All costs are in
2007 US dollars, and a discount rate of 3% was used for
costs and QALYs.
There are many widely published and validated mod-
els, such as the CORE Diabetes Model, that project
long-term diabetes outcomes [14,15]. However, we built
a model targeted specifically towards the clinical benefit
of CGM technology in a population with characteristics
similar to the Tamborlane et al. adult type 1 diabetes
studypopulation[10].Inparticular, Tamborlane et al.
found a mean reduction in A1c of 0.5% over the trial
time period for the adult patients using CGM technol-
ogy[10].The0.5%reductioninA1cwasusedforthe
derivation of the four CGM risk reduction parameter s
in our model (Table 1). The level of detail for the calcu-
lation of input parameters in our model was not avail-
able in published CORE Diabetes Model studies. We
used inputs and assumptions from the model built by
the C.D.C. Cost-Effectiveness Group [16,17], other lit-
erature sources [18,19], and the expertise offered by our
research team. The C.D.C. Cost-Effectiveness Group
used similar modeling inputs and assumptions as were
used in the CORE Diabetes Model (i.e., inputs derived
from the Diabetes Control and Complications Trial
(DCCT), the United Kingdom Prospective Diab etes
Study (UKPDS), and other literature sources) [14-17].
Therefore, the model we built was based on similar
inputs and assumptions used to develop the CORE Dia-
betes Model, but tailored to serve the needs of our ana-
lysis. For more information on model inputs and
assumptions please see Additional File 1.
In this model, all members of the population start
with no complications. After this, the population can
transiti on to one of six health states including retinopa-
thy, nephropathy, neuropathy, Coronary Heart Disease
(CHD), continue with diabetes and no complication s, or
death. From the five disease states, the population may
then enter an additional seven disease states: nephropa-
thy and CHD, neuropathy and CHD, retinopathy and
CHD, neuropathy and nephropathy, blindness, end stage
renal disease, lower extremity amputation and neuro pa-
thy, or death (transition probabilities shown in Table 1).
Patients can develop a maximum of four concomitant
chronic comorbidities in the Markov model.
Input Parameters
As delineated in Table 1, transition probabilities are
drawn from the best available estimates from the litera-
ture [16-19]. Based on evidence from Klein et al. [18],
the transition probabilities of going from nephropathy
to CHD (0.022), neuropathy to CHD (0.029), and retino-
pathy to CHD (0.028) are equal to the estimates of
going from CHD back to the respective microvascular
disease states. The transition probability from neuropa-
thy to nephropathy (0.097) is conditional and drawn
directly from Wu et al [19]. When the population enters
concomitant disease states such as neuropathy and
nephropathy for example, they are limited to that state
for the rest of the cycle. The transition back into each
concomitant disease state is the complimentary prob-
ability based on mortality rates (available in Additional
File 1).
McQueen et al. Cost Effectiveness and Resource Allocation 2011, 9:13
/>Page 2 of 8
The probability estimates just described show the pro-
gression of diabetes for those with an average A1c level
of around 8%. CGM has been shown to reduce A1c
levels by 0.5% in adult patients [ 10]. CGM exhibited its
relative risk reduction fo r development of chronic
comorbidity as a result of its reduction in A1c levels.
Risk reduction parameters were drawn from two
sources: the DCCT [20] for microvascular complica-
tions, and a meta - analysis relating to macrovascular
complications by Selvin et al [21].
Utility values for each disease state were taken from
theEQ-5DcataloguebySullivanetal(Table1)[22].
Each disease state begins with the unadjusted mean EQ-
5D score from the population in MEPS 2000-2002 with
diabetes mellitus, adjusted to reflect a mean age of 40
years. The utility calculation for each disease state also
includes deductions for age by cycle length, and dis-
counting by 3% [23]. There are a total o f 12 different
utilities for each disease state. Incremental effectiveness
is expressed in quality-adjusted life year s (QALYs)
gained.
Costs were derived from evidence published by the
ADA [1]. The annual mean cost of diabetes represents
the per capita expenditures for people with diabetes at
all age groups for hospital inpatient visits, nursing/resi-
dential facility visits, physician’s office visits, emergency
department (ED) trips, ho spital outpatient visits, home
health care, hospi ce care, podiatry care, insulin, diabet ic
supplies, oral agents , retail prescriptions, other suppli es,
and patient time [1]. Lost wages served a s a proxy for
patient time. The ADA estimates that people with dia-
betes experience an additional 2.5 days absent compared
to those without diabetes [1]. The authors also esti-
mated that the same population with diabetes on aver-
age earns $250 a day. They also estimate that the
population aged 64 or less has approximately $625 of
patient time per year for annual treatment of diabetes
[1]. The assumption for the population over 64 is one
day of lost wages ($250). Other costs i n the model
include marginal annual costs for each disease state,
such as blindness, end stage renal disease, lower extre-
mity amputation and neuropathy, retinopathy, neuropa-
thy, nephropathy, and CHD, along with the concomitant
disease states. The marginal costs for each disease state
were calculated using average length of stay in an inpati-
ent hospital setting and the cost per medical event, esti-
mated from the ADA [1]. Costs per health state are
delineated in Table 1. The concomitant disease states
were estimated by summing the marginal cost for each
disease state, with the exception of blindness, lower
extremity amputation, and end stage renal disease ( i.e.,
neuropathy and CHD, nephropathy and CHD, retinopa-
thy and CHD, neuropathy and nephropathy, where each
were calculated separately). While the summation
Health states for years 1
Additional possible health
states for
y
ears 2
Figure 1 Conceptual Markov model in decision tree format. Both arms include self-monitoring of blood glucose (SMBG), but the technology
arm includes the addition of continuous glucose monitoring (CGM). Health states are the same for both arms.
McQueen et al. Cost Effectiveness and Resource Allocation 2011, 9:13
/>Page 3 of 8
Table 1 Parameters for Type 1 Diabetes Markov Model
Transition Probabilities [Annual cycle length]
a
Mean 2.5%
b
97.50% Reference
Retinopathy to blindness 0.101 0.057 0.156 Hoerger et al. [16,17]
Diabetes with no complications to CHD 0.031 0.018 0.048 Hoerger et al. [16,17]
Subsequent LEA 0.110 0.062 0.169 Hoerger et al. [16,17]
Diabetes with no complications to nephropathy 0.072 0.041 0.112 Klein et al. [18]
Nephropathy to CHD 0.022 0.013 0.034 Klein et al. [18]
Nephropathy to ESRD 0.072 0.041 0.109 Hoerger et al. [16,17]
Diabetes with no complications to neuropathy 0.035 0.020 0.055 Klein et al. [18]
Neuropathy to CHD 0.029 0.016 0.044 Hoerger et al. [16,17]
Neuropathy to LEA 0.131 0.074 0.200 Hoerger et al. [16,17]
Neuropathy to nephropathy 0.097 0.055 0.149 Wu et al. [19]
Diabetes with no complications to retinopathy 0.011 0.006 0.017 Hoerger et al. [16,17]
Retinopathy to CHD 0.028 0.016 0.043 Klein et al. [18]
Cost Parameters [Annual or initial costs represented in 2007 US$]
c
Blindness and retinopathy 9,912 7,251 12,945 ADA [1]
CGM technology 4,189 3,062 5,492 CGM website [24]
Initial cost of CGM technology 4,809 3,499 6,321 CGM website [24]
CHD 35,271 25,820 46,433 ADA [1]
Diabetes with no complications 6,705 4,879 8,788 ADA [1]
ESRD 36,370 26,377 47,708 ADA [1]
LEA 50,150 36,541 65,798 ADA [1]
Nephropathy 20,161 14,614 26,643 ADA [1]
Neuropathy 25,075 18,226 33,004 ADA [1]
Retinopathy 4,956 3,578 6,489 ADA [1]
Utility Parameters [Annual cycle length]
a
Blindness 0.569 0.531 0.607 Sullivan et al. [22] ICD-9 250
CHD 0.552 0.513 0.591 Sullivan et al. [22] ICD-9 250, 593
ESRD 0.521 0.485 0.558 Sullivan et al. [22] ICD-9 250, 355
LEA 0.572 0.538 0.604 Sullivan et al. [22] ICD-9 250, 362
Nephropathy 0.575 0.545 0.606 Sullivan et al. [22] ICD-9 250, 355, 593
Nephropathy and CHD 0.516 0.465 0.567 Sullivan et al. [22] ICD-9 250, 593, 410, 413
Neuropathy 0.603 0.573 0.632 Sullivan et al. [22] ICD-9 250, 355, 410, 413
Neuropathy and CHD 0.544 0.495 0.593 Sullivan et al. [22] ICD-9 250, 362, 410, 413
Neuropathy and nephropathy 0.557 0.520 0.595 Sullivan et al. [22] ICD-9 250, 410, 413
Diabetes with no complications 0.757 0.747 0.767 Sullivan et al. [22] ICD-9 250, 593, 586
Retinopathy 0.612 0.581 0.643 Sullivan et al. [22] ICD-9 250, 355, 354
Retinopathy and CHD 0.553 0.503 0.605 Sullivan et al. [22] ICD-9 250, 362, 369
Disutility of age -0.0003 Sullivan et al. [22]
Other Parameters
d
CGM risk reduction for CHD 0.050 0.013 0.107 DCCT [20]
CGM risk reduction for nephropathy 0.270 0.006 0.768 DCCT [20]
CGM risk reduction for neuropathy 0.188 0.004 0.593 DCCT [20]
CGM risk reduction for retinopathy 0.306 0.075 0.618 Selvin et al. [21]
Start age 40 Assumption
Years since diagnosis 20 Assumption
Discount rate 0.03 Assumption
a Beta distribution assumed
b Credible range of values from the 2.5th and 97.5th percentiles of the 10,000 second order Monte Carlo simulations
c Gamma distribution assumed for all cost parameters
d Beta distribution assumed for all risk reduction parameters; start age, years since diagnosis, and discount rate wer e not varied
McQueen et al. Cost Effectiveness and Resource Allocation 2011, 9:13
/>Page 4 of 8
assumption for marginal costs of each combination of
disease states may overestimate the costs associated with
having those disease states, the ADA does note t heir
cost estimates are an underestimate of the societal cost
attributable to diabetes [1]. CGM costs were estimated
from a diabetes technology and treatment purchasing
website [24]. Annual and initial costs are an a verage
based on 3 systems, the Guardian Real - Time, Dexcom
seven, and MiniMed Paradigm Real - Time system. The
initial cost of CGM ($4,809) consists of the monitor,
transmitter, two hours of patient time for education,
and sensors for the firs t year. The annual costs ($4,189)
thereafter include additional sensors per year, two hours
of patient time for maintenance, and additional trans-
mitters and batteries for the year. The initial CGM cost
estimate is included in the zero cycle of the Markov
model node CGM. The annual cost of CGM is then
included in all disease states including no complications
after cycle zero.
The all cause mortality rate was based on an average
of all race categories (N on-Hispanic white, Afri can-
American, Hispanic, Native American, and Asian), and
gender, from the C.D.C. Cost-Effectiveness g roup [16].
Increased mortality risks were drawn from the Early
Treatment D iabetic Retinopathy Study (ETDRS) by
Cusick et al [25]. The tables for each mortality rate
(neuropathy, nephropathy, CHD, LEA, and ESRD, and
each concomitant disease state) are available in Addi-
tional File 1.
Sensitivity Analysis
Probabilistic sensitivit y analysis was performed using
Monte Carlo simulation to evalua te the multivariate
uncertainty in the model. The input parameters were
varied simultaneously over specified ranges. Various
probability distributions were chosen based on assump-
tions for each input parameter. The beta distribution
was specified for the probability, utility, and risk reduc-
tion parameters. The Gamma distribution was specified
for the cost parameters. The Monte Carlo simulation
drew values for each input parameter and calculated
expected cost and effectiveness for each arm of t he
model. This process was repeated 10,000 times to give a
range of all expected cost and effectiveness values. Addi-
tionally, univariate sensitivity analysis was conducted to
identify variables that had the largest impact on the
model results. For the univariate sensitivity analysis we
varied all parameters shown in Table 1 by +/- 15%. The
parameters that had the largest impact on the model
results are presented in a tornad o diagram. The top ten
variables from the tornado d iagram were individually
varied by 50% to estimate the effect on the model
results.
Results
Base - Case Analysis
The results for the base-case analysis are shown in
Table 2. The mean total lifetime c osts for SMBG were
$470,583. The mean total lifetime costs for SMBG and
CGM technology totaled $494,135, resulting in an incre-
mental cost of $23,552. Lifetime effectiveness for SMBG
was 10.289 QALYs. Lifetime effectiveness for SMBG
with the addition of CGM technology was 10.812
QALYs, resulting in an incremental effectiveness of
0.523 QALYs. The incremental cost-effectiveness ratio
(ICER) was $45,033 per QALY for CGM technology.
Mortality was not directly reduced by CGM; it simply
reduced the probability of entering disease states,
thereby delaying the increased mortality from
complications.
Sensitivity Analysis
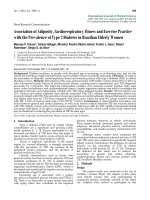
Results of the probabilistic sensitivity analysis are show n
in Table 2 and F igure 2. The ranges given in Table 2
are 95% credible ranges for the expected cost and effec-
tiveness. Figure 2 is a scatter plot of incremental cost-
effectiveness pairs for the use of CGM with SMBG vs.
SMBG only. The dashed diagonal line represents US
$50,000 per QALY. Each dot repres ents one simulation.
The ICER estimates in the southeast quadrant make up
10.66% of the simulations, and indicate that CGM is less
costly and more effective, dominating SMBG. The rest
of the simulations lie in the northeast quadrant with
36.96% below US$50,000/QALY. Results show that 48%
of the observations are cost-effective for a willingness-
to-pay of US$50,000 per QALY and 70% for a WTP of
$100,000/QALY.
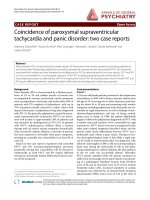
The univariate sensitivity analysis results are shown in
Figure 3 as a tornado diagram, expressed in terms of
net monetary benefit. Net monetary benefit is calculated
by taking the difference in e ffectiveness and multiplying
by society’ s willingness-to-pay, less the difference in
costs. After identifying the ten variables with the largest
impact on the model results, each was varied individu-
ally by 50%. The utility of diabetes with no complica-
tions, the annual cost of CHD, and the probability of
going from diabetes with no complications to the CHD
disease state, had the largest impact on the model
results. The utility of diabetes with no complications
was decreased by 50%, and the corresponding incremen-
tal effectiveness dramatically decreased, resulting in an
ICER over US$300 ,000/QALY. When the utili ty of dia-
betes with no complications was increased by 50%,
incremental effectiveness increased, decreasing the ICER
to approximately US$ 30, 000/QALY. The annu al cost of
CHD also had a large impact on the model results, and
when decreased by 50%, the ICER was US$86,000/
McQueen et al. Cost Effectiveness and Resource Allocation 2011, 9:13
/>Page 5 of 8
QALY. When the annual cost of CHD was increased by
50% the ICER was US$12,000/QALY. The probability of
going from diabetes with no complications to the CHD
disease state was decreased by 50%, estimating an ICER
of approximately US$66,000/QALY. When the probabil-
ity of e ntering the CHD disease state was increased by
50% the ICER was US$32,000/QALY. The other vari-
ables listed in the tornado diagram were also varied by
50%, but offered no meaningful impact on the model
results (within the range of US$40,000/QALY to US
$60,000/QALY).
Discussion
CGM may be an important clinical technology for
man aging diabetes. The objective of this analysis was to
determine the cost-effectiveness of CGM at a population
level. The current model estimated the progression of
chronic disease in a population with type 1 diabetes.
CGM reduced the progression of chronic disease and
mortality relative to SMBG alone. The base case analysis
resulted in an ICER of US$45,033/QALY. Results from
the probabilistic sensitivity analysis indicate 48% of the
Monte Carlo simulations were under US$50,000/QAL Y,
while 70% were under US$100,000/QALY. These results
suggest that CGM is cost-effective compared with
SMBG and other societal health interventions.
There are limitations to this analysis. T he probability
values are from different sample populations. The
probabilities are constant with ea ch cycle, indicating
no increase in the risk of complications due to diabetes
over time. Given that the baseline probabilities reflect
a population of very ill patients with type 1 diabetes,
the assumption may still be valid, par ticularly for the
cohort averages (which this analysis models). The
cumulative incidence of CHD (Angina and myocardial
infarction) from Klein et al. was not significantly asso-
ciated with A1c levels [18]. In other words, increasing
levels of A1c were not significantly associated with the
incidence of CHD. Nevertheless, we assumed an A1c
level of 8% when deriving the transition probability
into each state involving CHD. This model also did
not explicitly model hypoglycemic events. This is a sig-
nificant draw back considering man y type 1 dia betes
patients specifically purchase a continuous monitor for
reductions in hypoglycemic events. However, the data
on the ability of CGM to reduce hypoglycemic events
is not conclusive and thus it was not included in the
model. As the evidence becomes clearer, future models
should examine its impact. T his model also did not
explicitly model hypertension control, which is known
to impact the development of diabetes complications.
Hypertension control was also omitted from the struc-
tural model because it was not clear from curren t evi-
dence that CGM would differentially affect
hypertension control.
Thepreviouscost-effectivenessanalysisbyHuanget
al. found an immediate quality-of life-benefit for the
patients using CGM [13]. Although considerable uncer-
tainty was present, long-term projections indicated an
average gain i n QALYs of 0.60 and an ICER of less than
$100,000/QALY. The cost-effectiveness analysis by
Huang et al. provides important information about
CGM in a restricted clinical trial population. This analy-
sis differs from that of Huang et al. in several significant
ways. To begin, our analysis reflects the societal
Table 2 Expected Cost and Effectiveness of Continuous Glucose Monitoring (CGM) and Self-Monitoring of Blood
Glucose (SMBG)
Strategy Expected Cost in 2007 $US (range)* Expected Effectiveness QALYs (range)* Incremental cost-effectiveness ratio (ICER)
SMBG 470,583 (397,782 - 550,598) 10.289 (9.615 - 10.957)
CGM and SMBG 494,135 (420,381 - 571,631) 10.812 (9.894 - 11.887) US $45,033/QALY
*95% credible ranges based on the results from the 10,000 Monte Carlo simulations
Figure 2 Incremental cost-effectiveness scatter plot: CGM and
SMBG vs. SMBG only. Incremental cost-effectiveness scatter plot of
continuous glucose monitoring (CGM) and self-monitoring of blood
glucose (SMBG) vs. SMBG only. The diagonal dashed line represents
US$50,000 per quality-adjusted life year. Each point represents one
Monte Carlo simulation.
McQueen et al. Cost Effectiveness and Resource Allocation 2011, 9:13
/>Page 6 of 8
perspective. The cohort modeled was chosen to reflect a
general population of individuals with type 1 diabetes
and was not restricted to a specific clinical trial popula-
tion. The utilities in our study were taken from the EQ-
5D catalogue, which were derived from a nationally
representative population and the underlying EQ-5D
tariffs were from a U .S. community population. Our
model also includes explicit concomitant disease states,
which may be a better representation of the clinical
pathway associated with diabetes.
Conclusions
While the model has many limitations, it provides a
valid picture of diabetes disease progression and the
effect of lowering A1c levels in a representative general
population of individuals with type 1 diabetes. This ana-
lysis shows that CGM may be a cost-effective means of
lowering disease progression and complications via its
impact on A1c levels. Previous studies have documented
the beneficial clinical effects of CGM in this population.
Our study adds to this body of evidence by suggesting
that CGM may also provide a cost-effective means of
lowering A1c in a gene ral population. As long as th e
evidence continues to suggest that use of CGM helps to
lower A1c levels, it is important for individuals with
type 1 diabetes to h ave affordable access to and educa-
tion about this technology. This study suggests that for
individuals with type 1 diabetes and A1c above 8%,
CGM and SMBG with intensive insulin therapy is a
cost-effective alternative to SMBG alone with intensive
insulin therapy.
Additional material
Additional file 1: Appendix for Cost-Effectiveness of Continuous
Glucose Monitoring and Intensive Insulin Therapy for Type 1
Diabetes. This technical appendix provides further information regarding
the assumptions and calculations of the Markov Cohort simulation.
Appendix Table 1A shows the assumed distributional properties and
moments of the respective distributions. Appendix Table 2A and 2B
show information on mortality rates. Appendix Table 3 and 4 show more
information related to Diabetes costs, and costs related to CGM
technology.
List of Abbreviations
ADA: stands for American Diabetes Association; CGM: is Continuous Glucose
Monitoring; CHD: is Coronary Heart Disease; DCCT: is the Diabetes Control
and Complications Trial; ESRD: is End-Stage Renal Disease; ETDRS: is the Early
Treatment Diabetic Retinopathy Study; LEA: is Lower Extremity Amputation;
QALYs: are quality-adjusted life years; SMBG: is Self-Monitoring of Blood
Glucose; UKPDS: is the United Kingdom Prospective Diabetes Study; and
WTP: is willingness-to-pay.
Acknowledgements
We have no acknowledgements to declare.
Author details
1
Pharmaceutical Outcomes Research Program, School of Pharmacy,
University of Colorado Denver, Aurora, Colorado, USA.
2
Department of
Clinical Pharmacy, School of Pharmacy, University of Colorado Denver,
Denver, Aurora, Colorado, USA.
3
Department of Pharmacy Practice, Regis
University, Denver, Colorado, USA.
Authors’ contributions
RBM drafted the manuscript. All authors participated in the design of the
Markov model. SLE reviewed and revised the clinical plausibility of the
model. PWS reviewed and revised the Mark ov model assumptions, and
interpretation of the model results. JDC and KVN revised Figure 1 and wrote
portions of the revised Methods section. All authors read, revised, and
approved the final manuscript.
Figure 3 Tornado diagram of the variables that have the largest impact on the model results. The ten variables with the largest impact
on the model results (each while holding all other variables constant) are listed in descending order. Utility of diabetes with no complications
had the largest impact on the model results.
McQueen et al. Cost Effectiveness and Resource Allocation 2011, 9:13
/>Page 7 of 8
Competing interests
The authors declare that they have no competing interests. The authors
designed, conducted, and reported this research without funding or any
external assistance.
Received: 7 January 2011 Accepted: 14 September 2011
Published: 14 September 2011
References
1. American Diabetes Association: Economic Costs of Diabetes in the U.S. in
2007. Diabetes Care 2008, 31(3):596-615.
2. The Diabetes Control and Complications Trial Research Group: The Effect
Of Intensive Treatment Of Diabetes On The Development And
Progression Of Long-Term Complications In Insulin-Dependent Diabetes
Mellitus. New England Journal of Medicine 1993, 329(14):977-986.
3. Genuth SM, Lachin JM, Orchard TJ, Raskin P, Zinman B: Intensive Diabetes
Treatment and Cardiovascular Disease in Patients with Type 1 Diabetes.
New England Journal of Medicine 2005, 353(25):2643-2653.
4. Writing Team for the Diabetes Control and Complications Trial/
Epidemiology of Diabetes: Sustained Effect of Intensive Treatment of
Type 1 Diabetes Mellitus on Development and Progression of Diabetic
Nephropathy: The Epidemiology of Diabetes Interventions and
Complications (EDIC) Study. JAMA 2003, 290(16):2159-2167.
5. American Diabetes Association: Standards of Medical Care in Diabetes-
2009. Diabetes Care 2009, 32(Supplement 1):S13-S61.
6. Wagner EH, Sandhu N, Newton KM, McCulloch DK, Ramsey SD,
Grothaus LC: Effect of Improved Glycemic Control on Health Care Costs
and Utilization. JAMA 2001, 285(2):182-189.
7. Schnell O, Hummel M, Weber C: Economic and Clinical Aspects of
Diabetes Regarding Self-Monitoring of Blood Glucose. Diabetes
Technology and Therapeutics 2008, 10(supplement 1).
8. Garg SK: Glucose Monitoring: An Important Tool for Improving Glucose
Control and Reducing Hypoglycemia. Diabetes Technology & Therapeutics
2008, 10(s1):S-1-S-4.
9. Naik RG, Ellis SL: Self-Monitoring of Blood Glucose in Insulin-Requiring
Type 2 Diabetes. Diabetes Technology & Therapeutics 2008, 10(s1):S-67-S-71.
10. Juvenile Diabetes Research Foundation Continuous Glucose Monitoring
Study Group: Continuous glucose monitoring and intensive treatment of
type 1 diabetes. New England Journal of Medicine 2008, 359(14):1464-76.
11. Bailey TS, Zisser HC, Garg SK: Reduction in hemoglobin A1C with real-
time continuous glucose monitoring: results from a 12-week
observational study. Diabetes Technology & Therapeutics 2007, 9(3):203-10.
12. Deiss D, Bolinder J, Riveline JP, Battelino T, Bosi E, Tubiana-Rufi N, Kerr D,
Phillip M: Improved glycemic control in poorly controlled patients with
type 1 diabetes using real-time continuous glucose monitoring. Diabetes
Care 2006, 29(12):2730-2.
13. The Juvenile Diabetes Research Foundation Continuous Glucose Monitoring
Study Group: The Cost-Effectiveness of Continuous Glucose Monitoring
in Type 1 Diabetes. Diabetes Care 2010, 33(6):1269-74.
14. Palmer AJ, Roze S, Valentine WJ, Minshall ME, Foos V, Lurati FM,
Lammert M, Spinas GA:
Validation of the CORE Diabetes Model against
epidemiological and clinical studies. Current Medical Research & Opinion
2004, 20(Suppl 1):S27-40.
15. Palmer AJ, Roze S, Valentine WJ, Minshall ME, Foos V, Lurati FM,
Lammert M, Spinas GA: The CORE Diabetes Model: Projecting long-term
clinical outcomes, costs and cost-effectiveness of interventions in
diabetes mellitus (types 1 and 2) to support clinical and reimbursement
decision-making. Current Medical Research & Opinion 2004, 20(Suppl 1):
S5-26.
16. The C.D.C. Cost-Effectiveness Group: Cost-effectiveness of Intensive
Glycemic Control, Intensified Hypertension Control, and Serum
Cholesterol Level Reduction for Type 2 Diabetes. JAMA 2002,
287(19):2542-2551.
17. Hoerger TJ, Harris R, Hicks KA, Donahue K, Sorensen S, Engelgau M:
Screening for type 2 diabetes mellitus: a cost-effectiveness analysis.
Annals of Internal Medicine 2004, 140(9):689-99.
18. Klein BE, Klein R, McBride PE, Cruickshanks KJ, Palta M, Knudtson MD,
Moss SE, Reinke JO: Cardiovascular Disease, Mortality, and Retinal
Microvascular Characteristics in Type 1 Diabetes: Wisconsin
Epidemiologic Study of Diabetic Retinopathy. Archives of Internal Medicine
2004, 164(17):1917-1924.
19. Wu SY, Sainfort F, Tollios JL, Fryback DG, Klein R, Klein BE: Development
and application of a model to estimate the impact of type 1 diabetes
on health-related quality of life. Diabetes Care 1998, 21(5):725-731.
20. The Absence of a Glycemic Threshold for the Development of Long-
Term Complications: The Perspective of the Diabetes Control and
Complications Trial. Diabetes 1996, 45(10):1289-1298.
21. Selvin E, Marinopoulos S, Berkenblit G, Rami T, Brancati FL, Powe NR,
Golden SH: Meta-Analysis: Glycosylated Hemoglobin and Cardiovascular
Disease in Diabetes Mellitus. Annals of Internal Medicine 2004,
141(6):421-431.
22. Sullivan PW, Ghushchyan V: Preference-Based EQ-5D Index Scores for
Chronic Conditions in the United States. Medical Decision Making 2006,
26:410-420.
23. Gold M, Siegel JE, Russell LB, Weinstein MC: Cost-Effectiveness in Health
and Medicine. New York: Oxford University Press; 1996.
24. Diabetes Mall for Continuous Glucose Monitoring. [http://www.
diabetesnet.com/diabetes_technology/continuous_monitoring.php].
25. Cusick M, Meleth AD, Agron E, Fisher MR, Reed GF, Knatterud GL, Barton FB,
Davis MD, Ferris FL, Chew EY, Early Treatment Diabetic Retinopathy Study
Research Group: Associations of mortality and diabetes complications in
patients with type 1 and type 2 diabetes: early treatment diabetic
retinopathy study report no. 27. Diabetes Care 2005, 28(3):617-25.
doi:10.1186/1478-7547-9-13
Cite this article as: McQueen et al.: Cost-effectiveness of continuous
glucose monitoring and intensive insulin therapy for type 1 diabetes.
Cost Effectiveness and Resource Allocation 2011 9:13.
Submit your next manuscript to BioMed Central
and take full advantage of:
• Convenient online submission
• Thorough peer review
• No space constraints or color figure charges
• Immediate publication on acceptance
• Inclusion in PubMed, CAS, Scopus and Google Scholar
• Research which is freely available for redistribution
Submit your manuscript at
www.biomedcentral.com/submit
McQueen et al. Cost Effectiveness and Resource Allocation 2011, 9:13
/>Page 8 of 8