Báo cáo y học: "Targeted versus universal prevention. a resource allocation model to prioritize cardiovascular preventio" pot
Bạn đang xem bản rút gọn của tài liệu. Xem và tải ngay bản đầy đủ của tài liệu tại đây (363.69 KB, 11 trang )
RESEARCH Open Access
Targeted versus universal prevention. a resource
allocation model to prioritize cardiovascular
prevention
Talitha L Feenstra
1,2*
, Pieter M van Baal
1,3
, Monique O Jacobs-van der Bruggen
1
, Rudolf T Hoogenveen
4
,
Geert-Jan Kommer
5
and Caroline A Baan
1,6
Abstract
Background: Diabetes mellitus brings an increased risk for cardiovascular complications and patients profit from
prevention. This prevention also suits the general population. The question arises what is a better strategy: target
the general population or diabetes patients.
Methods: A mathematical programming model was developed to calculate optimal allocations for the Dutch
population of the follo wing interventions: smoking cessation support, diet and exercise to reduce overweight, statins,
and medication to reduce blood pressure. Outcomes were total lifetime health care costs and QALYs. Budget sizes
were varied and the division of resources between the general population and diabetes patients was assessed.
Results: Full implementation of all interventions resulted in a gain of 560,000 QALY at a cost of €640 per capita,
about € 12,900 per QALY on average. The large majority of these QALY gains could be obtained at incremental
costs below €20,000 per QALY. Low or high budgets (below €9 or above €100 per capita) were predominantly
spent in the general population. Moderate budgets were mostly spent in diabetes patients.
Conclusions: Major health gains can be realized efficiently by offering prevention to both the general and the
diabetic population. However, a priori setting a specific distribution of resources is suboptimal. Resource allocation
models allow accounting for capacity constraints and program size in addition to efficiency.
Background
ifestyle risk factors, especiallyahighbodyweight,play
an important role in the development of diabetes [1,2].
Due to ongoing ageing and unfavourable trends in life-
style in the population diabetes prevalence is increasing
rapidly [3,4]. Diabetes patients risk a number of micro
and macro vascular complications, with 40 to 56% of
the patients suffering from one or more of these.
Macrovascular complications are responsible for the
majority of complication related use of health care and
consist of card iovascular disease and stroke [5]. Preven-
tion aiming at the reduction of cardiovascular risks has
therefore the potential to reduce the burden of diabetes
[6,7] and is included in current diabetes guidelines.
However, given the prevalence of cardiovascular disease
in the general population, it seems also worthwhile to
introduce similar prevention measures for a broader
public [8]. The question thus arises what would be the
best strategy: to target cardiovas cular prevention to dia-
betes patients, to invest in prevention strategies intended
for the general population, or doing a mix of both?
Part of the answer to this question depends on the
relative efficiency of prevention in the general popula-
tion versus prevention targeting the high risk group o f
diabetes patients. Numbers needed to treat a re lower in
diabetes patients, but intervention costs and effective-
ness may differ.
Economic evaluations for a range of lifestyle and drug
interventions targeting diabetes patients,[9,10] or the
general population [11-15] have been published in recent
years. Evaluations of drug interventions dominate, but
smoking cessation and overweight reduction have also
* Correspondence:
1
Centre for Prevention and Health Services Research, National Institute for
Public Health and the Environment (RIVM), Bilthoven, the Netherlands
Full list of author information is available at the end of the article
Feenstra et al. Cost Effectiveness and Resource Allocation 2011, 9:14
/>© 2011 Feenstra et al; licensee BioMed Central Ltd. This is an Open Access article distributed under the terms of the Creative
Commons Attribution License (http:/ /creativecommon s.org/licenses/by/2.0), which permi ts unrestricted use, distribution, and
reproduction in any medium, provided the original work is properly cited.
been evaluated frequently. The majority of these evalua-
tions applied some form of modelling to extrapolate from
the short term effects on intermediate outcomes such as
quitting smoking, weight reduction and lowering choles-
terol levels to the outcome of interest: long term health
in terms of mortality and quality of life. Trials with a fol-
low-up long enough to directly measure these outcomes
are rare, with the notable exception of the UKPDS [16].
Modelling has the added advantage that several sources
maybecombinedtoprovideaconsistentpictureofthe
best available evidence [17].
However, comparing the outcomes of single evalua-
tions is difficult, among others since they were performed
in different countries [18,19]. Furthermore, not all eva-
luations included all relevant effe cts of the interventions.
Comparability is importantly increased when all interven-
tions are evaluated with the same model in the same set-
ting. Therefore, in this paper , we translat ed evidence for
all interventions to a s ingle setting (that o f the Dutch
healthcare system) and evaluated them using the same
model. This model was developed to capture all relevant
health effects of the types of prevention that were evalu-
ated, that is, not only effects on cardiovascular diseases,
but also those on other chronic diseases that show
increased risks for the risk factors targeted by the preven-
tive interventions. Furthermore, effects of prevention on
delaying mortality leading to diseases and costs of care in
life years gained were also taken into account [20,21].
This improved the comparability of the outcomes and
allowed to analyze the full trade-off between different tar-
get groups for prevention.
We show that such a comparison, however, cannot be
restricted to cost-effectiveness ratios. While informative,
it is clear that a prevention program for the general
populati on with a potential reach of 300,000 people will
be valued differently from a program fit for a selective
patient group consisting of 30,000 people. In other
words, program sizes matter [22].
Mathematical programming models for resource alloca-
tion combine the results of cost effectiveness analysis with
epidemiological and demographic data, as well as data on
program scale to find the optimal allocat ion of resources
over programs. Compared to a cost-effectiveness analysis,
the strength of a mathematical programming approach is
that program sizes and hence budgetary impact are taken
into account. The resulting choices of interventions are
different from those guided by cost-effectiveness only.
The approach furthermore allows analyzing the effect
of different objectives and constraints, for instance on
indivisible programs or equity [23,24]. Resource alloca-
tion models for diab etes or its prevention have been
undertaken previously [23,25,26]. These studies focused
on either primary prevention in the non diabetes popula-
tion or on prevention of complications for diabetes
patients separately. In contrast, the current study aimed
to compare both, and used resource allocatio n modelling
to address choices between both types of prevention,
considering a range of prevention programs and evaluat-
ing them using a model that accounts for the full effects
on health and costs of care.
The rest of the paper is structured as follows: first our
methods are set out, paying attention to our general
approach, the input data that were needed to populate the
model as well as the resource allocation model. Second,
results are presented i n terms of total c osts and health
benefits that may be obtained from the optimal allocation
of a given budget. Finally we discuss the results and their
policy implications.
Methods
General approach
To analyze the trade-off between four types of interven-
tions for the general population and in diabetes patients,
the following steps were taken. First, effects of the inter-
ventions on intermediate outcomes and intervention costs
were estimated. Second, modelling was a pplied to find
long term health effects and effects on healthcare costs,
using the same model for all interventions. Third, capacity
constraints and demand restrictions that may apply to the
interventions were a ssessed. Fourth, the long term costs
and effects were fed into a mathematical programming
model, combining them with information on constraints
and on population sizes to find optimal allocations for a
range of healthcare budgets.
Input data
Details and results of the first two steps have been pub-
lished for all interventions concerned in separate publica-
tions [27-32]. In short, first interventions were selected
based on the available evidence on effectiveness from sys-
tematic reviews and their relevance for the Dutch setting.
For these interventions effects of the interventions on
intermediate outcomes were estimated based on systematic
reviews, while intervention costs were calculated u sing bot-
tom up estimates of resource use and unit costs (Table 1).
Cost data are expressed in euro at price levels 2007.
The interventions in the general population are in prin-
ciple also available for people with diabetes. However, it
was assumed that the diabetes specific interventions get
priority in case of overlap of target groups. Costs for the
medication interventions specific for diabetes patients may
differ from similar interventions in the general population,
the main reason being different brands of medications
typically used and cost sharing with other diabetes control
consults. Effects and costs of interventions were corrected
for relapse and non-adherence. For smoking, relapse was
extensively modelled [33], while for overweight and activ-
ity, the effect of relapse was included in the final estimate
Feenstra et al. Cost Effectiveness and Resource Allocation 2011, 9:14
/>Page 2 of 11
of effectiveness [29,31]. For cholesterol lowering drugs and
bloo d pres sure control medication, a correction for non-
adherence was done for those that would cease medication
use within two years by excluding health gains and drug
related costs after these two years [30,32].
Simulation model
The RIVM Chronic Disease Model (CDM) and its dia-
betes module were applied to compute the long term
effects of the interventions. The CDM is a Markov-type
simulation model,[20] and comprises epidemiological
data quantifying associations between multiple risk fac-
tors and chronic diseases among which cardiovascular
diseases and can cers. The CDM diabetes module simu-
lates the Dutch diabetes p opulation [31]. The CDM has
been used among others to eval uate long-term outcomes
for diabetes prevention and treatment [29-31].
Current practice in the Netherlands served as a bench-
mark case, so that costs and effects are to be interpreted
as additional values compared to current practice. Net
cumulative gains in (quality adjusted) life expectancy and
net effects on the present value of health care costs were
estimated over a lifetime horizo n. Costs and effects were
tracked until the last person of the cohort had died, for 3
age groups, 20-44 years, 45-64 years and 65 years and
older. Outcomes in future years were discounted at the
rates prescribed by the current Dutch guidelines for
pharmacoeconomic evaluations (4% and 1.5% annually
for health effects and costs respectively.) Total costs per
QALY for all 12 interventions, for three age categories,
for the intervention compared to usual care were esti-
mated (cf Table 1).
Constraints
In a third step, capacity and demand constraints were
added. For each age group and risk factor, the total num-
ber of persons receiving an intervention cannot be more
than the total size of the target pop ulation. For instance,
it is impossible to offer more smoking cessation support
courses for 65 and over than the number of smokers at
that ages. This results in a set o f restrictions that were
added to the basic optimization model. Their values were
specified for the three age categories in T able S1 (Addi-
tional file 1) and were derived from information about
Table 1 Short term costs and effects of interventions (price level 2007)
Intervention Effectiveness* Annual costs per participant
†
General population
Minimal cessation counseling by GP 28 €30
Intensive smoking cessation counseling plus pharmacotherapy 68 €420
Minimal lifestyle intervention, community intervention (Hartslag Limburg
‡
) Activity: 0-1
Overweight: 5-8
€6
Intensive lifestyle intervention for persons with extreme overweight (SLIM
§
) Activity: 1-6
Overweight: 18.
€700
Medication to reduce blood pressure for persons with SBP > 140 390 €1200-€280**
Statins for persons with total cholesterol > 6.5 470 €1500-€3700**
Diabetes patients
Minimal cessation counseling by GP 28 €30
Intensive smoking cessation counseling plus pharmacotherapy 68 €420
Minimal lifestyle intervention (X-PERT
††
) Activity: 50-90
Overweight: 35
€120
Intensive lifestyle intervention (LookAHEAD
‡‡
) Overweight: 140 €500
Medication to reduce blood pressure for persons with SBP > 140
§§
390 €1000-€3300**
Statins for al diabetes patients*** 470 €1100-€3800 **
* Short term effects expressed as the number of additional persons per 1000 participants that quit smoking, loose weight, increase activity, or continue lifelong
medication. Only continuous drug use was assumed to lead to effects on disease risks, the latter were different for the general population and diabetes patients
and for age and baseline risk [30,32]. Long term effec ts were age dependent and computed using the RIVM-Chronic Disease Model.
†
Intervention costs only. Effects on costs of care were age dependent and computed in the RIVM-Chronic Disease Model. Earlier publications provide more
details on the intervention cost estimates [27-32]. All estimates were adjusted to price level 2007 using consumer price indices.
‡
Ronkers et al. [34]
§
Mensink et al. [35]
** Costs of lifetime medication use and consults were age dependent.
††
Deakin et al. [36]
‡‡
Pi-Sunyer et al. [37]
§§
Effects given are the number of persons that continue lifetime medication. Effects of medication on disease risks were based on a meta-analysis [38]. For full
details see the RIVM report by Jacobs-van der Bruggen et al. 2007 (available at http ://www.rivm.nl/bibliotheek/rapporten/260801004.pdf).
*** Effects given are the number of persons that continue lifetime medication. Effects of medication on disease risks were based on a meta-analysis [6]. For full
details see Jacobs-van der Bruggen et al. 2008 [30] and the RIVM report mentioned above.
Feenstra et al. Cost Effectiveness and Resource Allocation 2011, 9:14
/>Page 3 of 11
lifestyle in the Dutch (diabetes) population and availabil-
ity of treatments. Furthermore, for each intervention,
constraints were added to reflect that the total number of
participants over all age groups for each intervention was
limited by professional capacity. These restrictions will
be referred to as capacity constraints (see Additional
file 1, Table S1).
Optimization model
The optimization model used in current application may
now be formally written as follows.
(1)
Max
p
ja
j
a
p
ja
q
ja
subject to
(2)
j
a
p
ja
c
ja
≤ b
and b given.
(3)
a
p
ja
≤ cap
j
, for all j,
(4) 0 ≤ p
ja
≤ dem
ja
, for all j, for all a
With:
j Index for programs, j = 1, 12.
a Index for age, a = 1, 3 age groups distinguished
p
ja
Number of people of age a receiving program j
b Total available budget (Net present value over
entire time horizon)
q
ja
Health effects per participant of program j for
people of age a (Net present value)
c
ja
Costs of program j per participant of age a (Net
present value)
dem
ja
Demand restrictions for program j and age
group a
cap
j
Capacity constraints for program j
The simulation model provided estimates for the
health effects and costs per participant (q
ja
and c
ja
).
These were combi ned with relevant constraints to f orm
the resource allocation model, which was then solved
using the linear programming features of Mathematica.
(routine LinearProgramming)
Constraints for demand were assumed to be age group
specific, while capacity constraints were given for each
program over all age groups together.
Sensitivity analyses
The standard model was analyzed for a range of different
budgets , to find optimal combinations of total health and
total costs. Then, we removed the capacity constraints to
estimate their effect in a second analysis. Finally, sensitiv-
ity analyses investigated the robustness of the r esults for
different discount rates and time horizons.
Results
Cost-effectiveness ratios
Table 2 shows the interventions in the different age
categories ordered at increasing costs per QALY. For
most interventions, long term cost effectiveness was
lowest for the lowest age category, since at t his age the
full effects of prevention could be included, before any
harm has been done. The exceptions were statins for
diabetes patients and blood pressure treatment for the
general population, reflec ting that for this age category
too many unnecessary cases will be treated lifelong.
Based on these cost-effectiv eness ratios only, low bud-
gets would seem to be spent primarily in diabetes patients:
In total 17 interventions had average cost-effectiveness
below €10,000 per QALY, and 11 of these were for dia-
betes patients. The 13 interventions costing between
€10 ,00 0 and €20,000 per QALY consisted of 5 diabetes
interventio ns and 8 interventions for the general popula-
tion. Finally, 6 interventions cost more than €20,000 per
QALY, and 4 of these were for the general population.
That is, interventions in the diabetes population were
mostly more cost-effective than in the general population
reflecting the effect of targeting to a high risk group. How-
ever, low intensity overweight and activity programs were
more cost-effective in the general population. This may be
explained from t he relatively higher effectiveness of the
general population program. It cost much less and had
relatively a better effect. A possible explanation is that dia-
betes patients already experienced serious problems from
being overweight and yet did not succeed in loosing
weight, so they may need more intensive programs to suc-
cessfully loose weight.
Proportion of money spent in the general population
Table 3 shows optimal allocations and incremental cost-
effectivene ss ratios for a range of total budgets. At most
these 1 2 interventions offered the possibility to gain an
additional 560,000 QALY, for about €640 per capita in
additional costs over the entire time horizon. Table 3
also presents the percentages of health gains and money
obtained from prevention in the general population. At
low budgets, all money was optimally allocated towards
this type of interventions, especially smoking cessation
and overweight reduction. Moderately high budgets
however (that is, more than €9 per capita, or below
€100 per capita), were spen t mostly on prevention in
diabetes. The optimal set now additionally included
increased use of s tatins and medication for blood pres-
sure in diabetes patients as well as intensive overweight
reduction. Finally, for ver y high budgets, above €100 per
capital, additional medication for the general population
was added. The majority of budgets were again allocated
to prevention in the general population. Hence, the opti-
mal distribut ion of money between interventio ns in dia-
betes patients or the general population depended on
available budgets.
From Table 2 ranking on cost-effectiveness ratios
only seemed to indicate that targeted prevention
was more efficient in general. However, the optimal
Feenstra et al. Cost Effectiveness and Resource Allocation 2011, 9:14
/>Page 4 of 11
allocations (Table 3) showed that due to varying sizes
of target populations and capacity constraints no gen-
eral a priori priority for either type of prevention
existed and it depended on the size of the budget, as
well as available interventions, whether most resources
were spent i n universal prevention or in targeted pre-
vention or both.
Effects of supply limits
Running the optimization model without the capacity
constraints on the maximal supply of each intervention
resulted in almost a doubling of maximal potential
health gains from 0.56 million QALY to 0.96 million
QALY. Table 4 below gives the outcomes of a model
without capacity limits, for the same range of budgets as
Table 2 Costs per QALY compared to care as usual
Average costs per QALY (euro) Age category Target population Intervention
(Short name)
1400 20-44 General population Minimal cessation counseling by GP (S1)
1500 20-44 Diabetes patients Minimal cessation counseling by GP (Sd1)
2700 45-64 Diabetes patients Minimal cessation counseling by GP (Sd2)
2900 45-64 General population Minimal cessation counseling by GP (S2)
3000 20-44 General population Hartslag Limburg (HL1)
5400 45-64 General population Hartslag Limburg (HL2)
5800 20-44 Diabetes patients LookAHEAD (LA1)
5900 20-44 Diabetes patients X-PERT (XP1)
6400 20-44 Diabetes patients Intensive smoking cessation counseling plus pharmacotherapy((ISd1)
6700 20-44 General population Intensive smoking cessation counseling plus pharmacotherapy (IS1)
6800 20-44 Diabetes patients Medication to reduce blood pressure for persons with
SBP > 140 (BPd1)
7400 45-64 Diabetes patients X-PERT (XP2)
7800 45-64 Diabetes patients Medication to reduce blood pressure for persons with
SBP > 140 (BPd2)
8000 65+ Diabetes patients Minimal cessation counseling by GP (Sd3)
8600 45-64 General population Intensive smoking cessation counseling plus pharmacotherapy (IS2)
9200 45-64 Diabetes patients Intensive smoking cessation counseling plus pharmacotherapy (ISd2)
9800 45-64 Diabetes patients Statins for all diabetes patients (Std2)
10100 45-64 Diabetes patients LookAHEAD (LA2)
10500 65+ General population Minimal cessation counseling by GP (S3)
10900 45-64 General population Medication to reduce blood pressure for persons with SBP > 140 (BP2)
11000 20-44 Diabetes patients Statins for all diabetes patients (Std1)
11200 20-44 General population Medication to reduce blood pressure for persons with SBP > 140 (BP1)
12900 65+ Diabetes patients Medication to reduce blood pressure for persons with SBP > 140 (BPd3)
16100 65+ General population Hartslag Limburg (HL3)
16600 65+ General population Medication to reduce blood pressure for persons with SBP > 140 (BP3)
16600 65+ Diabetes patients Statins for all diabetes patients (Std3)
18100 20-44 General population Statins for persons with total cholesterol > 6.5 (St1)
18500 45-64 General population Statins for persons with total cholesterol > 6.5 (St2)
19700 65+ Diabetes patients X-PERT (XP3)
19900 20-44 General population SLIM (SL1)
27300 45-64 General population SLIM (SL2)
28100 65+ General population Statins for persons with total cholesterol > 6.5 (St3)
32300 65+ Diabetes patients Intensive smoking cessation counseling plus pharmacotherapy (ISd3)
33200 65+ Diabetes patients LookAHEAD (LA3)
35500 65+ General population Intensive counseling plus pharmacotherapy (IS3)
59600 65+ General population SLIM (SL3)
For the interventions in each age category ordered at worsening cost-effectiveness. (Net present values over a lifetime horizon. Discount rates 4% for costs and
1.5% for QALYs, price level 2007.).
Feenstra et al. Cost Effectiveness and Resource Allocation 2011, 9:14
/>Page 5 of 11
Table 3 Optimization results for different budgets
Budget
(€ *10^6)
Spent in general population (%) Total health gains (QALY*1000) Gained in general population (%) Incremental costs per QALY Changes in interventions chosen
i
1 100 700 100 €1,400 + S1
10 100 6,950 100 €1,400 NA
ii
100 89 29,400 90 €6,700 + IS1, Sd1, Sd2, HL1,
HL2, XP1
250 65 50,400 74 €7,400 + XP2, BPd1, BPd2
500 32 78,100 47 €9,800 + Sd3, Std2
750 24 103,000 37 €10,900 + ISd1, LA2, BP2
- Sd1
1,000 43 126,000 49 €10,900 NA
2500 77 264,000 76 €10,900 NA
5,000 83 440,000 81 €18,100 + ISd2, BP1, BPd3, St1
- Sd2
7,253 88 561,000 84 €49,300 + ISd3, SL1, LA3, St2, Std1
- Sd3
Maximal health gains and incremental costs per QALY for a range of different budgets. Net present values over a lifetime horizon. Discount rates 4% for costs and 1.5% for QALYs, price level 2007. Interventions
added as compared to the set chosen for the budget in the previous row are indicated by +, interventions removed are indicated by
i
A list of the interventions and their abbreviations is given in Table 2.
ii
That is, more money was spent on the same set of interventions as in the previous row
Feenstra et al. Cost Effectiveness and Resource Allocation 2011, 9:14
/>Page 6 of 11
Table 4 Optimization results in model without capacity constraints
Budget (€ *10^6) Spent in general population (%) Total health gains (QALY *1000) Gained in general population (%) Incremental costs per QALY
1 100 700 100 €1,460
10 100 6,950 100 €1,460
100 96 49,600 96 €3,040
250 96 78,000 96 €7,230
500 74 113,000 84 €8,510
750 73 142,000 81 €10,900
1000 55 168,000 68 €10,900
2500 70 309,000 73 €13,700
5000 77 516,000 78 €20,000
7250 78 651,000 78 €20,800
10,000 84 801,000 82 €21,700
Maximal budget: 13,587 87 958,000 84 €426,000
Maximal health gains and incremental costs per QALY for a range of different budgets. Model without capacity constraints. (Net present values over a lifetime horizon. Discounted rates 4% for costs and 1.5% for
QALYs, price level 2007.)
Feenstra et al. Cost Effectiveness and Resource Allocation 2011, 9:14
/>Page 7 of 11
in Table 3. The maximal total budget to be spent on the
12 interventions was of course higher and amounted to
circa €1200 per capita.
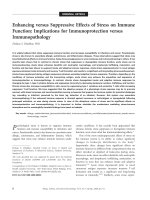
Figure 1 shows o ptimal combinations of budgets and
total health effects, that is, the choices that obtain most
health for a given budget. The steepness of the different
line segments represents the incremental cost-effect ive-
ness ratios. In other words, they reflect the additional
costs that mus t be paid for one additional QALY, if the
extra money is spent in the most efficient way. At corner
points, one or more constraints force a chang e in the set
of programs chosen. The two lines represent the model
with and without capacity constraints and illustrate the
effects of these constraints. For any given budget, less
health can be obtained, while the upper limit to health
benefits is substantially reduced in case of capacity
constraints.
Comparison of Tables 3 and 4 shows that the capacity
constraints reduced the percentage of the budget spent
in the general population. This indicates that capacity
constraints were more limiting for interventions in the
general population than for interventions targeted at
diabetes patients.
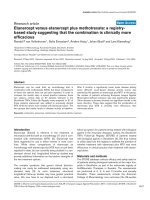
Sensitivity analyses
Sensitivity analyses showed that the time horizon mat-
tered, because at shorter time horizons, neither the full
costs in life years gained, nor the full health effects could
be realized. Thus, maximal total costs and maximal tot al
health effects were smaller. Figure 2 shows the efficiency
fronti ers for time horizons of 25, and 50 years, compared
to the lifetime horizon chosen in the main analysis. Too
short time horizons caused relevant effects to be left out
of the analysis.
Furthermore, the outcomes were sensitive to the rate of
discount, as is usually the case in economic evaluations of
prevention, with health outcomes occurring far in the
future and intervention costs having to be paid immedi-
ately. The base case discounted health effects at 1.5% and
costs at 4%, which is the current Dutch standard (cf
). For discount rates at 4% for both
health and costs, the ef ficiency frontier moved inward,
since the net present value of health effects decreased.
For discount rates of 0% on both health and costs, it
moved outward. Increasing the difference in discounting
between costs and health effects, with health effects dis-
counted at 0%, rather than 1.5%, moved the efficiency
frontier outward.
Discussion
The current study used a resource allocation model to
analyze prevention of diabetes and its complications in
the Netherlands. Optimal resource allocations were com-
puted over a set of 12 intervent ions aiming to reduce the
riskfordiabetesand/orcardiovasculardisease,eitherin
the general population or in diabetes patients. While for
small and high budgets the majority of money w ould go
to interventions in t he general population, moderately
high budgets were mostly spent in diabetes patients.
Strengths of the resource allocation approach were that
it was relatively straightforward to account for con-
straints and analyze their effects. These constraints are
for instance due to limited capacity to provide interven-
tions. Removing constraints on intervention supply
increased maximal additional expenditure from €640 to
€1200 per capita and almost doubled maximal potential
health gains. The constraints were more limiting for pre-
vention in the general population than for interventions
in diabetes patients. This makes sense, since the group of
diabetes patients is much smaller.
The model used to evaluate long term health effects
took into account limited effectiveness and adherence,
competing risks, and relapse. Hence, the estimates took
care not to overestimate health effects. Our special atten-
tion went to the health care costs to be included in the
budget allocation model. In this study, costs consisted of
intervention costs plus the full long term effects of preven-
tion on health care costs . Alternatively only intervention
Figure 1 Cost eff ectiveness efficiency frontiers.modelwith
capacity constraints (dark, solid line). model without capacity
constraints (light, dashed line).
Figure 2 Effect of different time horizons, model with capacity
constraints. 25 years (light dotted line). 50 years (grey dashed line).
lifetime horizon (black solid line, reference case).
Feenstra et al. Cost Effectiveness and Resource Allocation 2011, 9:14
/>Page 8 of 11
costs could be incl uded in the budgets. While the latter
may result in numbers that are closer to common sense
ideas about the sizes of the budgets at stake, it is inconsis-
tent from a long term perspective [21]. Changing to short
term budgets increased the variability of choices between
prevention in the general population and targeted preven-
tion (results not shown).
Another distinctive feature of our modeling exercise is
that we accounted for quality of life decreases with
advancing age. This is important, since obviously most
of the life years gained occur at advanced ages.
While the current results were specific for the Nether-
lands, the g eneral approach couldbeappliedtoanyset-
ting. This woul d require either an existing disease model
comparable to the RIVM chronic disease model, or a
transfer of this model to the appropriate setting, replacing
prevalence, incidence and mortality parameters by setting
speci fic estimates. Furtherm ore, the cost estimates of the
interventions, as well as the estimates of capacities and
further constraints should be adjusted if they were
expected to differ from the Dutch estimates.
Similar recent applications of resource allocation in dia-
betes and in obesity prevention have appeared in the UK
and in Australia [23,26]. The study by Segal focused on
prevent ion in the general population, especially different
types of overweight control. Indirect medical costs were
not included and costs were computed per life year gained,
ignoring effects on quality of life. The study by Earnsh aw
only considered prevention in the diabetes population. In
contrast, the current study also included interventions in
the general population and therefore allowed to explore
the trade off between both types of prevention. Further-
more, Earnshaw used a full experimental design to directly
compute results for any combination of prevention inter-
ventions. In the current paper, a simpler approach was
applied with only single intervention policies modeled,
assuming additive health effects. Third, Earnshaw focused
on intervention costs only, which implies the implicit
assumption that health care cost effects would be the
same for all interventions. That is clearly not the case for
interventions on overweight versus smoking cessation or
statin treatment. Finally, they did not incorporate age
effects on quality of lif e, which is important if trade-offs
are ma de between age groups.
Whileanumberofdiabetesmodelshavebeenpub-
lished in recent years, [39] for the current application we
preferred to u se the RIVM Chronic Disease Model
(CDM). While this model maybe less well known, all
parameters estimates are accessible and the general
structure of the CDM as well as relevant applications
have been published in peer reviewed journals [20,27-33].
The most important advantage of this model for our cur-
rent purpose was that it allows evaluating interventions
in the general population and in diabetes patients using
the same model.
Some assumptions in our current study require further
discussion. First of all, combinations of interventions
were assumed to have no specific interaction effects, that
is, the health gains in terms of life years and QALYs
gained were assumed additive. This same assumption
was made for instance in the global burden of disease
study [40]. It probably implies an overestimation of total
health effects if persons receive more than one inte rven-
tion. This assumption is a bit more problematic in the
diabetes population than in the general population. Thus
the effects of the diabetes interventions may have been
overestimated as compared to interventions in the gen-
eral population, implying that the opt imal shares of
money spent in the general population might be higher
than our results indicated. Second, another assumption
applied in the current paper was the possibility to offer
interventions to a population of variable size, by varying
the budget spent on each intervention. Some resource
allocation models pay specific attention to the conse-
quences of having indivisible interventions of fixed sizes
[41]. The optimization problem then changes into a so
called integer programming problem. The question
whether program size is variable or not depends on the
interventions at stake. For the current interventions, it
was rather easy to vary sizes by having more or less
money available for them, because most of them were
supply driven and addressed people that are not yet
acutely ill. For curative interventions, varying program
size may be more problematic, since it would imply that
some actual patients would receive improper treatment.
While we did provide sensitivity analyses for the
effects of discount rates, time horizon and budgetary
const raints, a more extensive uncertainty analysis would
improve insight into the robustness o f our outcomes.
This requires the use of stochastic programming techni-
ques and we would like to address this issue in future
research.
A further advantage of the resource allocation
approach is that once the model has been formulated, it
is easy to vary constraints and o bjectives, for instance on
indivisible programs or equity [23,24]. T he current
results on capacity constraints might help to focus efforts
to extend prevention capacity to those areas where it
wouldbemostworthwhile,using the shadow prices of
the constraints.
A drawback of resource alloc ation models may be seen
in their data greediness. However, most of these data
woul d be needed for careful priority set ting anyway. The
only additional requirement for a budget allocation model
is that all data used are consistent and can be sensibly
combined in the same model. Therefore, using a resource
Feenstra et al. Cost Effectiveness and Resource Allocation 2011, 9:14
/>Page 9 of 11
all ocation mod el forces to seek for consistent, well com-
parable data, and that maybe considered an advantage
rather than a drawback [17].
Conclusions
Resource allocation models may help health care decision
makers to integrate information about the costs, sizes,
and health effects of sets of programs. Our diabetes appli-
cation had U-shaped results:preventioninthegeneral
population was the best way t o retain health benefits for
low and high budgets, while moderate budgets would
mostlybespentonpreventionindiabetespatients.
Targeted prevention in diagnosed patients was therefore
not a priori more or less efficient than prevention in the
general population. The application also showed that an
additional 560 tho usand QALYs may be gained by cur-
rently available interventions even when accounting for
existing capacity and demand limits.
Additional material
Additional file 1: Table S1. Table with information about constraints on
the demand and capacity of interventions.
Acknowledgements
We thank Maiwenn Al, David Epstein, as well as the audience of the NDESG
and our anonymous reviewers for critical reading and useful comments,
with the disclaimer that of course any remaining errors remain our
responsibility. This study was supported by a grant from the Dutch Ministry
of Health, with full freedom of research and publication.
Author details
1
Centre for Prevention and Health Services Research, National Institute for
Public Health and the Environment (RIVM), Bilthoven, the Netherlands.
2
Department of Epidemiology, University Medical Centre Groningen,
Groningen, the Netherlands.
3
Institute for Medical Technology Assessment,
Erasmus University Rotterdam, Rotterdam, the Netherlands.
4
Expertise Centre
for Methodology and Information Services, RIVM, Bilthoven, The Netherlands.
5
Centre for Public Health Forecasting, RIVM, Bilthoven, the Netherlands.
6
EMGO Institute for Health and Care Research, VU University Amsterdam,
Amsterdam, the Netherlands.
Authors’ contributions
TF and CB initiated the research/got funding. TF and PvB developed the BA
model. GJK, PvB and TF wrote code and did analyses. TF, MJ and PvB
gathered the input data and evaluated interventions with the RIVM CZM. RH
developed the RIVM CZM, PvB and RH developed the RIVM CZM+diabetes
module as applied in this study. TF and PvB wrote the first draft article. All
authors contributed to important revisions and read and approved the final
manuscript. CB acts as a guarantor for the project .
Competing interests
The authors declare that they have no competing interests.
Received: 18 November 2010 Accepted: 6 October 2011
Published: 6 October 2011
References
1. Hamman RF, Wing RR, Edelstein SL, Lachin JM, Bray GA, Delahanty L,
Hoskin M, Kriska AM, Mayer-Davis EJ, Pi-Sunyer X, Regensteiner J, Venditti B,
Wylie-Rosett J: Effect of weight loss with lifestyle intervention on risk of
diabetes. Diabetes Care 2006, 29(9) :2102-2107.
2. Hartemink N, Boshuizen HC, Nagelkerke NJ, Jacobs MA, van
Houwelingen HC: Combining risk estimates from observational studies
with different exposure cutpoints: a meta-analysis on body mass index
and diabetes type 2. Am J Epidemiol 2006, 163(11):1042-1052.
3. Chaturvedi N: The burden of diabetes and its complications: trends and
implications for intervention. Diabetes Res Clin Pract 2007, 76(Suppl 1):S3-12.
4. Mainous AG, Baker R, Koopman RJ, Saxena S, Diaz VA, Everett CJ, Majeed A:
Impact of the population at risk of diabetes on projections of diabetes
burden in the United States: an epidemic on the way. Diabetologia 2007,
50(5):934-940.
5. Redekop WK, Koopmanschap MA, Rutten GE, Wolffenbuttel BH, Stolk RP,
Niessen LW: Resource consumption and costs in Dutch patients with
type 2 diabetes mellitus. Results from 29 general practices. Diabet Med
2002, 19(3):246-253.
6. Baigent C, Keech A, Kearney PM, Blackwell L, Buck G, Pollicino C, Kirby A,
Sourjina T, Peto R, Collins R, Simes R: Efficacy and safety of cholesterol-
lowering treatment: prospective meta-analysis of data from 90,056
participants in 14 randomised trials of statins. Lancet 2005,
366(9493):1267-1278.
7. Gaede P, Vedel P, Larsen N, Jensen GV, Parving HH, Pedersen O:
Multifactorial intervention and cardiovascular disease in patients with
type 2 diabetes. N Engl J Med 2003, 348(5):383-393.
8. Marshall T, Rouse A: Resource implications and health benefits of primary
prevention strategies for cardiovascular disease in people aged 30 to
74: mathematical modelling study. BMJ 2002, 325(7357):197.
9. Bottomley JM, Raymond FD: Pharmaco-economic issues for diabetes
therapy. Best Pract Res Clin Endocrinol Metab 2007, 21(4):657-685.
10. Vijgen SMC, Hoogendoorn M, Baan CA, de Wit GA, Limburg W, Feenstra TL:
Cost effectiveness of preventive interventions in type 2 diabetes
mellitus: a systematic literature review. Pharmacoeconomics 2006,
24(5):425-441.
11. Avenell A, Broom J, Brown TJ, Poobalan A, Aucott L, Stearns SC, Smith WC,
Jung RT, Campbell MK, Grant AM: Systematic review of the long-term
effects and economic consequences of treatments for obesity and
implications for health improvement. Health Technol Assess 2004,
8(21):182.
12. Franco OH, Peeters A, Looman CW, Bonneux L: Cost effectiveness of
statins in coronary heart disease. J Epidemiol Community Health 2005,
59(11):927-933.
13. Gordon L, Graves N, Hawkes A, Eakin E: A review of the cost-effectiveness
of face-to-face behavioural interventions for smoking, physical activity,
diet and alcohol. Chronic Illn 2007, 3(2):101-129.
14. Shearer J, Shanahan M: Cost effectiveness analysis of smoking cessation
interventions. Aust N Z J Public Health
2006, 30(5):428-434.
15.
Ward
S, Lloyd Jones M, Pandor A, Holmes M, Ara R, Ryan A, Yeo W,
Payne N: A systematic review and economic evaluation of statins for the
prevention of coronary events. Health Technol Assess 2007, 11(14):1-iv.
16. Gray AM, Clarke P: The economic analyses of the UK prospective
diabetes study. Diabet Med 2008, 25(Suppl 2):47-51.
17. Philips Z, Bojke L, Sculpher M, Claxton K, Golder S: Good practice
guidelines for decision-analytic modelling in health technology
assessment: a review and consolidation of quality assessment.
Pharmacoeconomics 2006, 24(4):355-371.
18. Pang F: Design, analysis and presentation of multinational economic
studies: the need for guidance. Pharmacoeconomics 2002, 20(2):75-90.
19. Welte R, Feenstra T, Jager H, Leidl R: A decision chart for assessing and
improving the transferability of economic evaluation results between
countries. Pharmacoeconomics 2004, 22(13):857-876.
20. Hoogenveen RT, van Baal PH, Boshuizen HC: Chronic disease projections
in heterogeneous ageing populations: approximating multi-state models
of joint distributions by modelling marginal distributions. Math Med Biol
2010, 27(1):1-19.
21. Van Baal PHM, Feenstra TL, Hoogenveen RT, De Wit GA, Brouwer WBF:
Unrelated medical care in life years gained and the cost utility of
primary prevention: in search of a ‘perfect’ cost-utility ratio. Health Econ
2007, 16(4):421-433.
22. Gafni A, Birch S: Incremental cost-effectiveness ratios (ICERs): the silence
of the lambda. Soc Sci Med 2006, 62(9):2091-2100.
Feenstra et al. Cost Effectiveness and Resource Allocation 2011, 9:14
/>Page 10 of 11
23. Earnshaw SR, Richter A, Sorensen SW, Hoerger TJ, Hicks KA, Engelgau M,
Thompson T, Narayan KM, Williamson DF, Gregg E, Zhang P: Optimal
allocation of resources across four interventions for type 2 diabetes. Med
Decis Making 2002, 22(5, Suppl):S80-S91.
24. Epstein DM, Chalabi Z, Claxton K, Sculpher M: Efficiency, equity, and
budgetary policies: informing decisions using mathematical
programming. Med Decis Making 2007, 27(2):128-137.
25. Niessen LW, Dijkstra R, Hutubessy R, Rutten GE, Casparie AF: Lifetime
health effects and costs of diabetes treatment. Neth J Med 2003,
61(11):355-364.
26. Segal L, Dalton AC, Richardson J: Cost-effectiveness of the primary
prevention of non-insulin dependent diabetes mellitus. Health Promotion
International 1998, 13(3):197-209.
27. Bemelmans W, van BP, Wendel-Vos W, Schuit J, Feskens E, Ament A,
Hoogenveen R: The costs, effects and cost-effectiveness of counteracting
overweight on a population level. A scientific base for policy targets for
the Dutch national plan for action. Prev Med 2008, 46(2):127-132.
28. Feenstra TL, Hamberg-van Reenen HH, Hoogenveen RT, Rutten-van
Molken MPMH: Cost-effectiveness of face-to-face smoking cessation
interventions: a dynamic modeling study. Value Health 2005, 8(3):178-190.
29. Jacobs-van der, Bos G, Bemelmans WJ, Hoogenveen RT, Vijgen SM,
Baan CA: Lifestyle interventions are cost-effective in people with
different levels of diabetes risk: results from a modeling study. Diabetes
Care 2007, 30(1):128-134.
30. Jacobs-van der, Engelfriet PM, Hoogenveen RT, van Baal PH, Struijs JN,
Verschuren WM, Smit HA, Baan CA: Lipid-lowering treatment for all could
substantially reduce the burden of macrovascular complications of
diabetes patients in the Netherlands. Eur J Cardiovasc Prev Rehabil 2008,
15(5):521-525.
31. Jacobs-van der Bruggen MAM, van Baal PH, Hoogenveen RT, Feenstra TL,
Briggs AH, Lawson K, Feskens EJM, Baan CA: Cost-effectiveness of lifestyle
modification in diabetes patients. Diabetes Care 2009, 32(8):1453-1458.
32. Kok L, Engelfriet P, Jacobs-van der, Hoogenveen RT, Boshuizen HC,
Verschuren MW: The cost-effectiveness of implementing a new guideline
for cardiovascular risk management in primary care in the Netherlands.
Eur J Cardiovasc Prev Rehabil 2009, 16(3):371-376.
33. Hoogenveen RT, van Baal PH, Boshuizen HC, Feenstra TL: Dynamic effects
of smoking cessation on disease incidence, mortality and quality of life:
the role of time since cessation. Cost Eff Resour Alloc 2008, 6(1).
34. Ronckers ET, Groot W, Steenbakkers M, Ruland E, Ament A: Costs of the
‘Hartslag Limburg’ community heart health intervention. BMC Public
Health 2006, 6:no51.
35. Mensink M, Blaak EE, Corpeleijn E, Saris WH, de Bruin TW, Feskens EJ:
Lifestyle intervention according to general recommendations improves
glucose tolerance. Obes Res 2003, 11(12):1588-96.
36. Deakin TA, Cade JE, Williams R, Greenwood DC: Structured patient
education: the diabetes X-PERT Programme makes a difference. Diabet
Med 2006, 23(9):944-954.
37. Pi-Sunyer X, Blackburn G, Brancati FL, Bray GA, Bright R, Clark JM, Curtis JM,
Espeland MA, Foreyt JP, Graves K, Haffner SM, Harrison B, Hill JO, Horton ES,
Jakicic J, Jeffery RW, Johnson KC, Kahn S, Kelley DE, Kitabchi AE,
Knowler WC, Lewis CE, Maschak-Carey BJ, Montgomery B, Nathan DM,
Patricio J, Peters A, Redmon JB, Reeves RS, Ryan DH, Safford M, et al:
Reduction in weight and cardiovascular disease risk factors in
individuals with type 2 diabetes: one-year results of the look AHEAD
trial. Diabetes Care 2007, 30(6):1374-1383.
38. Turnbull F, Neal B, Algert C, Chalmers J, Chapman N, Cutler J, Woodward M,
MacMahon S: Effects of different blood-pressure lowering regimens on
major cardiovascular events in individuals with and without diabetes
mellitus: results of prospectively designed overviews of randomized
trials. Arch Intern Med 2005, 165:1410-1419.
39. Mount Hood 4 modeling group: Computer modeling of diabetes and its
complications: a report on the Fourth Mount Hood Challenge Meeting.
Diabetes Care 2007, 30(6):1638-1646.
40. Murray CJL, Lopez AD, Jamison DT: The global burden of disease in 1990:
summary results, sensitivity analysis and future directions. Bull World
Health Organ 1994, 72(3):495-509.
41. Sendi P, Al MJ, Gafni A, Birch S: Optimizing a portfolio of health care
programs in the presence of uncertainty and constrained resources. Soc
Sci Med 2003, 57(11):2207-2215.
doi:10.1186/1478-7547-9-14
Cite this article as: Feenstra et al.: Targeted versus universa l prevention.
a resource allocation model to prioritize cardiovascular prevention. Cost
Effectiveness and Resource Allocation 2011 9:14.
Submit your next manuscript to BioMed Central
and take full advantage of:
• Convenient online submission
• Thorough peer review
• No space constraints or color figure charges
• Immediate publication on acceptance
• Inclusion in PubMed, CAS, Scopus and Google Scholar
• Research which is freely available for redistribution
Submit your manuscript at
www.biomedcentral.com/submit
Feenstra et al. Cost Effectiveness and Resource Allocation 2011, 9:14
/>Page 11 of 11