Báo cáo y học: "Partial pressure of end-tidal carbon dioxide successful predicts cardiopulmonary resuscitation in the field: a prospective observational study" potx
Bạn đang xem bản rút gọn của tài liệu. Xem và tải ngay bản đầy đủ của tài liệu tại đây (290.6 KB, 13 trang )
Open Access
Available online />Page 1 of 13
(page number not for citation purposes)
Vol 12 No 5
Research
Partial pressure of end-tidal carbon dioxide successful predicts
cardiopulmonary resuscitation in the field: a prospective
observational study
Miran Kolar
1
, Miljenko Križmarić
2
, Petra Klemen
2,3,4
and Štefek Grmec
1,2,3,4
1
Medikmiko-General Practice, Gregorčičeva, 3000 Celje, Slovenia
2
Faculty of Health Sciences, University of Maribor, Žitna ulica, 2000 Maribor, Slovenia
3
Centre for Emergency Medicine Maribor, Ulica talcev, 2000 Maribor, Slovenia
4
University of Maribor, Medical Faculty, Slomškov trg, 2000 Maribor, Slovenia
Corresponding author: Štefek Grmec,
Received: 20 Jun 2008 Revisions requested: 29 Jul 2008 Revisions received: 29 Aug 2008 Accepted: 11 Sep 2008 Published: 11 Sep 2008
Critical Care 2008, 12:R115 (doi:10.1186/cc7009)
This article is online at: />© 2008 Kolar et al.; licensee BioMed Central Ltd.
This is an open access article distributed under the terms of the Creative Commons Attribution License ( />), which permits unrestricted use, distribution, and reproduction in any medium, provided the original work is properly cited.
Abstract
Introduction Prognosis in patients suffering out-of-hospital
cardiac arrest is poor. Higher survival rates have been observed
only in patients with ventricular fibrillation who were fortunate
enough to have basic and advanced life support initiated soon
after cardiac arrest. An ability to predict cardiac arrest outcomes
would be useful for resuscitation. Changes in expired end-tidal
carbon dioxide levels during cardiopulmonary resuscitation
(CPR) may be a useful, noninvasive predictor of successful
resuscitation and survival from cardiac arrest, and could help in
determining when to cease CPR efforts.
Methods This is a prospective, observational study of 737
cases of out-of-hospital cardiac arrest. The patients were
intubated and measurements of end-tidal carbon dioxide taken.
Data according to the Utstein criteria, demographic information,
medical data, and partial pressure of end-tidal carbon dioxide
(Pet
CO
2
) values were collected for each patient in cardiac arrest
by the emergency physician. We hypothesized that an end-tidal
carbon dioxide level of 1.9 kPa (14.3 mmHg) or more after 20
minutes of standard advanced cardiac life support would predict
restoration of spontaneous circulation (ROSC).
Results Pet
CO
2
after 20 minutes of advanced life support
averaged 0.92 ± 0.29 kPa (6.9 ± 2.2 mmHg) in patients who did
not have ROSC and 4.36 ± 1.11 kPa (32.8 ± 9.1 mmHg) in
those who did (P < 0.001). End-tidal carbon dioxide values of
1.9 kPa (14.3 mmHg) or less discriminated between the 402
patients with ROSC and 335 patients without. When a 20-
minute end-tidal carbon dioxide value of 1.9 kPa (14.3 mmHg)
or less was used as a screening test to predict ROSC, the
sensitivity, specificity, positive predictive value, and negative
predictive value were all 100%.
Conclusions End-tidal carbon dioxide levels of more than 1.9
kPa (14.3 mmHg) after 20 minutes may be used to predict
ROSC with accuracy. End-tidal carbon dioxide levels should be
monitored during CPR and considered a useful prognostic value
for determining the outcome of resuscitative efforts and when to
cease CPR in the field.
Introduction
Despite all of the progress that has been made in reanimating
patients in cardiac arrest over the past half century, resuscita-
tion attempts often fail to restore spontaneous circulation.
Consistent and discouraging low survival rates mandate a
reassessment of current resuscitative strategies and tech-
niques [1-5]. Overall survival after out-of-hospital cardiac
arrest is frequently under 3% [6-8], and so the most common
of all decisions after initiation of cardiopulmonary resuscitation
(CPR) remains the decision of when to stop. An library of
research and guidelines for terminating resuscitative efforts
has been developed during the past two decades, and various
clinical indicators have been used to determine when CPR
efforts should be terminated [8-12]. Capnography (capnome-
try) potentially represents a useful clinical indicator of death
that could guide decisions to terminate resuscitative efforts
AUROC: area under the ROC curve; CPC: cerebral performance category; CPR: cardiopulmonary resuscitation; ICU: intensive care unit; NPV: neg-
ative predictive value; PetCO
2
: partial pressure of end-tidal carbon dioxide; PPV: positive predictive value; ROC: receiver operating characteristic;
ROSC: return of spontaneous circulation; TOR: termination of resuscitation.
Critical Care Vol 12 No 5 Kolar et al.
Page 2 of 13
(page number not for citation purposes)
[8,13]. We sought to evaluate the hypothesis that partial pres-
sure of end-tidal carbon dioxide (Pet
CO
2
) can predict nonsur-
vival in an independent cohort of patients suffering out-of-
hospital cardiac arrest.
Materials and methods
A total of 737 patients who suffered a sudden cardiac arrest
in the field and were treated by a mobile emergency team were
included in the present prospective study. The data were
obtained fin the field in Maribor (approximately 200,000 inhab-
itants). The study was approved by the Ethics Board of the
Ministry of Health of the Republic of Slovenia (59/05/00),
which granted a waiver of the need for informed consent.
Whenever possible, patients who regained consciousness or
their relatives were informed of the study after enrollment.
Consistent with the European Union recommendations, we
have a single emergency number: 112. In the Centre for Emer-
gency Medicine Maribor there are two prehospital emergency
teams and two basic life support teams equipped with defibril-
lators. In addition, from April till October during the daytime, in
Maribor there is a motorcycle rescuer with defibrillation capa-
bility; he and the prehospital emergency team are simultane-
ously dispatched and they rendezvous in the field.
The prehospital emergency team is an advanced life support
unit including three members with an adequately equipped
road vehicle. The team includes an emergency physician and
two registered nurses or medical technicians.
The basic life support team includes two medical technicians
or nurses and driver (paramedic). The motorcycle rescuer is a
registered nurse or nurse. The prehospital emergency team is
routinely dispatched to the field in emergency situations (in
case of presumed cardiac arrest, heart attacks, respiratory dis-
tress, cerebrovascular incident, trauma, delivery, poisoning
and so on). Basic life support and advanced life support are
provided using a regional protocol that incorporates European
Resuscitation Council standards and guidelines, and clinical
algorithms for cardiac resuscitation. After resuscitation, the
patient is transferred to the intensive care unit (ICU) of the Uni-
versity Clinical Center, Maribor. Data in accordance with the
Utstein criteria, demographic information, medical data and
Pet
CO
2
values were collected for each patient in cardiac arrest
by the emergency physician. Hospital records were used for
outcome analysis, which also included assessment of cerebral
performance category (CPC) by the intensive care unit spe-
cialist. A CPC score of 1 reflects good cerebral performance,
CPC scores of 2 and 3 indicate moderate and severe cerebral
disability, a CPC score of 4 indicates a comatose, vegetative
stage, and CPC score 5 indicates brain death.
All nontraumatic out-of-hospital cardiac arrests in adults older
than 18 years in the years from January 1998 to December
2006 were included in the study. Exclusion criteria were doc-
umented terminal illness and severe hypothermia (<30°C). We
defined return of spontaneous circulation (ROSC) in accord-
ance with the Utstein style ('any ROSC' – palpabile pulse on
carotid artery, regardless of duration, and ROSC with admis-
sion to hospital). In our analysis and comparison, we consider
only those patients with ROSC on admission to hospital
(defined as having a stable blood pressure when the prehos-
pital resuscitation team was dismissed by the ICU team).
An endotracheal tube was immediately connected to the cap-
nometer. We measured Pet
CO
2
continuously and recorded it
during resuscitation, beginning with intial postintubation
Pet
CO
2
(first PetCO
2
value obtained) and ending with the final
Pet
CO
2
value at admission to the hospital or termination of
resuscitation attempts. Measurements of Pet
CO
2
were taken
using the sidestream method with the infrared capnometer
integrated into the LIFEPACK 12 defibrillator monitor (Physio
Control, Medtronic Inc., Redmond, WA, USA) or with BCI
Capnocheck Model 20600A1 (BCi International, Waukesha,
WI, USA).
Continuous data are expressed as median (range) and other
data are expressed as mean ± standard deviation. Proportions
were reported with 95% confidence interval. Analysis for
caterogical variables were performed using χ
2
test (with Yates
correction, if appropriate) and exact Fisher test. Comparisons
between groups were performed using t-test (normal distribu-
tion) and Mann-Whitney test (normality test failed). Sensitivity,
specificity, and positive predictive value (PPV) and negative
predictive value (NPV) were calaculated using standard formu-
lae. For each value, receiver operating characteristic (ROC)
curves were obtained. The ROC curve depicts the relation
between true positive results (number of predicted deaths
among those who actually died) and false positive results
(number of predicted deaths among those who actually sur-
vived) for each score. The greater the area under the ROC
curve (AUROC), the better the predictive value of Pet
CO
2
.
Analyses of independent predictors for ROSC and survival
from univariate analysis were performed using multivariate
logistic regression.
The null hypothesis was considered to be rejected at P values
less than 0.05 in all tests. For statistical analysis we used
SPSS12.01 software (SPSS Inc., Chicago, IL, USA).
Results
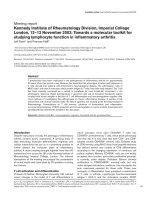
During the period of evaluation, our centre was involved in
1,086 emergency interventions in which there was absence of
signs of circulation at the start of intervention. Ultimately, 737
patients were resuscitated. ROSC was achieved in 438
patients (59.4%), overall survival to hospital admission
occurred in 55% (402 patients) and 170 (23%) patients were
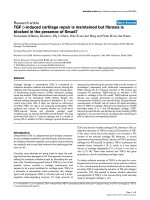
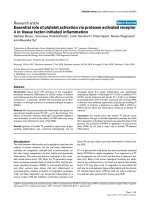
discharged alive (Figure 1).
Available online />Page 3 of 13
(page number not for citation purposes)
The univariate analysis for ROSC on admission (Table 1)
showed that initial Pet
CO
2
, ventricular fibrillation or pulseless
ventricular tachycardia as the initial rhythm, witnessed arrest,
bystander-performed CPR, female sex and response time
were associated with ROSC. Using the same method, we
found that bystander CPR, witnessed arrest, final Pet
CO
2
, ini-
tial Pet
CO
2
and resposne time were associated with survival.
The initial Pet
CO
2
was higher in patients who survived and in
those who achieved ROSC (values expressed as kPa
[mmHg]; surviving patients: 3.17 [23.8] ± 1.42 [10.7] versus
2.34 [17.6] ± 1.95 [14.7]; ROSC patients 3.13 [23.5] ± 1.65
[12.4] versus 2.54 [19.1] ± 2.43 [18.3]; P < 0.001). The final
Pet
CO
2
(kPa [mmHg]; surviving patients: 3.89 [29.3] ± 1.12
[8.4] versus 1.99 [15.0 mmHg] ± 1.33 [10.0]; ROSC
patients: 3.64 [27.4] ± 0.94 [7.1] versus 0.97 [7.3] ± 0.33
[2.5]; P < 0.001) was also considerably higher in the surviving
and ROSC patients (Table 2).
The Pet
CO
2
value after 20 minutes of advanced life support
averaged 0.91 kPa (6.8 mmHg) ± 0.29 kPa (2.2 mmHg) in
patients without ROSC and 4.36 kPa (32.8 mmHg) ± 1.11
kPa (8.4 mmHg) in those who achieved ROSC (P < 0.001).
An end-tidal carbon dioxide value above 1.9 kPa (14.3 mmHg)
discriminated between the 402 patients with ROSC and 335
patients without ROSC. When an end-tidal carbon dioxide
value of 1.9 kPa (14.3 mmHg) or less was used to predict
death, the sensitivity, specificity, PPV and NPV were all 100%
(Table 3).
A 15-minute Pet
CO
2
value of 1.8 kPa (13.5 mmHg) had a sen-
sitivity and NPV of 100%, with high specificity and positive
predictive value (98%).
In the patients with nonshockable initial rhythm (pulseless
electrical activity), we observed significantly higher initial
Pet
CO
2
values in comparison with the patients with shockable
Figure 1
Utstein reporting template for out-of-hospital cardiac arrest obtained over an 8-year periodUtstein reporting template for out-of-hospital cardiac arrest obtained over an 8-year period. CPC, cerebral performance category; CPR indicates car-
diopulmonary resuscitation; EMS, emergency medicine services; PEA, pulseless electrical activity; ROSC, restoration of spontaneous circulation;
VF, ventricular fibrillation; VT, ventricular tachycardia.
Critical Care Vol 12 No 5 Kolar et al.
Page 4 of 13
(page number not for citation purposes)
initial rhythm. On the contrary, in the group of patients who
presented with ventricular fibrillation/pulseless tachycardia
arrest, there were significantly higher values of Pet
CO
2
from
the first minute of CPR to the final value (admission to hospital
or termination of CPR; Table 4).
The values of Pet
CO
2
in both groups (the group of shockable
and the group of nonshockable initial rhythm) were signifi-
cantly higher in patients with ROSC than in the patients with-
out ROSC (except the Pet
CO
2
after 1 minute of CPR in
patients with asystole or pulseless electrical activity as initial
rhythm). No patients with an initial, average, final, or maximum
Pet
CO
2
value of less than 1.33 kPa (10 mmHg) was resusci-
tated (Tables 5 and 6).
After 20 minutes of CPR, Pet
CO
2
(regardless of initial rhythm)
clearly discriminated between survivors and nonsurvivors in
the field (admission to hospital; Tables 7 and 8). In the shock-
able group Pet
CO
2
values above 1.5 kPa (11.3 mmHg; for a
positive outcome), and in the nonshockable group values
above 1.90 kPa (14.3 mmHg) had a sensitivity, specificity,
PPV and NPV values of 100%, and the AUROC was 1.
After 15 minutes of CPR, Pet
CO
2
values above 1.8 kPa (13.5
mmHg), in both shockable and nonshockable groups, had
sensitivity and NPV of 100%, with acceptable specificity and
PPV, and an AUROC of 1 (Tables 7 and 8).
At 20 minutes of CPR, a cut-off point for Pet
CO
2
values of 1.5
kPa (13.5 mmHg) yielded sensitivity and NPV of 100% in
terms of predicting discharge from hospital in patients with
shockable intial rhythm. With a 20-minute Pet
CO
2
cut-off of 2.1
kPa (15.8 mmHg), the sensitivity and NPV were 100% in
terms of predicting discharge from hospital in patients with
nonshockable initial rhythm (Table 9, Table 10).
In multivariate analysis (Table 11), initial, average, 10-minute,
15-minute, 20-minute, maximum and final values of Pet
CO
2
,
Table 1
Clinical and demographic characteristics for 737 of cardiac arrest patients, according to immediate outcome (ROSC with hospital
admission)
Death in the field (n = 335) ROSC with hospitalization (n = 402) P value
Male sex (n [%])
a
242 (72.2%) 253 (62.9%) 0.007
Age (years; mean ± SD)
b
62.7 ± 15.8 58.8 ± 12.8 0.049
Initial shockable (VF/VT) rhythm (n [%])
a
92 (27.5%) 212(52.7%) <0.001
Witnessed arrests (n [%])
a
176 (52.5%) 294 (73.1%) 0.001
Bystander CPR (n [%])
a
41 (12.2%) 132 (32.8%) <0.001
Initial Pet
CO
2
(kPa [mmHg]; mean ± SD)
b
2.6 ± 2.4 (19.6 ± 18.1) 3.1 ± 1.6 (23.5 ± 12.4) <0.001
Final Pet
CO
2
(kPa [mmHg]; mean ± SD)
b
0.9 ± 0.3 (7.3 ± 2.5) 3.5 ± 0.9 (27.4 ± 7.1) <0.001
Response time (minutes; mean ± SD)
b
11.2 ± 4.3 7.8 ± 3.9 <0.001
a
Fisher test.
b
Wilcoxon rank sum test. CPR, cardiopulmonary resuscitation; PetCO
2
, partial end-tidal pressure of carbon dioxide; SD, standard
deviation; VF, ventricular fibrillation; VT, ventricular tachycardia.
Table 2
Clinical and demographic characteristics for the 737 cardiac arrest patients, according to survival (discharge from hospital)
Death (in the field and in hospital; n = 567) Survivors (discharge from hospital; n = 170) P value
Male sex (n [%])
a
384 (67.7%) 111 (65.3%) 0.224
Age (years; mean ± SD)
b
61.2 ± 14.7 60.2 ± 13.3 0.861
Initial shockable (VF/VT) rhythm (n [%])
a
209 (36.9%) 95(55.8%) 0.206
Witnessed arrests (n [%])
a
314 (55.4%) 160 (94.1%) <0.001
Bystander CPR (n [%])
a
86 (15.2%) 88 (51.8%) <0.001
Initial Pet
CO
2
(kPa [mmHg]; mean ± SD)
b
2.4 ± 1.9 (17.6.0 ± 14.7) 3.1 ± 1.4 (23.8 ± 10.7) <0.001
Final Pet
CO
2
(kPa [mmHg]; mean ± SD)
b
1.9 ± 1.4 (15.0 ± 10.0) 3.9 ± 1.1 (29.3 ± 8.4) <0.001
Response time (minutes; mean ± SD)
b
12.7 ± 4.4 6.3 ± 3.2 <0.001
a
Fisher test.
b
Wilcoxon rank sum test. CPR, cardiopulmonary resuscitation; PetCO
2
, partial end-tidal pressure of carbin dioxide; SD, standard
deviation; VF, ventricular fibrillation; VT, ventricular tachycardia.
Available online />Page 5 of 13
(page number not for citation purposes)
shockable initial rhythm (ventricular fibrillation or tachycardia),
witnessed arrest, bystander-performed CPR, female sex and
arrival time were associated with improved ROSC. Using the
same method we found that bystander CPR, witnessed arrest,
shockable initial rhythm, initial, average, 10-minute, 15-minute,
20-minute, maximum and final Pet
CO
2
values, and arrival time
were associated with improved survival (Table 12).
Discussion
Presenting the European perspective, Scogvoll and cowork-
ers [14] reported that the annual incidence of attempted CPR
ranged from 33 to 71 per 100,000 inhabitants. Sudden car-
diac death accounts for approximately 1000 lives per day in
the USA [5]. In the majority of cases, CPR and other treatment
efforts are unsuccessful, and the patient was eventually pro-
nounced dead. A number of clinical indicators can be used to
determine when those efforts should be terminated [15-18].
Morrison and colleagues [12] described a clinical decision
rule for termination of resuscitation (TOR), which was
designed to help emergency medical services to determine
whether to terminate resuscitative efforts in the setting of out-
of-hospital cardiac arrest. In that Canadian study, the investi-
gators sought to validate their previously proposed prediction
rule, namely that TOR should be considered if spontaneous
circulation does not return before transport is initiated, if no
automatic external defibrillator (AED) shocks are given before
transport is initiated, and if arrest was not witnessed by emer-
gency personnel. This simple prediction rule has 99.5% PPV
Table 3
Performance of various values of PetCO
2
and duration of CPR for predicting ROSC in all patients with cardiac arrest
Pet
CO
2
Cut-off
(kPa [mmHg])
nMin-max
(kPa [mmHg])
Mean ± SD
(kPa [mmHg])
Sensitivity (%) Specificity
(%)
PPV (%) NPV (%) AUROC
(95% CI)
Initial ≤1.3 (≤10) 168 0.0–1.3
(0.0–10)
0.68 ± 0.34
(5.1 ± 2.5)
100 50 71 100 0.68
(0.63–0.72)
>1.3 (>10) 569 1.4–8.7
(10.1–65.4)
3.52 ± 1.93
(26.3 ± 14.5)
0 to 10
minutes
≤1.6 (≤12.1) 306 0.3–1.6
(2.3–12.1)
0.96 ± 0.34
(7.2 ± 2.6)
100 91 93 100 0.99
(0.99–1.00)
>1.6 (>12.1) 431 1.7–5.6
(12.2–42.1)
2.79 ± 0.82
(20.9 ± 0.8)
10 minutes ≤1.3 (≤9.8) 202 0.3–1.3
(2.3–9.8)
0.85 ± 0.31
(6.4 ± 2.1)
100 60 75 100 0.99
(0.98–0.99)
>1.3 (>9.8) 535 1.4–7.2
(9.9–54.2)
2.89 ± 1.09
(21.7 ± 8.2)
11–15
minutes
≤1.7 (≤12.8) 333 0.4–1.7
(3.1–12.8)
0.99 ± 0.30
(7.6 ± 2.2)
100 99 99 100 1.00
(0.99–1.00)
>1.7 (>12.8) 404 1.8–5.5
(12.8–41.4)
3.19 ± 0.77
(23.9 ± 4.8)
15 minutes ≤1.8 (≤13.6) 328 0.2–1.8
(1.5–13.5)
1.11 ± 0.39
(8.4 ± 2.8)
100 98 98 100 0.99
(0.99–1.00)
>1.8 (>13.6) 409 1.9–7.7
(13.6–57.9)
3.65 ± 0.98
(27.8 ± 7.4)
20 minutes ≤1.9 (≤14.3) 335 0.3–1.9
(2.3–14.3)
0.92 ± 0.29
(6.8 ± 2.1)
100 100 100 100 1.00
(1.00–1.00)
>1.9 (>14.3) 402 2.1–7.8
(14.4–58.7)
4.36 ± 1.11
(33.1 ± 8.4)
Maximal ≤2.3 (≤17.3) 293 0.7–2.3
(5.3–17.3)
1.58 ± 0.34
(12.1 ± 2.6
100 87 91 100 0.99
(0.99–1.00)
>2.3 (>17.3) 444 2.4–10.7
(18.1–80.5)
5.12 ± 1.57
(38.4 ± 11.9)
Final
≤1.7 (≤12.8) 335 0.2–1.7
(1.7–12.8)
0.98 ± 0.33
(7.4 ± 3.2)
100 99 99 100 1.00
(1.00–1.00)
>1.7 (>12.8) 402 1.9–6.6
(14.3–49.7)
0.98 ± 0.33
(27.8 ± 7.2)
AUROC, area under the receiver operating characteristic curve; CI, confidence interval; CPR, cardiopulmonary resuscitation; NPV, negative
predictive value; Pet
CO
2
, partial pressure of end-tidal carbon dioxide; PPV, positive predictive value; ROSC, return of spontaneous circulation; SD,
standard deviation
Critical Care Vol 12 No 5 Kolar et al.
Page 6 of 13
(page number not for citation purposes)
and a specificity of 90.2%, and may be useful for providing
supplementary guidance in the field [17]. However, a rule can-
not determine, for example, how long to continue resuscitation
efforts before declaring 'no ROSC'. Decisions about TOR
continue to cause difficulties for health care professionals.
Current guidelines provide some information on underlying
principles, but they do not include a objective, clear and
numerical decision rule regarding TOR.
Several animal and clinical studies suggest that the Pet
CO
2
can be used to determine when resuscitation should be
ceased. Investigators have suggested that there is a close cor-
relation between Pet
CO
2
and cardiac output, stroke volume,
and coronary and cerebral perfusion pressure during CPR.
Kalenda [19] first reported a decrease in Pet
CO
2
in patients
who could not be resuscitated, and a significant rise in Pet
CO
2
in those patients in whom ROSC could be achieved.
Falk and coworkers [20] found that Pet
CO
2
decreased from
mean of 1.4% before arrest to 0.4% after the onset of cardiac
arrest. It then increased with CPR and ROSC. Sanders and
colleagues [21] found that the end-tidal carbon dioxide level
predicted successful resuscitation after in hospital and out-of-
hospital cardiac arrest. The average, initial, final, maximum and
Table 4
Comparison of characteristics and values of Pet
CO
2
between shockable and nonshockable initial rhythm for patients with cardiac
arrest
Shockable (n = 304) Nonshockable (n = 433) P value
Age (years) 59.5 ± 11.9 60.1 ± 12.9 0.55
Arrival (min [min-max]) 8.6 ± 4.5 (1–22) 9.9 ± 4.3 (2–29) 0.03
Initial Pet
CO
2
(kPa [mmHg]) 2.2 ± 1.3 (16.6 ± 9.8) 3.4 ± 2.4 (25.6 ± 18.1) <0.001
1 minute Pet
CO
2
(kPa [mmHg]) 3.3 ± 1.4 (24.8 ± 10.5) 2.8 ± 1.5 (21.1 ± 11.3) <0.001
Average Pet
CO
2
(0 to 10 minutes; kPa [mmHg]) 2.3 ± 1.1 (17.3 ± 8.3) 1.8 ± 1.2 (13.5 ± 0.9) <0.001
10 minute Pet
CO
2
(kPa [mmHg]) 2.7 ± 1.3 (20.3 ± 10) 2.1 ± 1.3 (15.8 ± 10) <0.001
11–15 minutes Pet
CO
2
(kPa [mmHg]) 2.5 ± 1.2 (18.8 ± 9.1) 1.9 ± 1.2 (14.3 ± 9.7) <0.001
15 minutes Pet
CO
2
(kPa [mmHg]) 2.9 ± 1.5 (21.8 ± 11.3) 2.2 ± 1.4 (16.5 ± 10.5) <0.001
20 minutes Pet
CO
2
(kPa [mmHg]) 3.3 ± 1.8 (24.8 ± 13.5) 2.4 ± 1.9 (18.1 ± 14.3) <0.001
Max Pet
CO
2
(kPa [mmHg]) 4.2 ± 2.1 (31.6 ± 15.8) 3.3 ± 2.1 (24.8 ± 15.8) <0.001
Final Pet
CO
2
(kPa [mmHg]) 2.9 ± 1.5 (21.8 ± 11.3) 2.1 ± 1.5 (15.8 ± 11.3) <0.001
'Shockable' was defined as ventricular fibrillation or tachycardia and 'nonshockable' was defined as asystole or pulseless electrical activity. Unless
otherwise stated, values are expressed as mean ± standard deviation. PetCO
2
, partial pressure of end-tidal carbon dioxide.
Table 5
Comparison of characteristics and values of Pet
CO
2
between patients with ROSC and without ROSC in shockable initial rhythm in
cardiac arrest
ROSC (n = 211) Non-ROSC (n = 93) P value
Age (years) 58.6 ± 10.9 61.8 ± 13.6 0.03
Initial Pet
CO
2
(kPa [mmHg]) 2.7 ± 1.1 (20.3 ± 9.2) 1.8 ± 1.3 (13.5 ± 10) <0.001
1 minute Pet
CO
2
(kPa [mmHg]) 3.6 ± 1.3 (27.1 ± 10) 2.6 ± 1.4 (19.6 ± 11) <0.001
Average Pet
CO
2
(0 to 10 minutes; kPa [mmHg]) 2.9 ± 0.8 (21.8 ± 6.1) 1.1 ± 0.4 (8.3 ± 3.1) <0.001
10 minute Pet
CO
2
(kPa [mmHg]) 3.3 ± 0.9 (24.8 ± 6.8) 1.2 ± 0.5 (9.1 ± 4.2) <0.001
11 to 15 minute Pet
CO
2
(kPa [mmHg]) 3.2 ± 0.7 (24.1 ± 5.1) 0.9 ± 0.3 (6.8 ± 2.7) <0.001
15 minute Pet
CO
2
(kPa [mmHg]) 3.7 ± 0.9 (27.9 ± 6.8) 1.1 ± 0.4 (8.3 ± 3.4) <0.001
20 minute Pet
CO
2
(kPa [mmHg]) 4.3 ± 1.1 (32.3 ± 8.7) 0.9 ± 0.3 (7.1 ± 2.6) <0.001
Max Pet
CO
2
(kPa [mmHg]) 5.3 ± 1.5 (39.9 ± 11.3) 1.7 ± 0.6 (12.8 ± 5.5) <0.001
Final Pet
CO
2
(kPa [mmHg]) 3.7 ± 0.9 (27.8 ± 6.6) 1.0 ± 0.3 (7.5 ± 2.7) <0.001
'Shockable' was defined as ventricular fibrillation or pulseless tachycardia. Values are expressed as mean ± standard deviation. PetCO
2
, partial
pressure of end-tidal carbon dioxide; ROSC, restoration of spontaneous circulation
Available online />Page 7 of 13
(page number not for citation purposes)
minimum values of PetCO
2
were all higher in resuscitated
patients. No patient with an average Pet
CO
2
value of less than
1.33 kPa (10 mmHg) was resuscitated.
Callaham and Barton [22] found that the four patients who had
initial and later Pet
CO
2
values of less than 1.33 kPa (10 mmHg)
were all resuscitated. These data and similar reports of ROSC
after prolonged resuscitative attempts [23] with low Pet
CO
2
values may account for the reluctance of the scientific commu-
nity to incorporate Pet
CO
2
in Utstein-style reports and resusci-
tation algorithms. In a landmark prospective study, Levine and
colleagues [8] observed 150 patients suffering cardiac arrest
and measured Pet
CO
2
using a mainstream capnometer. They
compared 20-minute Pet
CO
2
and initial values and concluded
that initial values are unreliable in predicting mortality. The 20-
minute values of Pet
CO
2
were promising and more reliable in
predicting mortality. Values less then 1.33 kPa (10 mmHg)
after 20 minutes of CPR were incompatible with survival, and
the authors are of the opinion that this could be helpful in
deciding when to stop resuscitation efforts. We established
the relationship between Pet
CO
2
and prognosis in prehospital
CPR in our previous studies [5,24]. In the second study [24],
we confirmed that Pet
CO
2
and mean arterial pressure values
are prognostic for the outcome of out-of-hospital cardiac
arrest. During a cardiac arrest, Pet
CO
2
can be considered an
indirect parameter for the evaluation of cardiac output in the
prehospital setting, together with mean arterial pressure, when
spontaneous circulation is restored.
Our study is the largest prospective study of the predictive
value of Pet
CO
2
measurement for ROSC and survival, and
includes 737 victims of out-of-hospital sudden cardiac arrest.
We confirmed that bystander CPR, witnessed arrest, shocka-
ble initial rhythm, initial, average, 10-minute, 15-minute, 20-
minute, maximum and final values of Pet
CO
2
and arrival time
were all associated with improved ROSC and survival.
We found that Pet
CO
2
values above 1.9 kPa (14.3 mmHg)
measured after 20 minutes of resuscitation identified patients
with ROSC with 100% sensitivity, specificity, PPV and NPV.
No patients with initial, average, final and maximum Pet
CO
2
val-
ues of less than 1.33 kPa (10 mmHg) was resuscitated. With
a cut-off point of 20-minute Pet
CO
2
value at 1.5 kPa (13.5
mmHg) in patients with shockable initial rhythm and a cut-off
point at 2.1 kPa (15.8 mmHg) in patients with nonshockable
initial rhythm, sensitivity and NPV were 100% in predicting dis-
charge from hospital.
In nonshockable rhythm we found higher initial values and
lower values after 1 minute of CPR. In our previous study [25]
we confirmed Pet
CO
2
to be markedly elevated during the first
minute of CPR in asphyxial cardiac arrest. This study therefore
confirmed the findings of studies that used animal models in
which cardiopulmonary arrest was induced by asphyxia. In this
study the Pet
CO
2
values during CPR were initially high, then
decreasing to subnormal levels and then increasing again to
near-normal levels in patients with ROSC. This pattern of
Pet
CO
2
change is different from the pattern observed in car-
diac arrest caused by venticular fibrillation, because cardiac
arrest from venticular fibrillation results in an abrupt cessation
of cardiac output and pulmonary blood flow. We concluded
that, during the period of asphyxia, continued cardiac output
before cardiac arrest permits continued delivery of carbon
dioxide to the lungs, which (in the absence of exhalation)
results in higher alveolar carbon dioxide levels. This is reflected
in increased Pet
CO
2
when ventilation is resumed.
Table 6
Comparison of characteristics and values of Pet
CO
2
between patients with ROSC and without ROSC in nonshockable initial rhythm
in cardiac arrest
ROSC (n = 191) Non-ROSC (n = 242) P value
Age (years) 59.6 ± 12.9 60.5 ± 12.9 0.45
Initial Pet
CO
2
(kPa [mmHg]) 3.7 ± 1.9 (27.8 ± 14.3) 3.1 ± 2.6 (23.3 ± 19.6) 0.02
1 minute Pet
CO
2
(kPa [mmHg]) 2.8 ± 1.6 (21.1 ± 13.2) 2.7 ± 1.4 (20.3 ± 11.2) 0.44
Average Pet
CO
2
(0 to 10 minutes; kPa [mmHg]) 2.8 ± 0.9 (22.2 ± 6.8) 1.1 ± 0.4 (7.8 ± 3.8) < 0.001
10 minute Pet
CO
2
(kPa [mmHg]) 3.3 ± 1.1 (24.8 ± 7.8) 1.2 ± 0.5 (8.2 ± 3.6) <0.001
Average 11 to 15 minute Pet
CO
2
(kPa [mmHg]) 3.2 ± 0.8 (24.1 ± 6.3) 1.0 ± 0.3 (7.7 ± 2.6) <0.001
15 minute Pet
CO
2
(kPa [mmHg]) 3.6 ± 0.9 (27.1 ± 7.2) 1.1 ± 0.4 (7.9 ± 3.5) <0.001
20 minute Pet
CO
2
(kPa [mmHg]) 4.4 ± 1.2 (33.1 ± 9.1) 0.9 ± 0.3 (9.2 ± 2.7) <0.001
Max Pet
CO
2
(kPa [mmHg]) 5.4 ± 1.5 (40.1 ± 12.3) 1.8 ± 0.6 (15.6 ± 4.4) <0.001
Final Pet
CO
2
(kPa [mmHg]) 3.6 ± 0.9 (27.3 ± 7.1) 0.9 ± 0.3 (7.3 ± 2.5) <0.001
Nonshockable' was defined as asystole or pulseless electrical activity. Values are expressed as mean ± standard deviation. PetCO
2
, partial
pressure of end-tidal carbon dioxide; ROSC, restoration of spontaneous circulation.
Critical Care Vol 12 No 5 Kolar et al.
Page 8 of 13
(page number not for citation purposes)
Our findings in patients with shockable initial rhythm confirmed
the view of Levine and coworkers [8] that the data from their
study (Pet
CO
2
in patients with pulseless electrical activity) can
be extended to all types of cardiac arrest. Sehra and cowork-
ers [26], in a human model of ventricular fibrillation, confirmed
that Pet
CO
2
can predict severity of ventricular fibrillation car-
diac arrest and efficacy of CPR in this type of cardiac arrest.
Our findings in shockable group possible indirectly confirm the
three-phase, time-dependent concept of cardiac arrest due to
ventricular fibrillation [26]. Pet
CO
2
values under 1.5 kPa (11.3
mmHg) after 20 minutes of CPR (or less that 1.8 kPa [13.5
mmHg] after 15 minutes of CPR) are incompatible with
ROSC. This is time of the end of haemodynamic phase of
CPR. Possibly, these values represent irreversible hemody-
namic collapse, with inadequate coronary or myocardial per-
fusion pressure, or they may represent perfusion pressures
supplied too late (after the haemodynamic phase), with conse-
quent irreversible tissue damage [27,28].
Our prehospital data, combined with the findings of other
investigators, provide strong support for a resuscitation
thresholds of Pet
CO
2
1.33 kPa (10 mmHg) initially and 1.9 kPa
(14.3 mmHg) after 20 minutes of CPR in the field. The initial
values of Pet
CO
2
are not influenced by medications used dur-
ing CPR, and values at 20 minutes reflect the patient's
'response' to resuscitation efforts. We recommend initial and
20-minute (final Pet
CO
2
) to be ranked in Utstein-style reports.
The objectives of this approach are to assess the initial condi-
Table 7
Performance of various values of Pet
CO
2
and duration of CPR for prediction of ROSC in patients with shockable initial rhythm in
cardiac arrest
Pet
CO
2
Cut-off
(kPa [mmHg])
nMin-max
(kPa [mmHg])
Mean ± SD
(kPa [mmHg])
Sensitivity (%) Specificity
(%)
PPV (%) NPV (%) AUROC
(95% CI)
Initial ≤1.3 (10) 71 0.0–1.3
(0.0–10)
0.69 ± 0.3
(5.2 ± 2.6)
100 76 91 100 0.93
(0.86–0.97)
>1.3 (10) 233 1.4–8.7
(10.1–65.4)
2.59 ± 1.08
(19.6 ± 8.3)
0–10 minute
(average)
≤1.6 (12.1) 86 0.3–1.6
(2.8–12.1)
0.96 ± 0.33
(7.22 ± 3.1)
100 92 97 100 0.99
(0.99–1.00)
>1.6 (12.1) 218 1.7–4.8
(12.2–39.1)
2.83 ± 0.77
(21.1 ± 5.8)
10 minute ≤1.5 (11.3) 72 0.3–1.5
(2.6–11.3)
0.96 ± 0.37
(7.2 ± 2.9)
100 77 91 100 0.99
(0.98–0.99)
>1.5 (11.3) 232 1.6–5.8
(11.4–43.6)
3.17 ± 0.96
(24.1 ± 7.3)
11–15 minute
(average)
≤1.6 (12.1) 93 0.4–1.6
(3.7–12.1)
0.99 ± 0.28
(7.5 ± 2.1)
100 100 100 100 1.00
(1.00–1.00)
>1.6 (12.1) 211 1.8–5.5
(13.5–41.4)
3.22 ± 0.74
(24.1 ± 8.3)
15 minute ≤1.8 (13.5) 92 0.2–1.8
(1.6–13.5)
1.11 ± 0.39
(7.9 ± 2.9)
100 99 100 100 1.00
(1.00–1.00)
>1.8 (13.5) 212 1.9–7.7
(13.6–59.3)
3.71 ± 0.99
(27.8 ± 7.3)
20 minute ≤1.5 (11.3) 93 0.3–1.5
(2.8–11.3)
0.95 ± 0.26
(7.3 ± 2.2)
100 100 100 100 1.00
(1.00–1.00)
>1.5 (11.3) 211 2.1–7.3
(11.4–54.9)
4.33 ± 1.11
(32.3 ± 7.9)
Max ≤2.3 (17.3) 83 0.7–2.3
(5.26–17.3)
1.56 ± 0.34
(13.2 ± 3.4)
100 89 95 100 0.99
(0.90–1.00)
>2.3 (17.3) 221 2.4–10.6
(17.4–79.7)
5.23 ± 1.5
(39.2 ± 11.3)
Final ≤1.5 (11.3) 93 0.3–1.5 (2.6–
11.3
1.0 ± 0.32
(7.5 ± 1.9)
100 100 100 100 1.00
(1.00–1.00)
>1.5 (11.3) 211 1.9–6.3
(11.3–47.4)
3.69 ± 0.94
(27.8 ± 7.1)
'Shockable' was defined as ventricular fibrillation or tachycardia. AUROC, area under the receiver operating characteristic curve; CI, confidence
interval; CPR, cardiopulmonary resuscitation; NPV, negative predictive value; Pet
CO
2
, partial pressure of end-tidal carbon dioxide; PPV, positive
predictive value; ROSC, restoration of spontaneous circulation; SD, standard deviation.
Available online />Page 9 of 13
(page number not for citation purposes)
tion of the patient in the setting of nontraumatic normothermic
cardiac arrest, and to optimize the reliability of Pet
CO
2
in pre-
dicting survival in such patients.
Our finding are potentially important, especially in emergency
medical system that do not include physicians. The results of
the study confirm that Pet
CO
2
can play a pivotal role in the mul-
tifactorial decision-making process of whether to discontinue
resuscitative efforts. Application of our findings could improve
clinical prediction rules for TOR in the field and reduce the
number of patients with cardiac arrest who undergo pro-
longed, futile resuscitation efforts; furthermore, they may
reduce transportation of patients with refractory cardiac arrest
to the hospital. For the health care system, there is less cost
involved in TOR in the field than in the transfer of the patient to
the hospital [12,29,30].
Conclusion
Measurements of PetCO
2
should be used to predict nonsur-
vival of patients with cardiopulmonary arrest. End-tidal carbon
dioxide levels should be monitored during CPR and should be
regarded as having prognostic value for determining the out-
come of resuscitative efforts. The results can inform decisions
regarding when advanced cardiac life support can be discon-
tinued, thus decreasing costs and dilemmas to resuscitation
teams. Based on our findings, we believe that end-tidal carbon
Table 8
Performance of various values of Pet
CO
2
and duration of CPR for prediction of ROSC in patients with nonshockable initial rhythm in
cardiac arrest
Pet
CO
2
Cut-off
(kPa [mmHg])
nMin-max
(kPa [mmHg])
Mean ± SD
(kPa [mmHg])
Sensitivity (%) Specificity
(%)
PPV (%) NPV (%) AUROC
(95% CI)
Initial ≤1.3 (10) 97 0.0–1.3
(0.0–10)
0.66 ± 0.32
(5.1 ± 2.3)
100 40 57 100 0.61
(0.56–0.67)
>1.3 (10) 336 1.4–8.4
(10.1–63.2)
4.17 ± 2.2
(30.8 ± 15.8)
0–10 minute
(average)
≤1.6 (12.1) 220 0.4–1.6
(3.4–12.1)
0.97 ± 0.34
(7.3 ± 2.2)
100 91 90 100 0.99
(0.98–0.99)
>1.6 (12.1) 213 1.7–5.6
(12.2–42.1)
2.74 ± 0.87
(20.6 ± 6.7)
10 minute ≤1.3 (11) 147 0.3–1.3
(3.6–11)
0.86 ± 0.32
(6.9 ± 2.1)
100 61 67 100 0.98
(0.97–0.99)
>1.3 (11) 286 1.4–7.2
(11.1–54.2)
2.74 ± 1.14
(21.1 ± 7.9)
11–15 minute
(average)
≤1.7 (12.8) 240 0.4–1.7
(3.7–12.8)
0.99 ± 0.31
(7.3 ± 2.6)
100 99 99 100 1.00
(0.99–1.00)
>1.7 (12.8) 193 1.9–5.1
(12.9–38.4)
3.15 ± 0.79
(24.1 ± 7.1)
15 minute ≤1.8 (13.5) 236 0.3–1.8
(2.3–13.5)
1.11 ± 0.39
(7.7 ± 3.3)
100 98 97 100 0.99
(0.99–1.00)
>1.8 (13.5) 197 1.9–6.1
(13.6–45.9)
3.58 ± 0.97
(27.1 ± 7.4)
20 minute ≤1.9 (14.3) 242 0.3–1.9
(2.2–14.3)
0.91 ± 0.29
(7.3 ± 2.4)
100 100 100 100 1.00
(1.00–1.00)
>1.9 (14.3) 191 2.1–7.8
(14.4–58.7)
4.38 ± 1.17
(33.1 ± 7.6)
Max ≤2.3 (17.3) 210 0.8–2.3
(6.7–17.3)
1.59 ± 0.35
(13.2 ± 3.4)
100 87 86 100 1.00
(1.00–1.00)
>2.3 (17.3) 223 2.4–10.7
(17.4–80.5)
5.0 ± 1.61
(37.6 ± 15.8)
Final ≤1.6 (12.3) 239 0.2–1.6
(1.8–12.3)
0.97 ± 0.33
(7.2 ± 2.8)
100 99 98 100 1.00
(1.00–1.00)
>1.6 (12.3) 194 1.0–6.6
(12.4–49.6)
3.59 ± 0.98
(27.1 ± 7.4)
'Nonshockable' was defined as asystole or pulseless electrical activity. AUROC, area under the receiver operating characteristic curve; CI,
confidence interval; CPR, cardiopulmonary resuscitation; NPV, negative predictive value; Pet
CO
2
, partial pressure of end-tidal carbon dioxide;
PPV, positive predictive value; ROSC, restoration of spontaneous circulation; SD, standard deviation
Critical Care Vol 12 No 5 Kolar et al.
Page 10 of 13
(page number not for citation purposes)
Table 9
Performance of various values of Pet
CO
2
and duration of CPR for prediction of survival in patients with shockable initial rhythm in
cardiac arrest
Pet
CO
2
Cut-off
(kPa [mmHg])
nMin-max
(kPa [mmHg])
Mean ± SD
(kPa [mmHg])
Sensitivity (%) Specificity
(%)
PPV (%) NPV (%) AUROC
(95% CI)
Initial ≤1.3 (10) 71 0.0–10
(0.0–1.3)
5.3 ± 1.9
(0.69 ± 0.35)
100 34 40 100 0.73
(0.67–0.78)
>1.3 (10 233 10.1–65.4
(1.4–8.7)
19.5 ± 6.8
(2.59 ± 1.07)
0–10 minute
(average)
≤1.7 (12.8) 91 0.3–1.7
(2,5–12.8)
0.99 ± 0.36
(7.5 ± 2.1)
100 43 44 100 0.82
(0.78–0.87)
>1.7 (12.8) 213 1.8–4.8
(12.9–36.1)
2.86 ± 0.76
(21.8 ± 5.2)
10 minute ≤1.6 (12.1) 82 0.3–1.6
(2.3–12.1)
1.04 ± 0.41
(7.6 ± 3.4)
100 39 42 100 0.82
(0.78–0.87)
>1.6 (12.1) 222 1.7–5.8
(12.2–43.6)
3.24 ± 0.93
(24.1 ± 7.1)
11–15 minute
(average)
≤1.6 (12.1) 93 0.4–1.6
(3.3–12.2)
0.99 ± 0.28
(7.4 ± 2.3)
100 44 45 100 0.78
(0.73–0.83)
>1.6 (12.1) 211 1.8–5.5
(12.3–41.4)
3.22 ± 0.74
(24.4 ± 4.9)
15 minute ≤1.9 (14.3) 94 0.2–1.9
(1.9–14.3)
1.25 ± 0.41
(7.9 ± 2.9)
100 45 45 100 0.78
(0.73–0.83)
>1.9 (14.3) 210 2.0–7.7
(14.4–57.9)
3.73 ± 0.98
(27.8 ± 7.1)
20 minute ≤1.5 (11.3) 93 0.3–1.5
(2.8–11.3)
0.95 ± 0.26
(7.2 ± 2.1)
100 44 45 100 0.78
(0.72–0.83)
>1.5 (11.3) 211 2.1–7.3
(11.4–54.9)
4.33 ± 1.11
(32.3 ± 7.8)
Max ≤2.5 (18.8) 89 0.7–2.5
(0.7–18.8)
1.62 ± 0.39
(12.4 ± 3.3)
100 42 44 100 0.81
(0.76–0.86)
>2.5 (18.8) 215 2.6–10.6
(18.9–79.7)
5.3 ± 1.48
(39.9 ± 11.5)
Final ≤1.5 (11.3) 93 0.3–1.5
(2.7–11.3)
1.0 ± 0.32
(7.5 ± 3.1)
100 44 45 100 0.78
(0.73–0.83)
>1.5 (11.3) 211 1.9–6.3
(11.4–47.4)
3.69 ± 0.94
(27.8 ± 6.9)
'Shockable' was defined as ventricular fibrillation or tachycardia. AUROC, area under the receiver operating characteristic curve; CI, confidence
interval; CPR, cardiopulmonary resuscitation; NPV, negative predictive value; Pet
CO
2
, partial pressure of end-tidal carbon dioxide; PPV, positive
predictive value; ROSC, restoration of spontaneous circulation; SD, standard deviation.
dioxide monitoring should be incorporated into advanced car-
diac life support algorithms and ranked in Utstein-style reports
to provide insight into the condition of patients suffering
cardiac arrest.
Competing interests
The authors declare that they have no competing interests.
Authors' contributions
MK participated in designing the study, collection and analysis
of data, and helped to draft the manuscript. MK participated in
designing the study, and collection and statistical analysis of
data. PK participated in designing the study and helped to
draft the manuscript. ŠG participated in designing the study,
collection and analysis of data, revised the manuscript for
important intellectual content and helped to draft the manu-
script. All authors read and approved the final version of the
manuscript.
Available online />Page 11 of 13
(page number not for citation purposes)
Table 10
Performance of various values of Pet
CO
2
and duration of CPR for prediction of survival in patients with nonshockable initial rhythm
in cardiac arrest
Pet
CO
2
Cut-off
(kPa [mmHg])
nMin-max
(kPa [mmHg])
Mean ± SD
(kPa [mmHg])
Sensitivity (%) Specificity (%) PPV (%) NPV (%) AUROC
(95% CI)
initial ≤1.3 (10) 97 0.0–1.3
(0.0–10)
0.66 ± 0.32
(5.1 ± 1.9)
100 27 23 100 0.58
(0.52–0.63)
>1.3 (10) 336 1.4–8.4
(10.1–63.2)
4.17 ± 2.12
(30.9 ± 15.8)
0–10 min ≤1.7 (12.8) 229 0.4–1.7
(3.5–12.8)
0.99 ± 0.36
(7.1 ± 3.3)
100 64 37 100 0.88
(0.84–0.91)
>1.7 (12.8) 204 1.8–5.6
(12.9–42.1)
2.79 ± 0.86
(21.5 ± 6.2)
10 min ≤1.6 (12.1) 199 0.3–1.6
(2.2–12.1)
1.03 ± 0.38
(7.6 ± 3.1)
100 56 32 100 0.87
(0.83–0.91)
>1.6 (12.1) 234 1.7–7.2
(12.2–54.2)
3.02 ± 1.08
(22.6 ± 6.5)
11–15 min ≤1.7 (12.8) 239 0.4–1.7
(3.4–12.8)
0.99 ± 0.31
(7.3 ± 2.8)
100 67 39 100 0.86
(0.83–0.90)
>1.7 (12.8) 194 1.4–5.1
(12.9–38.4)
3.14 ± 0.81
(23.3 ± 6.7)
15 min ≤1.9 (14.3) 241 0.3–1.9
(2.4–14.3)
1.12 ± 0.41
(7.9 ± 3.8)
100 67 39 100 0.87
(0.84–0.91)
>1.9 (14.3) 192 2.1–6.1
(14.4–45.9)
3.62 ± 0.94
(28.6 ± 7.5)
20 min ≤2.1 (15.8) 242 0.3–2.1
(2.3–15.8)
0.91 ± 0.31
(7.2 ± 2.2)
100 68 40 100 0.87
(0.84.0.91)
>2.1 (15.8) 190 2.3–7.8
(15.9–58.7)
4.39–1.11
(33.1 ± 7.7)
max ≤2.8 (21.1) 231 0.8–2.8
(6.1–21.1)
1.68 ± 0.44
(13.4 ± 3.5)
100 65 38 100 0.89
(0.86–0.92)
>2.8 (21.1) 202 2.9–10.7
(21–80.5)
5.26 ± 1.48
(39.1 ± 12.2)
Final ≤1.6 (12.1) 240 0.2–1.6
(1.9–12.1)
0.97 ± 0.33
(6.9 ± 2.7)
100 67 39 100 0.87
(0.84–0.91)
>1.6 (12.1) 193 1.9–6.6
(12.2–49.6)
3.06 ± 0.97
(27.1 ± 7.2)
'Nonshockable' was defined as asystole or pulseless electrical activity. AUROC, area under the receiver operating characteristic curve; CI,
confidence interval; CPR, cardiopulmonary resuscitation; NPV, negative predictive value; Pet
CO
2
, partial pressure of end-tidal carbon dioxide;
PPV, positive predictive value; ROSC, restoration of spontaneous circulation; SD, standard deviation.
Critical Care Vol 12 No 5 Kolar et al.
Page 12 of 13
(page number not for citation purposes)
References
1. Larkin GL: Termination of resuscitation:the art of clinical deci-
sion making. Curr Opin Crit Care 2002, 8:224-229.
2. Rudner R, Jalowiecki P, Karpel E, Dziurdzik P, Alberski B, Kawecki
P: Survival after out-of-hospital cardiac arrests in Katowice
(Poland): outcome report according to the Utstein style.
Resuscitation 2004, 61:315-325.
3. Fredriksson M, Herlitz J, Engdahl J: Nineteen years experience of
out-of-hospital cardiac arrest in Gothenburg-reported in
Utstein style. Resuscitation 2003, 58:37-47.
4. Bunch TJ, White RD, Gersh BJ, Meverden RA, Hodge DO, Ball-
man KV, Hammill SC, Shen WK, Packer DL: Long-term out-
comes of out-of-hospital cardiac arrest after successful early
defibrilation. N Engl J Med 2003, 348:2626-2633.
5. Grmec Š, Križmarič M, Mally Š, Koželj A, Špindler M, Lesnik B:
Utstein style analysis of out-of-hospital cardiac arrest
bystander CPR and end expired carbon dioxide. Resuscitation
2007, 72:404-414.
6. Becker LB, Ostrander MP, Barrett J, Kondos GT: Outcome of
CPR in a large metropolitan area: where are the survivors?
Ann Emerg Med 1991, 20:355-361.
7. Lombardi G, Gallagher J, Gennis P: Outcome out-of-hospital
cardiac arrest in New York City: the Pre-Hospital Arrest Sur-
vival Evaluation (PHASE) Study. JAMA 1994, 271:678-683.
8. Levine RL, Wayne MA, Miller CC: End-tidal carbon dioxide and
outcome out-of-hospital cardiac arrest. N Engl J Med 1997,
337:301-306.
9. Marwick TH, Case CC, Siskind V, Woodhouse SP: Prediction of
survival from resuscitation: a prognosis index derived from
multivariate logistic model analysis. Resuscitation 1991,
22:129-137.
10. Cooper S, Duncan F: Reliability testing and update of the
Resuscitation Predictor Scoring (RPS) Scale. Resuscitation
2007, 74:253-258.
11. Bonin MJ, Pepe PE, Kimball KT, Clark PS: Distinct criteria for ter-
mination of resuscitation in the out of hospital setting. JAMA
1993,
270:1457-1462.
12. Morrison LJ, Visentin LM, Kiss A, Theriault R, Eby D, Vermeulen M,
Sherbino J, Verbeek R: Validation of a rule for termination of
resuscitation in out-of-hospital cardiac arrest. N Engl J Med
2006, 355:478-487.
13. Karl BK, Arthur BS, William DV, Charles FB, Willis AT, Gordon AE:
Changes in expired end-tidal carbon dioxide during cardiopul-
monary resuscitation in dogs: a prognostic guide for resusci-
tation efforts. J Am Coll Cardiol 1989, 13:1184-1189.
14. Skogvoll E, Sangolt GK, Isern E, Gisvold SE: Out-of-hospital car-
diopulmonary resuscitation: a population-based Norwegian
study of incidence and survival. Eur J Emerg Med 1999,
6:323-330.
15. Cooper S, Janghorbani M, Cooper G: A decade of in-hospital
resuscitation: outcomes and prediction of survival? Resuscita-
tion 2006, 68:231-237.
16. Bialecky L, Woodward RS: Predicting death after CPR. Experi-
ence at a non-teaching community hospital with a full-time
critical care staff. J Emerg Med 1995, 108:1009-1017.
Key messages
• A Pet
CO
2
level of 1.9 kPa (14.3 mmHg) or less meas-
ured 20 minutes after the initiation of advanced cardiac
life support accurately predicts death in patients with
nonshockable initial rhythm who are suffering cardiac
arrest.
• When a 20-minute Pet
CO
2
value of 1.5 kPa (11.3
mmHg) or less was used as a screening test to predict
death in patients with shockable rhythm, the sensitivity,
specificity, PPV and NPV were all 100%.
• Values of Pet
CO
2
less than 1.5 kPa (11.3 mmHg) after
20 minutes of CPR (or <1.8 kPa [<13.5 mmHg] after
15 minutes of CPR) are incompatible with ROSC.
• End-tidal carbon dioxide levels should be monitored
during CPR, and should be regarded as having prog-
nostic value in predicting the outcome of resuscitative
efforts and informing decisions regarding TOR.
Table 12
Variables associated with survival in cardiac arrest
Variables OR (95% CI) P value
Initial rhythm (VF/VT) 1.86 (1.26–3.11) <0.001
Arrival time 1.39 (1.33–1.60) 0.01
Witness 9.98 (2.89–34.44) <0.0001
Bystander CPR 5.05 (2.24–11.39) <0.0001
Intial Pet
CO
2
1.93 (1.48–3.75) 0.018
Average Pet
CO
2
2.31 (1.45–4.86) <0.001
10 min Pet
CO
2
2.11 (1.27–4.16) 0.001
15 min Pet
CO
2
2.47 (1.33–5.21) <0.001
20 min Pet
CO
2
3.85 (1.71–8.34) <0.001
Final Pet
CO
2
2.37 (1.67–3.37) <0.001
CI, confidence interval; CPR, cardiopulmonary resuscitation; OR,
odds ratio; PetCO
2
, partial pressure of end-tidal carbon dioxide; VF,
ventricular fibrillation; VT, ventricular tachycardia.
Table 11
Variables associated with ROSC in cardiac arrest
Variable OR (95% CI) P value
Intial rhythm (VF/VT) 2.13 (1.17–4.22) 0.02
Female sex 1.58 (1.14–1.87) 0.04
Time arrival 1.69 (1.37–2.56) 0.01
Witness 1.65 (1.29–3.14) 0.02
Bystander CPR 3.26 (1.89–8.51) 0.01
Initial Pet
CO
2
21.68 (9.72–38.37) <0.0001
Average Pet
CO
2
19.48 (7.53–33.86) <0.001
10 minute Pet
CO
2
14.37 (6.65–28.63) <0.001
15 minute Pet
CO
2
17.41 (7.62–24.57) <0.001
20 minute Pet
CO
2
24.86 (10.11–42.73) <0.001
Max Pet
CO
2
12.23 (4.83–23.64) <0.001
Final Pet
CO
2
18.07 (6.93–28.34) <0.001
CI, confidence interval; CPR, cardiopulmonary resuscitation; OR,
odds ratio; PetCO
2
, partial pressure of end-tidal carbon dioxide;
ROSC, restoration of spontaneous circulation; VF, ventricular
fibrillation; VT, ventricular tachycardia.
Available online />Page 13 of 13
(page number not for citation purposes)
17. Richman PB, Vadeboncoeur TF, Chikani V, Clark L, Bobrow BJ:
Independent evaluation of an out-of-hospital termination of
resuscitation (TOR) clinical decision rule. Acad Emerg Med
2008, 15:517-521.
18. Eckstein M, Stratton SJ, Chan LS: Termination of resuscitative
efforts for out-of-hospital cardiac arrests. Acad Emerg Med
2005, 12:65-70.
19. Kalenda Z: The capnogram as a guide to the efficacy of cardiac
massage. Resuscitation 1978, 6:259-263.
20. Falk JL, Rackow EC, Weil MH: End-tidal carbon dioxide concen-
tration during cardiopulmonary resuscitation. N Engl J Med
1988, 318:607-611.
21. Sanders AB, Kern KB, Otto CW, Milander MM, Ewy GA: End-tidal
carbon dioxide during cardiopulmonary resuscitation: a prog-
nostic indicator for survival. JAMA 1989, 262:1347-1351.
22. Callaham M, Barton C: Prediction of outcome of cardiopulmo-
nary resuscitation from end-tidal carbon dioxide concentra-
tion. Crit Care Med 1990, 18:358-362.
23. Cantineau JP, Merckx P, Lambert Y, Sorkine M, Betrand C, Duval-
destin P: Effect of epinephrine on end-tidal carbon dioxide
pressure during prehospital cardiopulmonary resuscitation.
Am J Emerg Med 1994, 12:267-270.
24. Mally S, Jelatancev A, Grmec Š: Effects of epinephrine and
vasopressin on end-tidal carbon dioxide tension and mean
arterial blood pressure in out-of-hospital cardiopulmonary
resuscitation: an observational study. Crit Care 2007, 11:R39.
25. Grmec Š, Lah K, Tusek-Bunc K: Difference in end-tidal CO2
between asphyxia cardiac arrest and ventricular fibrillation/
pulseless ventricular tachycardia cardiac arrest in the prehos-
pital setting. Crit Care 2003, 7:R139-R144.
26. Sehra R, Underwood K, Checcchia P: End tidal
CO
2
is a quantita-
tive measure of cardiac arrest. Pacing Clin Electrophysiol 2003,
26:515-517.
27. Ewy GA: Cardiocerebral resuscitation: the new cardiopulmo-
nary resuscitation. Circulation 2005, 111:2134-2142.
28. Ewy GA: Cardiac resuscitation: when is enough enough? N
Engl J Med 2006, 355:510-512.
29. Gordon AE: Cardiac resuscitation: when is enough enough? N
Engl J Med 2006, 355:510-512.
30. Cone DC, Bailey ED, Spackman AB: The safety of a field termi-
nation-of-resuscitation protocol. Prehosp Emerg Care 2005,
9:276-281.