Báo cáo y học: "Cardiorespiratory effects of spontaneous breathing in two different models of experimental lung injury: a randomized controlled trial" doc
Bạn đang xem bản rút gọn của tài liệu. Xem và tải ngay bản đầy đủ của tài liệu tại đây (705.07 KB, 13 trang )
Open Access
Available online />Page 1 of 13
(page number not for citation purposes)
Vol 12 No 6
Research
Cardiorespiratory effects of spontaneous breathing in two
different models of experimental lung injury: a randomized
controlled trial
Dirk Varelmann
1
, Thomas Muders
1
, Jörg Zinserling
1
, Ulf Guenther
1
, Anders Magnusson
2
,
Göran Hedenstierna
3
, Christian Putensen
1
and Hermann Wrigge
1
1
Department of Anesthesiology and Intensive Care Medicine, University of Bonn, Sigmund-Freud-Strasse 25, D-53105 Bonn, Germany
2
Department of Radiology, University of Uppsala, University Hospital, SE-75185 Uppsala, Sweden
3
Department of Clinical Physiology, University of Uppsala, University Hospital, SE-75185 Uppsala, Sweden
Corresponding author: Hermann Wrigge,
Received: 22 Jul 2008 Revisions requested: 29 Aug 2008 Revisions received: 3 Oct 2008 Accepted: 4 Nov 2008 Published: 4 Nov 2008
Critical Care 2008, 12:R135 (doi:10.1186/cc7108)
This article is online at: />© 2008 Varelmann et al.; licensee BioMed Central Ltd.
This is an open access article distributed under the terms of the Creative Commons Attribution License ( />),
which permits unrestricted use, distribution, and reproduction in any medium, provided the original work is properly cited.
Abstract
Introduction Acute lung injury (ALI) can result from various
insults to the pulmonary tissue. Experimental and clinical data
suggest that spontaneous breathing (SB) during pressure-
controlled ventilation (PCV) in ALI results in better lung aeration
and improved oxygenation. Our objective was to evaluate
whether the addition of SB has different effects in two different
models of ALI.
Methods Forty-four pigs were randomly assigned to ALI
resulting either from hydrochloric acid aspiration (HCl-ALI) or
from increased intra-abdominal pressure plus intravenous oleic
acid injections (OA-ALI) and were ventilated in PCV mode either
with SB (PCV + SB) or without SB (PCV – SB).
Cardiorespiratory variables were measured at baseline after
induction of ALI and after 4 hours of treatment (PCV + SB or
PCV – SB). Finally, density distributions and end-expiratory lung
volume (EELV) were assessed by thoracic spiral computed
tomography.
Results PCV + SB improved arterial partial pressure of oxygen/
inspiratory fraction of oxygen (PaO
2
/FiO
2
) by a reduction in
intrapulmonary shunt fraction in HCl-ALI from 27% ± 6% to
23% ± 13% and in OA-ALI from 33% ± 19% to 26% ± 18%,
whereas during PCV – SB PaO
2
/FiO
2
deteriorated and shunt
fraction increased in the HCl group from 28% ± 8% to 37% ±
17% and in the OA group from 32% ± 12% to 47% ± 17% (P
< 0.05 for interaction time and treatment, but not ALI type). PCV
+ SB also resulted in higher EELV (HCl-ALI: 606 ± 171 mL, OA-
ALI: 439 ± 90 mL) as compared with PCV – SB (HCl-ALI: 372
± 130 mL, OA-ALI: 192 ± 51 mL, with P < 0.05 for interaction
of time, treatment, and ALI type).
Conclusions SB improves oxygenation, reduces shunt fraction,
and increases EELV in both models of ALI.
ALI: acute lung injury; APRV: airway pressure release ventilation; ARDS: acute respiratory distress syndrome; BL-ALI: baseline acute lung injury; CO:
cardiac output; CT: computed tomography; CVP: central venous pressure; DO
2
: oxygen delivery; EELV: end-expiratory lung volume; FiO
2
: inspiratory
fraction of oxygen; HCl: hydrochloric acid; HCl-ALI, hydrochloric acid-induced acute lung injury; HR: heart rate; IAP: intra-abdominal pressure; I/E:
inspiratory/expiratory (ratio); ITBV: intrathoracic blood volume; MAP: mean arterial pressure; MIGET: multiple inert gas elimination technique; OA:
oleic acid; OA-ALI, oleic acid-induced acute lung injury; PaCO
2
: arterial partial pressure of carbon dioxide; PaO
2
: arterial partial pressure of oxygen;
P
aw, mean
: mean airway pressure; PCV: pressure-controlled ventilation; PEEP: positive end-expiratory pressure; PEEP
I, dyn
: dynamic intrinsic positive
end-expiratory pressure; P
es
: esophageal pressure; P
insp
: inspiratory pressure; P
transp, mean
: mean transpulmonary airway pressure; ROI: region of inter-
est; RR: respiratory rate; SB: spontaneous breathing; SD: standard deviation; SD
atelect
: standard deviation of non-aerated tissue; SD%
atelect
: fraction
of non-aerated tissue per region of interest; SVR: systemic vascular resistance; : ventilation/perfusion (ratio); V
E
: minute ventilation; VO
2
: oxygen
consumption; V
T
: tidal volume.
VQ
A
Critical Care Vol 12 No 6 Varelmann et al.
Page 2 of 13
(page number not for citation purposes)
Introduction
Alveolar recruitment in response to therapeutic interventions
such as mechanical ventilation with positive end-expiratory
pressure (PEEP) has been suggested to differ between direct
(pulmonary) or indirect (extrapulmonary) acute lung injury (ALI)
or the acute respiratory distress syndrome (ARDS) [1-3]. In
direct ALI/ARDS, the injury originates from the alveolar epithe-
lium and is characterized by alveolar collapse, fibrinous exu-
dates, and alveolar wall edema [4], which might result in an
increased lung elastance while chest wall elastance is often
normal Computed tomography (CT) scans show equal
amounts of consolidation and ground-glass opacities, with
consolidated areas favoring the vertebral regions [5]. In indi-
rect ALI/ARDS, the insult originates from the vascular
endothelium and may cause less damage to the lung but may
be associated with increased chest wall elastance [6] often
caused by restricted movements and cranial shift of the dia-
phragm due to increased intra-abdominal pressure (IAP) [1,7].
Ground-glass opacity predominates and is evenly distributed
[5]. Thus, direct and indirect ALI/ARDS have been suggested
to have two distinct diseases with different respiratory
mechanics, histopathology, and CT findings [1,5,8,9].
Maintaining unsupported spontaneous breathing (SB) with air-
way pressure release ventilation (APRV) has been shown to
improve oxygenation when compared with controlled mechan-
ical ventilation in patients with ALI/ARDS of different origin
[10,11]. SB counteracts atelectasis formation and favors alve-
olar recruitment [12,13], resulting in an improvement in venti-
lation/perfusion ( ) matching [14-17]. On the other hand,
during controlled ventilation, as the diaphragm relaxes, it is dis-
placed by the weight of the contents of the abdominal cavity,
leading to the redistribution of tidal volumes (V
T
) to anterior,
non-dependent, and less perfused lung regions [13,18].
These effects may be even more pronounced in indirect ALI/
ARDS. Whether previously shown beneficial cardiopulmonary
effects of SB might differ depending on ALI/ARDS origin has
not been investigated yet. We asked the question of whether
SB during pressure-controlled ventilation (PCV) improves oxy-
genation, distribution, shunt fraction, and end-expira-
tory lung volume (EELV) in two different models of ALI. This
research question was tested in porcine models of hydrochlo-
ric acid (HCl)-induced ALI and in the combination of oleic acid
(OA) injection and elevated IAP.
Materials and methods
Animals
Experiments were approved by the animal ethics committee of
the University of Uppsala. Forty-four pigs were anesthetized
and mechanically ventilated in the supine position. The animals
of each group were further randomly assigned into subgroups
receiving either PCV with SB (PCV + SB) or without SB (PCV
– SB). Anesthesia, tracheotomy, and fluid infusion were per-
formed as previously described [12]. A detailed description of
measurements and statistical analysis is provided in Additional
data file 1.
Ventilatory setting
Pressure-controlled ventilation without spontaneous
breathing
PCV is a time-cycled ventilatory mode applied at a respiratory
rate (RR) of 15 breaths per minute, an inspiratory to expiratory
(I/E) ratio of 1:1, an inspiratory fraction of oxygen (FiO
2
) of 0.5,
a PEEP of 5 cm H
2
O, and an inspiratory pressure (P
insp
) result-
ing in a V
T
of approximately 10 mL/kg using a standard ventila-
tor (Servo I; Siemens-Elema AB, Solna, Sweden) to maintain
normocapnia (35 mm Hg < arterial partial pressure of carbon
dioxide [PaCO
2
] < 45 mm Hg). P
insp
was adjusted accord-
ingly. SB efforts were excluded by the absence of negative
deflections in the esophageal pressure (P
es
) tracings. After
induction of ALI (baseline ALI [BL-ALI]), RR had to be
increased as well as P
insp
to compensate for a decrease of
compliance and to maintain normocapnia. I/E, PEEP, and FiO
2
were kept constant. After BL-ALI measurements, the animals
were randomly assigned to continue controlled mechanical
ventilation or to resume SB.
Pressure-controlled ventilation with spontaneous breathing
Ventilator settings were guided by the principles described
above. RR was decreased to 15 breaths per minute, which
corresponds to approximately 50% of the RR after induction
of ALI (BL-ALI), for re-institution of SB (confirmed by animal-
generated inspiratory flow and concomitant negative P
es
deflections). I/E ratio was kept constant.
Lung injury
Hydrochloric acid-induced acute lung injury
HCl (0.1 M) was intratracheally instilled until a stable lung
injury was achieved.
Oleic acid-induced acute lung injury
The abdominal pressure was increased to 20 cm H
2
O by infu-
sion of normal saline into the abdominal cavity, followed by
central venous injection of OA. We aimed at a target arterial
partial pressure of oxygen (PaO
2
)/FiO
2
of less than 200 mm
Hg, but a PaO
2
/FiO
2
of less than 300 mm Hg was accepted
after stabilization of ALI.
Measurements
Instrumentation of the animals has been described previously
[19]. Heart rate (HR) and intravascular pressures were meas-
ured using standard technology [19]. Cardiac output (CO)
and intrathoracic blood volume (ITBV) were determined with
the transpulmonary thermal-indicator dilution technique [19].
Systemic and pulmonary vascular resistances were calculated
using standard equations. Gas flow and derived variables, as
well as airway and P
es
values, were continuously determined
and stored on personal computers for offline analyses. Blood
gases were analyzed using standard blood gas electrodes,
VQ
A
VQ
A
Available online />Page 3 of 13
(page number not for citation purposes)
and oxygen saturation and hemoglobin were analyzed using
spectrophotometry. distribution was measured using
the multiple inert gas elimination technique (MIGET) [20]. Spi-
ral scans were performed at the end of the experiments for
determination of density distributions and pulmonary air con-
tent, which should represent EELV. Scans were carried out in
randomized directions at end-inspiration and end-expiration
with the tube clamped, and images were stored on personal
computers for offline analysis.
Protocol
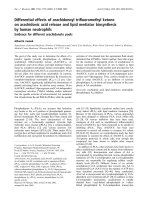
An illustration of the study protocol is given in Figure 1. In brief,
blood gases and hemodynamic and ventilatory parameters
were obtained 30 minutes after completing instrumentation
(Pre-ALI) and 60 minutes after completing initiation of ALI (BL-
ALI), together with the first MIGET measurement, and the ani-
mals were subjected to controlled mechanical ventilation with-
out SB. Thereafter, animals of the two groups (HCl-induced
and OA-induced ALI) were further randomly assigned either to
continue with controlled mechanical ventilation (PCV – SB) or
to additional SB (PCV + SB). After 240 minutes, another set
of measurements, including MIGET and CT scans, was per-
formed (Treatment). The overall study period was 8 hours.
Four animals died in the course of the experiments: two pigs
died directly after induction of lung injury; in two others, for
technical reasons, no CT scans were obtained, resulting in n
= 11 in the HCl-ALI PCV + SB group, n = 11 in the HCl-ALI
PCV – SB group, n = 8 in the OA-ALI PCV + SB group, and
n = 10 in the OA-ALI PCV – SB group.
Statistical analysis
To detect differences in PaO
2
/FiO
2
, shunt fraction, EELV, and
amount of non-aerated lung between the ventilatory setting
and lung injury groups with the given parallel design at a sig-
nificance level of 5% (α = 0.05) with a probability of 80% (β =
0.20) based on an estimated difference of 0.62 of the mean
standard deviation (SD) of the parameter, the number of ani-
mals to be studied is at least 40. Results are expressed as
mean ± SD, and all analyses were performed using a statistical
software package (Statistica for Windows 6.0; StatSoft, Inc.,
Tulsa, OK, USA). Data were tested for normal distribution by
the Shapiro-Wilks W test and analyzed by a two-way analysis
of variance for repeated measurements with factors 'mode'
and 'time'. When a significant F ratio was obtained, differences
between the means were isolated for the specific factor (and
for all factors in case of significant interaction) with the post
hoc Tukey multiple comparison test. Differences were consid-
ered to be statistically significant for P values of less than 0.05.
Results
Lung injury
Induction of ALI led to a comparable and severe hypoxemia
with PaO
2
/FiO
2
below 200 mm Hg in 38 out of 40 animals in
both HCl-ALI and OA-ALI (Table S1 in Additional data file 1).
As expected by the study design, in the HCl group, respiratory
system compliance was decreased mainly by decreased lung
compliance, and, in OA-ALI, due to decreased chest wall com-
pliance associated with increased abdominal pressure (Table
1). Thus, in HCl-ALI, mean transpulmonary airway pressure
(P
transp, mean
) was higher at all times after induction of ALI (P <
0.05), and the dynamic intrinsic PEEP (PEEP
I, dyn
) was not
influenced by the type of injury (Table 1). In both models, RR
and airway pressures (Table 1) had to be increased to main-
tain alveolar ventilation (minute ventilation [V
E
]) after ALI induc-
tion. In the OA group, EELV and longitudinal lung dimensions
(distances of apex – dome and apex – costodiaphragmatic
recessus) were significantly smaller than in the HCl group (P
< 0.05, Table S4 in Additional data file 1). In HCl-ALI, shunt
decreased after 4 hours of treatment (P < 0.05, Table 2),
whereas dead space ventilation ( → ∞) increased irre-
spective of ALI type and ventilatory mode (P < 0.05, effect
time).
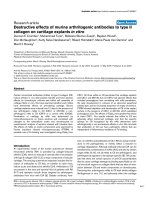
For both types of ALI, the CT scans showed a gravity-depend-
ent distribution of non-aerated tissue, predominantly in the
dorsal areas (P < 0.05), and the aerated tissue found in the
ventral parts of the lung (P < 0.05) (Figure 2). This effect is
more pronounced in the juxtadiaphragmatic lung regions (P <
0.05) compared with the apical parts of the lung and is not
dependent on the ALI type. The shunt fraction determined with
the MIGET correlates with the amount of non-aerated lung tis-
sue observed in the spiral CT scans (HCl-ALI: y = 0.85 x -
0.02, R
2
= 0.58; OA-ALI: y = 1.19 x - 0.03, R
2
= 0.84). In HCl-
generated ALI, however, the amount of non-aerated tissue is
increased in the right region of interest (ROI) (P < 0.05),
whereas an increase in aeration is found in the left ROI (P <
0.05). The SD of non-aerated tissue (SD
atelect
) and the fraction
of non-aerated tissue per ROI (SD%
atelect
) over all slices of the
spiral scans did not differ between the two models of ALI
(SD
atelect
: 4.3 versus 3.9; SD%
atelect
: 0.13 versus 0.13, for
HCl-induced versus OA-induced ALI).
Pressure-controlled ventilation without spontaneous
breathing
In PCV – SB, PaO
2
/FiO
2
deteriorated significantly (P < 0.05
for interaction of time and ventilatory mode) (Table 2). CT
scans showed a greater fraction of non-aerated tissue in this
group (P < 0.05, Figure 2). V
T
decreased slightly as compared
with baseline ALI (P < 0.05), whereas PaCO
2
increased (P <
0.05) despite higher mean airway (P
aw, mean
) and transpulmo-
nary (P
transp, mean
) pressures (P < 0.05) (Table 1). CO
increased during the 4-hour treatment period in this group (P
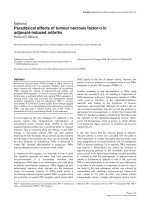
< 0.05) (Table 2), and a marked increase in blood flow to
shunt regions ( = 0) (P < 0.05, Table 2) with a reduction
in blood flow to regions with a normal (0.1 < <
10) was observed (Figure 3).
VQ
A
VQ
A
VQ
A
VQ
A
VQ
A
Critical Care Vol 12 No 6 Varelmann et al.
Page 4 of 13
(page number not for citation purposes)
Pressure-controlled ventilation with spontaneous
breathing
PCV + SB improved PaO
2
/FiO
2
during 4 hours of treatment (P
< 0.05, interaction time course and ventilatory mode, Table 2).
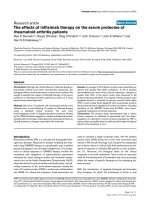
Overall lung density was lower compared with PCV – SB (P <
0.05); accordingly, the fraction of normally aerated tissue was
higher in the PCV + SB group (P < 0.05) (Figure 4). The EELV
and longitudinal lung dimensions were greater during SB com-
pared with the PCV – SB group (P < 0.05). These effects
were independent of the ALI type, with EELV and longitudinal
dimensions always greater in HCl-ALI. SB led to an increase
in RR (P < 0.05) with a concomitant decrease in VT (P < 0.05)
and increases in V
E
and PaCO
2
. The increase in PaCO
2
, how-
ever, was lower as compared with PCV – SB (P < 0.05, Table
1). The V
T
of spontaneous breaths was lower in the OA-ALI
group. The increases in P
aw, mean
and P
transp, mean
(P < 0.05)
were comparable with the increases in the PCV – SB group,
PEEP was comparable in the two groups, and PEEP
I, dyn
was
not significantly different between the two groups and was
less than 1 cm H
2
O. Blood flow to low compartments
Figure 1
Flowchart of the study protocolFlowchart of the study protocol. The grey boxes represent the measurement points. ALI, acute lung injury; CT, computed tomography; HCl, hydro-
chloric acid; HCl-ALI, hydrochloric acid-induced acute lung injury; IAP, intra-abdominal pressure; IV, intravenous; MIGET, multiple inert gas elimina-
tion technique; OA-ALI, oleic acid-induced acute lung injury (combined with an increased intra-abdominal pressure); PCV + SB, pressure-controlled
ventilation with spontaneous breathing; PCV – SB, pressure-controlled ventilation without spontaneous breathing.
VQ
A
Available online />Page 5 of 13
(page number not for citation purposes)
Table 1
Ventilation and respiratory system mechanics
SB Baseline ALI Treatment Lung injury Time Injury type Mode Inter-action
RR, breaths per minute HCl + 28.2 ± 3.4 45.3 ± 8.5
ba a a
- 28.4 ± 2.8 28.3 ± 3.2
c
OA + 29.2 ± 0.1 43.5 ± 6.7
b
- 29.1 ± 1.8 29.2 ± 1.7
c
V
T
, mL HCl + 326 ± 46 212 ± 28
b
- 303 ± 23 272 ± 20
baa a
TM
a
OA + 317 ± 41 190 ± 19
b
- 285 ± 52 260 ± 31
b
V
T, sb
, mL HCl + n/a 135 ± 20
a
-n/a n/a
OA + n/a 95 ± 19
d
-n/a n/a
V
E
, liters HCl + 8.8 ± 1.1 8.6 ± 1.5
aa a
-8.5 ± 0.9
c
7.6 ± 1.1
c
OA + 9.1 ± 1.2 7.7 ± 1.2
-8.0 ± 1.0
c
7.4 ± 0.6
c
PaCO
2
, mm Hg HCl + 40 ± 6 45 ± 9
aa a
TM
a
- 42 ± 9 54 ± 13
c
OA + 41 ± 9 43 ± 10
- 46 ± 10 54 ± 17
c
P
transp, mean
, mbar HCl + 5.5 ± 3.0 5.5 ± 4.6
aaa
- 6.8 ± 3.3 8.1 ± 3.4
OA + 2.1 ± 3.0 2.7 ± 3.4
- 0.5 ± 3.2 3.1 ± 3.5
PEEP
I, dyn
, mbar HCl + 0.0 ± 1.1 0.3 ± 0.3
- 0.7 ± 0.6 0.9 ± 0.9
OA + 0.0 ± 1.6 0.8 ± 0.5
- 0.3 ± 0.3 0.0 ± 1.6
C
cw
, mL/mbar HCl + 89.3 ± 39.3 n/a
a
- 96.8 ± 34.9 115.5 ± 64.3
OA + 40.9 ± 14.8
d
n/a
- 39.3 ± 11.2
d
49.5 ± 27.6
d
C
lung
, mL/mbar HCl + 19.5 ± 4.0 n/a
aa
- 16.4 ± 8.4 13.5 ± 2.8
OA + 21.3 ± 4.7
d
n/a
- 21.7 ± 8.3
d
16.2 ± 7.9
d
R, mbar/L per second HCl + 7.0 ± 0.7
b
n/a
aa
-7.5 ± 1.6
b
8.5 ± 2.8
Critical Care Vol 12 No 6 Varelmann et al.
Page 6 of 13
(page number not for citation purposes)
(0.005 < < 0.1) increased during PCV + SB in the HCl
group only (P < 0.001, Table S5 in Additional data file 1). In
both groups, PCV – SB and PCV + SB, the HR and mean
arterial pressure (MAP) increased during the 4-hour treatment
period (P < 0.05), whereas central venous pressure (CVP)
and systemic vascular resistance (SVR) dropped (P < 0.05,
Table 2), and pulmonary artery occlusion pressure (PAOP)
and ITBV remained unchanged (Table S3 in Additional data
file 1).
Discussion
Our data confirm previous findings that SB during PCV leads
to an improvement in oxygenation through the reduction in
shunt and restoration of aeration in previously non-aerated
lung regions. These effects are not influenced by the type of
ALI/ARDS studied here.
Lung injury
Although one should be careful in drawing conclusions from
findings in animal models for treatment of patients with ARDS,
our different lung injury types mimic relevant aspects of the
clinical situation. HCl aspiration damaged the alveolar epithe-
lium and increased lung elastance usually due to alveolar
flooding and collapse, reduced removal of edema fluid, and
reduced production of surfactant [4,21-23]. Commonly, HCl-
induced ALI is regarded as a form of direct ALI. OA injection
combined with abdominal hypertension [1] causes damage to
the vascular endothelium, resulting in increased chest wall
elastance usually associated with microvascular congestion,
interstitial edema, and recruitment of inflammatory cells,
whereas the intra-alveolar spaces are spared [24], mimicking
indirect ALI. Although OA exhibits direct toxicity to endothelial
cells [25], the elicited lung injury might not be similar to ALI
caused by sepsis. However, OA generates a reproducible
injury within a reasonable time frame.
According to our knowledge, the differences of direct and indi-
rect ALI/ARDS have been described qualitatively only, reveal-
ing a heterogeneous distribution pattern (for example, 'patchy
pattern') of normal lung, regions with ground-glass opacity,
and consolidated areas. In the current literature, different dis-
tribution patterns of inhomogeneities are described
[2,5,26,27]. We attempted to quantify the heterogeneities by
determining the SD of density distributions in eight ROIs per
transverse slide assessed with spiral CT scans. However, this
approach did not reveal any quantitative differences and the
authors were not able to distinguish the type of injury by visual
inspection in a significant number of animals. This suggests
either that there are no morphological differences between
these models of ALI or that the differences are too small to be
detected with the used CT technique. Desai and colleagues
[8] were not able to describe a single CT feature to predict
whether ARDS in humans is of direct or indirect origin. These
findings suggest that both injury types result in interstitial pul-
monary edema as a common final path. The greater amount of
injury in the right lungs in HCl-induced ALI is well known from
aspiration pneumonia.
The additional fluid volume infused into the abdominal cavity in
the OA group influences hemodynamic parameters; MAP was
higher in the OA group (P < 0.05, effect injury type) as an
effect of an increased SVR (P < 0.05, effect injury type; Table
2), and CO was not different between the injury models. How-
ever, the ITBV was not significantly different between OA-
induced and HCl-induced ALI (Table W3 in Additional data file
1), and on average very little normal saline had to be replaced
for maintaining IAP ( < 100 mL), thus effects other than intra-
vascular shifting of intraperitoneal fluid might account for this.
The rationale to investigate the effects of SB in two different
ALI models was that they might differ in their potential for
recruitment [1,28,29]. Recruitment maneuvers differ in their
OA + 8.5 ± 1.0
b
n/a
-9.0 ± 3.0
b
11.9 ± 2.7
EELV, mL HCl + 606 ± 171
aa
- 372 ± 130
c
OA + 439 ± 90
d
- 192 ± 51
c, d
Pre-acute lung injury (ALI) (Table S2 in additional data file 1) was tested only against baseline ALI. Post hoc testing was always performed if a
significant F ratio for a factor or the interaction of factors was obtained by repeated measures analysis of variance (
a
P < 0.05), but only significant
differences are marked:
b
P < 0.05 for within-group differences (ALI versus Treatment),
c
P < 0.05 for between-group differences (PCV + SB
versus PCV – SB), and
d
P < 0.05 for between-group differences (HCl-ALI versus OA-ALI) (post hoc Tukey multiple comparison test). +, pressure-
controlled ventilation with maintained spontaneous breathing; -, pressure-controlled ventilation without spontaneous breathing; C
cw
, chest wall
compliance; C
lung
, lung compliance; EELV, end-expiratory lung volume; HCl, hydrochloric acid-induced acute lung injury; M, mode; n/a, not
applicable; OA, oleic acid-induced acute lung injury; PaCO
2
, arterial partial pressure of carbon dioxide; PCV + SB, pressure-controlled ventilation
with spontaneous breathing; PCV – SB, pressure-controlled ventilation without spontaneous breathing; PEEP
I, dyn
, dynamic intrinsic positive end-
expiratory pressure; P
transp, mean
, mean transpulmonary airway pressure; R, respiratory system resistance; RR, respiratory rate; SB, spontaneous
breathing; T, time; V
E
, minute ventilation; V
T
, tidal volume; V
T, sb
, tidal volume of spontaneous breaths.
Table 1 (Continued)
Ventilation and respiratory system mechanics
VQ
A
Available online />Page 7 of 13
(page number not for citation purposes)
Table 2
Oxygenation and hemodynamic parameters
SB BL-ALI Treatment Lung injury Time Injury type Mode Inter-action
PaO
2
/FiO
2
, mm Hg HCl + 132 ± 18 150 ± 50
a
TM
a
- 151 ± 58 137 ± 104
OA + 145 ± 51 184 ± 116
- 146 ± 68 109 ± 46
HR, beats per minute HCl + 96 ± 12 112 ± 11
aa
- 100 ± 22 108 ± 20
OA + 102 ± 11 110 ± 23
- 112 ± 18 119 ± 23
MAP, mm Hg HCl + 79 ± 8 86 ± 9
baa
- 77 ± 23 92 ± 13
b
OA + 93 ± 12
d
97 ± 13
b, d
- 101 ± 10
d
104 ± 15
b, d
CVP, mm Hg HCl + 11 ± 2 10 ± 2
ba
- 12 ± 3 12 ± 2
b
OA + 15 ± 2
d
14 ± 2
b, d
-15 ± 4
d
14 ± 3
b, d
SVR, dyne-second/cm
5
HCl + 1,335 ± 198 1,057 ± 191
ba a a
- 1,255 ± 429 1,072 ± 333
b
OA + 1,513 ± 344 1,281 ± 388
b
- 1,490 ± 384 1,060 ± 206
b
CO, L/minute HCl + 4.1 ± 0.3 4.6 ± 0.8
aa
-4.2 ± 0.9
c
4.8 ± 0.9
c
OA + 4.2 ± 0.7 4.3 ± 0.8
-4.8 ± 0.8
c
5.5 ± 0.7
c
DO
2
, mL/minute HCl + 323 ± 28 393 ± 71
aa
- 336 ± 63 369 ± 89
OA + 335 ± 89 360 ± 48
- 408 ± 80 430 ± 118
VO
2
, mL/minute HCl + 181 ± 31 172 ± 33
aa
- 169 ± 23 172 ± 32
OA + 159 ± 27
c
147 ± 34
c
- 154 ± 32
c
167 ± 42
c
Shunt < 0.005, %Q
T
HCl + 27.1 ± 6.2 23.3 ± 12.7
a
TM
a
- 27.7 ± 7.9 37.4 ± 17.4
b
OA + 32.6 ± 18.9 26.0 ± 17.9
- 32.4 ± 12.4 47.2 ± 17.1
b
Dead space > 100, %Ve
HCl + 33.0 ± 5.5 45.1 ± 11.8
a
VQ
A
VQ
A
Critical Care Vol 12 No 6 Varelmann et al.
Page 8 of 13
(page number not for citation purposes)
effect on oxygenation and lung mechanics in an animal model
of intratracheal and intraperitoneal lipopolysaccharide injec-
tions, with recruitment maneuvers being more effective in ani-
mals with intraperitoneally injected lipopolysaccharide [29].
Recent data, however, challenged this concept: a multicenter
CT study in 68 patients with ALI or ARDS was unable to
detect any difference in alveolar recruitment potential depend-
ing on the type of ALI, but huge individual differences were
detected [30]. A recent study found the volume recruited by
different levels of PEEP (10 and 14 cm H
2
O) in patients with
direct and indirect ARDS to be similar, but classification of
ARDS was uncertain in more than one third (37%) of patients
[31]. The PEEP used in this study was considerably low and
might not have prevented atelectasis formation. The aim of this
study, however, was to study the effects of SB in different ALI
models and not the effects of other recruitment strategies
such as recruitment maneuvers or high PEEP. Intrinsic PEEP
was below 1 cm H
2
O in all situations and therefore was not
considered clinically significant. The meta-analysis of studies
did not find any differences in outcome in patients with direct
or indirect ALI/ARDS [32]. These recent findings suggest that
differences in alveolar recruitment potential are attributable to
individual differences between patients rather than to the sys-
tematic origin of ALI/ARDS. This is in line with our experimen-
tal findings that beneficial effects of SB on lung recruitment do
not depend on the origin of ALI/ARDS.
Effects of spontaneous breathing on respiratory
variables
PCV + SB resulted in a higher EELV, greater lung dimensions,
and less non-aerated tissue (Figure 4), indicating that SB pre-
vents a loss of aeration. During SB, the posterior muscular
sections of the diaphragm move more than the anterior tendon
plate [17] and ventilation is shifted to the dependent lung
regions [33], thereby counteracting atelectasis formation and
resulting in improvement in matching [14,16]. The find-
ing that EELV was lower in OA-induced ALI can be explained
by the elevated IAP and, as a consequence, a cranial displace-
ment of the diaphragm with compression atelectasis or con-
solidation of the juxtadiaphramatic lung regions [34,35].
V
T
tended to be smaller when SB was maintained. This is a
consequence of the unsupported spontaneous breaths, which
occurred on the lower pressure level only. The spontaneous V
T
(V
Tsb
) was lower in the OA group due to the more cranially dis-
placed diaphragm compared with the HCl group. As sponta-
neous breaths coincided with mechanical breaths delivered by
the ventilator, it is difficult to determine the V
T
solely generated
by ventilator. With the high spontaneous RR on the lower pres-
sure level, plausible 'ventilator V
T
' could not be calculated.
The good correlation of the shunt fraction determined with the
MIGET with the amount of non-aerated lung tissue observed
in the spiral CT scans has already been shown by others [5].
This suggests that loss of aeration (also indicated by the
reduction in EELV) was the main reason for the shunt fraction
and that the prevention of this loss of aeration in these lung
areas by SB contributed to the improvement in oxygenation,
regardless of ALI type. This is in agreement with previous stud-
ies reporting a reduction in intrapulmonary shunting in PCV
with SB [10,12,16,36,37]. Intrapulmonary shunt in ARDS/ALI
has been found to correlate directly with the quantity of non-
aerated tissue in dependent lung regions [5,14,38]. In HCl-
induced ALI with maintained SB, the blood flow to low
(0.005 < < 0.1) was significantly higher than in HCl-ALI
without SB and in OA-ALI with and without SB. HCl instillation
led to alveolar flooding and collapse, and the physiologic
response is to divert blood flow away from non-ventilated
regions (hypoxic pulmonary vasoconstriction). PCV + SB in
HCl-induced ALI might have restored ventilation in those
regions and might have led to an increase in perfused low
areas that participate in gas exchange. The effects of
low on blood oxygenation, however, will depend on
FiO
2
. With low FiO
2
, low regions contribute to impaired
- 34.4 ± 5.9 38.7 ± 3.9
OA + 39.1 ± 6.6 44.9 ± 12.8
- 39.0 ± 6.0 46.2 ± 12.2
Pre-acute lung injury (ALI) (Table S1 in additional data file) was tested only against baseline ALI (BL-ALI). Post hoc testing was always performed
if a significant F ratio for a factor or the interaction of factors was obtained by repeated measures analysis of variance (
a
P < 0.05), but only
significant differences are marked:
b
P < 0.05 for within-group differences (BL-ALI versus Treatment),
c
P < 0.05 for between-group differences
(HCl-ALI versus OA-ALI), and
d
P < 0.05 for between-group differences (PCV + SB versus PCV – SB) (post hoc Tukey multiple comparison test).
+, pressure-controlled ventilation with maintained spontaneous breathing; -, pressure-controlled ventilation without spontaneous breathing; CO,
cardiac output; CVP, central venous pressure; DO
2
, oxygen delivery; HCl, hydrochloric acid-induced acute lung injury; HCl-ALI, hydrochloric acid-
induced acute lung injury; HR, heart rate; M, mode; MAP, mean arterial pressure; OA, oleic acid-induced acute lung injury; OA-ALI, oleic acid-
induced acute lung injury; PaO
2
/FiO
2
, arterial partial pressure of oxygen/inspiratory fraction of oxygen; PCV + SB, pressure-controlled ventilation
with spontaneous breathing; PCV – SB, pressure-controlled ventilation without spontaneous breathing; %Q
T
, percentage of cardiac output; SB,
spontaneous breathing; SVR, systemic vascular resistance; T, time; , ventilation/perfusion (ratio); %Ve, percentage of minute ventilation;
VO
2
, oxygen consumption.
Table 2 (Continued)
Oxygenation and hemodynamic parameters
VQ
A
VQ
A
VQ
A
VQ
A
VQ
A
VQ
A
VQ
A
Available online />Page 9 of 13
(page number not for citation purposes)
oxygenation, but at high FiO
2
there will be no substantial
effect. High FiO
2
will more easily cause collapse (atelectasis)
of the low regions. The deterioration in oxygenation in
the PCV – SB group can be explained by the reduced blood
flow to normal (0.1 < < 10) and the concomitant
increase in shunt after 4 hours of treatment. The greater dis-
persion of blood flow (logSD
Q
) in HCl-induced lung injury after
4 hours of treatment might indicate damage that is more
severe [39]. However, this does not translate into a greater
deterioration of oxygenation. SB, on the other hand, had no
effect on the dispersion of ventilation distribution. Thus, impair-
ments in oxygenation in the PCV – SB group are caused by
the increase in shunt. All animals showed a unimodal distribu-
tion of perfusion and ventilation, and the residual sum of
squares (RSS) was exceptionally low, indicating adequate
MIGET data [39].
Effects of spontaneous breathing on hemodynamic
parameters
In contrast to previously published data [10-13,16,36,37], we
observed an increase in CO during PCV – SB over the 4-hour
treatment period. An animal study found less depression of
CO and oxygen delivery (DO
2
) with PCV + SB compared with
PCV at similar transpulmonary pressures [40]. In our study, the
CO during PCV + SB and PCV – SB was comparable to pre-
viously published studies [12,16]., and the more pronounced
increase in the PCV – SB group does not lead to a significant
Figure 2
Distribution of fractions of non-aerated and aerated tissue in end-expiratory spiral computed tomography scansDistribution of fractions of non-aerated and aerated tissue in end-expiratory spiral computed tomography scans. Filled bars indicate oleic acid-
induced acute lung injury (ALI), and outlined bars indicate hydrochloric acid-induced ALI. Fractions of densities are presented as mean ± standard
error of the mean. *P < 0.05: ventral versus dorsal, analysis of variance (ANOVA).
+
P < 0.05: interaction of ventral-dorsal and apical-diaphragmatic
distribution, ANOVA.
#
P < 0.05: interaction injury and left-right distribution.
&
P < 0.05: left versus right in juxtadiaphragmatic regions for hydrochloric
acid-induced ALI, Tukey's honest significant differences (HSD).
§
P < 0.05: apex versus diaphragm for corresponding region of interest (ROI),
Tukey's HSD.
$
P < 0.05: left versus right for corresponding ROI, Tukey's HSD.
VQ
A
VQ
A
VQ
A
Critical Care Vol 12 No 6 Varelmann et al.
Page 10 of 13
(page number not for citation purposes)
Figure 3
Ventilation/perfusion distributionsVentilation/perfusion distributions. Continuous distributions of ventilation and blood flow (mean ± standard error of the mean) plotted versus ventila-
tion/perfusion ratio ( ). BL indicates baseline measurement after induction of stable acute lung injury, and treatment indicates measurement
after 4 hours of pressure-controlled ventilation (PCV) either with (+ SB) or without (- SB) spontaneous breathing. HCl-ALI, hydrochloric acid-
induced acute lung injury; OA-ALI, oleic acid-induced acute lung injury; V
DS
, deadspace ventilation.
VQ
A
Available online />Page 11 of 13
(page number not for citation purposes)
increase in DO
2
. This suggests that the higher CO was
required to maintain an adequate DO
2
. Linear regression anal-
ysis revealed a reasonable inverse correlation between PaO
2
/
FiO
2
and CO during PCV + SB (r
2
= 0.42, P < 0.05) after the
4-hour treatment period compared with r
2
= 0.23 (P < 0.05) in
the PCV – SB group. The change in CO is positively corre-
lated with the increase in intrapulmonary shunt (r
2
= 0.36),
which is in line with previously conducted studies [41]. How-
ever, as the time frame of our experiments was relatively short,
one has to be careful to extrapolate the results on patients with
impaired CO due to, for example, septic cardiomyopathy. The
increase in CO after 4 hours of treatment in the controlled
mechanical ventilation group might also be explained by the
increased PaCO
2
and the lower pH; also, the latter was not
statistically significant. In the OA group subjected to control-
led mechanical ventilation, the drop in SVR is especially pro-
nounced, which might explain the highest CO in this group.
The ITBV indicates comparable volume status. However, the
CVP and the MAP were higher in the indirect ALI group, most
likely due to elevated IAP [7,42,43]. The mode of ventilation
did not influence oxygen consumption (VO
2
), which is in line
with previous observations [10,14], whereas VO
2
was signifi-
cantly lower in the OA-induced ALI group, most likely as a con-
sequence of impaired organ perfusion due to increased
abdominal pressure.
In this study, we used time-cycled PCV with suppression of
SB compared with PCV with maintained SB (also termed air-
way pressure release ventilation [APRV] or biphasic positive
airway pressure [bi-level]). Currently, a number of ventilatory
modes supporting SB are available and have been used in ani-
mal models of ALI. Noisy pressure support ventilation
improved oxygenation and reduced venous admixture at a
lower P
aw, mean
compared with PCV in a model of surfactant
depletion [44]. On comparing PCV with different modes of
assisted SB (biphasic positive airway pressure, pressure-con-
trolled assisted ventilation, and pressure support ventilation) in
a saline lavage animal model, assisted SB was found to be
superior to PCV in terms of oxygenation and hemodynamic
parameters [45]. The transpulmonary pressure was different in
our groups as a result of the increased IAP in the OA group
and the comparable PEEP in both groups. Increasing the
PEEP to match the groups for transpulmonary pressure could
have influenced the results, but this was beyond our scope to
investigate the effects of SB. Although several studies
reported beneficial effects of SB in ALI, we were able to show
that PCV with maintained SB has positive effects regardless
of the model of ALI used in our study.
Conclusion
Although the different origin of the ALI results in different res-
piratory mechanics, EELV, hemodynamic parameters, and
shunt fraction, PCV with SB improved oxygenation, reduced
shunt fraction, and restored EELV in both types of ALI.
Competing interests
The authors declare that they have no competing interests.
Authors' contributions
DV participated in the design and coordination of the study,
performed measurements, and wrote the manuscript. TM per-
formed the CT analysis, participated in the study design, and
helped draft the manuscript. JZ participated in the design of
the study and performed measurements and the statistical
analysis. UG analyzed data and helped draft the manuscript.
AM participated in the study design and coordination and
organized the CT measurements. GH participated in the
Figure 4
Density distributionsDensity distributions. Density histograms taken from end-expiratory spi-
ral computed tomography of all animals show normalized lung volume
in Hounsfield units (HU) ranging from -1,000 to 100 plotted as mean ±
standard error of the mean. Aeration categories (hyperinflated, normally
aerated, poorly aerated, and non-aerated) are marked and were statisti-
cally compared (see Results and Discussion sections of the text for
details) between pressure-controlled ventilation with (PCV + SB) and
without (PCV – SB) spontaneous breathing. There were no significant
differences caused by the type of acute lung injury. HCl-ALI, hydrochlo-
ric acid-induced acute lung injury; n/s, not significant; OA-A.
Critical Care Vol 12 No 6 Varelmann et al.
Page 12 of 13
(page number not for citation purposes)
design and coordination of the study and revised the manu-
script. CP participated in the design and coordination of the
study and helped draft the manuscript. HW designed and
coordinated the study, performed measurements, and helped
draft the manuscript. All authors edited and approved the final
version of the manuscript.
Additional files
Acknowledgements
We thank Eva-Maria Hedin, Anne Abrahamson, and Agneta Roneus, all
technicians at the Department of Clinical Physiology, and the x-ray labo-
ratory team (Marianne Almgren, Ann Erikson, and Ewa Larsson, all tech-
nicians at the Department of Radiology) of the University of Uppsala,
Sweden, for skillful technical help. We are grateful to Marco Strohm, of
the Department of Anesthesiology and Surgical Intensive Care, Medical
Center Cologne-Merheim, Germany, for his assistance with CT
evaluations.
References
1. Gattinoni L, Pelosi P, Suter PM, Pedoto A, Vercesi P, Lissoni A:
Acute respiratory distress syndrome caused by pulmonary
and extrapulmonary disease. Different syndromes? Am J
Respir Crit Care Med 1998, 158:3-11.
2. Pelosi P, D'Onofrio D, Chiumello D, Paolo S, Chiara G, Capelozzi
VL, Barbas CS, Chiaranda M, Gattinoni L: Pulmonary and
extrapulmonary acute respiratory distress syndrome are
different. Eur Respir J Suppl 2003, 42:48s-56s.
3. Wrigge H, Zinserling J, Muders T, Varelmann D, Gunther U, Groe-
ben C von der, Magnusson A, Hedenstierna G, Putensen C: Elec-
trical impedance tomography compared with thoracic
computed tomography during a slow inflation maneuver in
experimental models of lung injury. Crit Care Med 2008,
36:903-909.
4. Hoelz C, Negri EM, Lichtenfels AJ, Concecao GM, Barbas CS,
Saldiva PH, Capelozzi VL: Morphometric differences in pulmo-
nary lesions in primary and secondary ARDS. A preliminary
study in autopsies. Pathol Res Pract 2001, 197:521-530.
5. Goodman LR, Fumagalli R, Tagliabue P, Tagliabue M, Ferrario M,
Gattinoni L, Pesenti A: Adult respiratory distress syndrome due
to pulmonary and extrapulmonary causes: CT, clinical, and
functional correlations. Radiology 1999, 213:545-552.
6. Ranieri VM, Brienza N, Santostasi S, Puntillo F, Mascia L, Vitale N,
Giuliani R, Memeo V, Bruno F, Fiore T, Brienza A, Slutsky AS:
Impairment of lung and chest wall mechanics in patients with
acute respiratory distress syndrome: role of abdominal
distension. Am J Respir Crit Care Med 1997, 156:1082-1091.
7. Quintel M, Pelosi P, Caironi P, Meinhardt JP, Luecke T, Herrmann
P, Taccone P, Rylander C, Valenza F, Carlesso E, Gattinoni L: An
increase of abdominal pressure increases pulmonary edema
in oleic acid-induced lung injury. Am J Respir Crit Care Med
2004, 169:534-541.
8. Desai SR, Wells AU, Suntharalingam G, Rubens MB, Evans TW,
Hansell DM: Acute respiratory distress syndrome caused by
pulmonary and extrapulmonary injury: a comparative CT study.
Radiology 2001, 218:689-693.
9. Rouby JJ, Puybasset L, Nieszkowska A, Lu Q: Acute respiratory
distress syndrome: lessons from computed tomography of
the whole lung. Crit Care Med 2003, 31:S285-S295.
10. Sydow M, Burchardi H, Ephraim E, Zielmann S: Long-term effects
of two different ventilatory modes on oxygenation in acute
lung injury. Comparison of airway pressure release ventilation
and volume-controlled inverse ratio ventilation. Am J Respir
Crit Care Med 1994, 149:1550-1556.
11. Putensen C, Zech S, Wrigge H, Zinserling J, Stuber F, von Spiegel
T, Mutz N: Long-term effects of spontaneous breathing during
ventilatory support in patients with acute lung injury. Am J
Respir Crit Care Med 2001, 164:43-49.
12. Wrigge H, Zinserling J, Neumann P, Defosse J, Magnusson A,
Putensen C, Hedenstierna G: Spontaneous breathing improves
lung aeration in oleic acid-induced lung injury. Anesthesiology
2003, 99:376-384.
13. Wrigge H, Zinserling J, Neumann P, Muders T, Magnusson A,
Putensen C, Hedenstierna G: Spontaneous breathing with air-
way pressure release ventilation favors ventilation in depend-
ent lung regions and counters cyclic alveolar collapse in oleic-
acid-induced lung injury: a randomized controlled computed
tomography trial. Crit Care 2005, 9:R780-R789.
14. Putensen C, Mutz NJ, Putensen-Himmer G, Zinserling J: Sponta-
neous breathing during ventilatory support improves ventila-
tion- perfusion distributions in patients with acute respiratory
distress syndrome. Am J Respir Crit Care Med 1999,
159:1241-1248.
15. Rehder K, Sessler AD, Rodarte JR: Regional intrapulmonary gas
distribution in awake and anesthetized-paralyzed man. J Appl
Physiol 1977, 42:391-402.
16. Neumann P, Wrigge H, Zinserling J, Hinz J, Maripuu E, Andersson
LG, Putensen C, Hedenstierna G: Spontaneous breathing
affects the spatial ventilation and perfusion distribution during
mechanical ventilatory support. Crit Care Med 2005,
33:1090-1095.
17. Froese AB, Bryan AC: Effects of anesthesia and paralysis on
diaphragmatic mechanics in man. Anesthesiology 1974,
41:242-255.
18. Reber A, Nylund U, Hedenstierna G: Position and shape of the
diaphragm: implications for atelectasis formation. Anaesthesia
1998, 53:1054-1061.
19. Neumann P, Berglund JE, Andersson LG, Maripu E, Magnusson A,
Hedenstierna G: Effects of inverse ratio ventilation and positive
end-expiratory pressure in oleic acid-induced lung injury. Am
J Respir Crit Care Med 2000, 161:1537-1545.
20. Wagner PD, Saltzman HA, West JB: Measurement of continu-
ous distributions of ventilation-perfusion ratios: theory. J Appl
Physiol 1974, 36:588-599.
Key messages
• In pigs with different types of experimental acute lung
injury, spontaneous breathing during airway pressure
release ventilation leads to an improvement in oxygena-
tion by a reduction in shunt fraction.
• Spontaneous breathing during pressure-controlled ven-
tilation restores aeration in previously non-aerated lung
regions, independently of the type of lung injury.
• The cardiac output during pressure-controlled ventila-
tion with suppressed spontaneous breathing is higher
than with maintained spontaneous breathing, and oxy-
gen delivery is unaffected.
The following Additional files are available online:
Additional data file 1
A Microsoft Word document giving a detailed
description of the methods used for preparation of the
animals, determination of ventilation-perfusion ratios, as
well as analyses of computed tomography scans.
Furthermore, tables providing additional data on
oxygenation, respiratory system mechanics, and
hemodynamic parameters are presented in this data file.
See />supplementary/cc7108-S1.doc
Available online />Page 13 of 13
(page number not for citation purposes)
21. Wiener-Kronish JP, Albertine KH, Matthay MA: Differential
responses of the endothelial and epithelial barriers of the lung
in sheep to Escherichia coli endotoxin. J Clin Invest 1991,
88:864-875.
22. Modelska K, Pittet JF, Folkesson HG, Courtney BV, Matthay MA:
Acid-induced lung injury. Protective effect of anti-interleukin-8
pretreatment on alveolar epithelial barrier function in rabbits.
Am J Respir Crit Care Med 1999, 160:1450-1456.
23. Bitterman PB: Pathogenesis of fibrosis in acute lung injury. Am
J Med 1992, 92:39S-43S.
24. Pelosi P: What about primary and secondary ARDS. Minerva
Anestesiol 2000, 66:779-785. discussion 785–786.
25. Julien M, Hoeffel JM, Flick MR: Oleic acid lung injury in sheep. J
Appl Physiol 1986, 60:433-440.
26. Kim HY, Lee KS, Kang EH, Suh GY, Kwon OJ, Chung MJ: Acute
respiratory distress syndrome. Computed tomography find-
ings and their applications to mechanical ventilation therapy.
J Comput Assist Tomogr 2004, 28:686-696.
27. Gattinoni L, Caironi P, Pelosi P, Goodman LR: What has com-
puted tomography taught us about the acute respiratory dis-
tress syndrome? Am J Respir Crit Care Med 2001,
164:1701-1711.
28. Pelosi P, Cadringher P, Bottino N, Panigada M, Carrieri F, Riva E,
Lissoni A, Gattinoni L: Sigh in acute respiratory distress
syndrome. Am J Respir Crit Care Med 1999, 159:872-880.
29. Riva DR, Oliveira MB, Rzezinski AF, Rangel G, Capelozzi VL, Zin
WA, Morales MM, Pelosi P, Rocco PR: Recruitment maneuver in
pulmonary and extrapulmonary experimental acute lung
injury. Crit Care Med 2008, 36:1900-1908.
30. Gattinoni L, Caironi P, Cressoni M, Chiumello D, Ranieri VM, Quin-
tel M, Russo S, Patroniti N, Cornejo R, Bugedo G: Lung recruit-
ment in patients with the acute respiratory distress syndrome.
N Engl J Med 2006, 354:1775-1786.
31. Thille AW, Richard JC, Maggiore SM, Ranieri VM, Brochard L:
Alveolar recruitment in pulmonary and extrapulmonary acute
respiratory distress syndrome: comparison using pressure-
volume curve or static compliance. Anesthesiology 2007,
106:212-217.
32. Rubenfeld GD, Herridge MS: Epidemiology and outcomes of
acute lung injury. Chest 2007, 131:554-562.
33. Dellinger RP, Jean S, Cinel I, Tay C, Rajanala S, Glickman YA, Par-
rillo JE: Regional distribution of acoustic-based lung vibration
as a function of mechanical ventilation mode. Crit Care 2007,
11:R26.
34. Andersson LE, Baath M, Thorne A, Aspelin P, Odeberg-Werner-
man S: Effect of carbon dioxide pneumoperitoneum on devel-
opment of atelectasis during anesthesia, examined by spiral
computed tomography. Anesthesiology 2005, 102:293-299.
35. Puybasset L, Cluzel P, Chao N, Slutsky AS, Coriat P, Rouby JJ: A
computed tomography scan assessment of regional lung vol-
ume in acute lung injury. The CT Scan ARDS Study Group. Am
J Respir Crit Care Med 1998, 158:1644-1655.
36. Putensen C, Rasanen J, Lopez FA, Downs JB: Effect of interfac-
ing between spontaneous breathing and mechanical cycles on
the ventilation-perfusion distribution in canine lung injury.
Anesthesiology 1994, 81:921-930.
37. Putensen C, Rasanen J, Lopez FA: Ventilation-perfusion distri-
butions during mechanical ventilation with superimposed
spontaneous breathing in canine lung injury. Am J Respir Crit
Care Med 1994, 150:101-108.
38. Dantzker DR, Brook CJ, Dehart P, Lynch JP: Ventilation-perfusion
distributions in the adult respiratory distress syndrome. Am
Rev Respir Dis 1979, 120:1039-1052.
39. Roca J, Wagner PD: Contribution of multiple inert gas elimina-
tion technique to pulmonary medicine. 1. Principles and infor-
mation content of the multiple inert gas elimination technique.
Thorax 1994, 49:815-824.
40. Henzler D, Dembinski R, Bensberg R, Hochhausen N, Rossaint R,
Kuhlen R: Ventilation with biphasic positive airway pressure in
experimental lung injury. Influence of transpulmonary pres-
sure on gas exchange and haemodynamics. Intensive Care
Med 2004, 30:935-943.
41. Lynch JP, Mhyre JG, Dantzker DR: Influence of cardiac output on
intrapulmonary shunt. J Appl Physiol 1979, 46:315-321.
42. O'Mara MS, Papasavas PK, Newton ED, Caushaj PF: Modified
separation of parts as an intervention for intraabdominal
hypertension and the abdominal compartment syndrome in a
swine model. Plast Reconstr Surg 2004, 114:1842-1845.
43. Rosenthal RJ, Friedman RL, Chidambaram A, Khan AM, Martz J,
Shi Q, Nussbaum M: Effects of hyperventilation and hypoventi-
lation on PaCO
2
and intracranial pressure during acute eleva-
tions of intraabdominal pressure with CO
2
pneumoperitoneum: large animal observations. J Am Coll
Surg 1998, 187:32-38.
44. Gama de Abreu M, Spieth PM, Pelosi P, Carvalho AR, Walter C,
Schreiber-Ferstl A, Aikele P, Neykova B, Hubler M, Koch T: Noisy
pressure support ventilation: a pilot study on a new assisted
ventilation mode in experimental lung injury. Crit Care Med
2008, 36:818-827.
45. Henzler D, Pelosi P, Bensberg R, Dembinski R, Quintel M, Pielen
V, Rossaint R, Kuhlen R: Effects of partial ventilatory support
modalities on respiratory function in severe hypoxemic lung
injury. Crit Care Med 2006, 34:1738-1745.
46. Baydur A, Behrakis PK, Zin WA, Jaeger M, Milic Emili J: A simple
method for assessing the validity of the esophageal balloon
technique. Am Rev Respir Dis 1982, 126:788-791.
47. Higgs BD, Behrakis PK, Bevan DR, Milic-Emili J: Measurement of
pleural pressure with esophageal balloon in anesthetized
humans. Anesthesiology 1983, 59:340-343.
48. Brunner JX, Wolff G: Pulmonary Function Indices in Critical Care
Patients Heidelberg, Germany: Springer-Verlag; 1988.
49. Iberti TJ, Lieber CE, Benjamin E: Determination of intra-abdom-
inal pressure using a transurethral bladder catheter: clinical
validation of the technique. Anesthesiology 1989, 70:47-50.
50. Gattinoni L, Pesenti A, Bombino M, Baglioni S, Rivolta M, Rossi F,
Rossi G, Fumagalli R, Marcolin R, Mascheroni D, Torresin A: Rela-
tionships between lung computed tomographic density, gas
exchange, and PEEP in acute respiratory failure. Anesthesiol-
ogy 1988, 69:824-832.
51. Lundquist H, Hedenstierna G, Strandberg A, Tokics L, Brismar B:
CT-assessment of dependent lung densities in man during
general anaesthesia. Acta Radiol 1995, 36:626-632.
52. Vieira SR, Puybasset L, Richecoeur J, Lu Q, Cluzel P, Gusman PB,
Coriat P, Rouby JJ: A lung computed tomographic assessment
of positive end-expiratory pressure-induced lung
overdistension. Am J Respir Crit Care Med 1998,
158:1571-1577.
53. Drummond GB: Computed tomography and pulmonary
measurements.
Br J Anaesth 1998, 80:665-671.