Báo cáo y học: "A systematic review on quality indicators for tight glycaemic control in critically ill patients: need for an unambiguous indicator reference subset" pot
Bạn đang xem bản rút gọn của tài liệu. Xem và tải ngay bản đầy đủ của tài liệu tại đây (382.17 KB, 11 trang )
Open Access
Available online />Page 1 of 11
(page number not for citation purposes)
Vol 12 No 6
Research
A systematic review on quality indicators for tight glycaemic
control in critically ill patients: need for an unambiguous indicator
reference subset
Saeid Eslami
1
, Nicolette F de Keizer
1
, Evert de Jonge
2
, Marcus J Schultz
2
and Ameen Abu-Hanna
1
1
Department of Medical Informatics, Academic Medical Center, University of Amsterdam, Meibergdreef, 1105 AZ Amsterdam, The Netherlands
2
Department of Intensive Care, Academic Medical Center, University of Amsterdam, Meibergdreef, 1105 AZ Amsterdam, The Netherlands
Corresponding author: Saeid Eslami,
Received: 26 Aug 2008 Revisions requested: 6 Oct 2008 Revisions received: 14 Oct 2008 Accepted: 11 Nov 2008 Published: 11 Nov 2008
Critical Care 2008, 12:R139 (doi:10.1186/cc7114)
This article is online at: />© 2008 Eslami et al.; licensee BioMed Central Ltd.
This is an open access article distributed under the terms of the Creative Commons Attribution License ( />),
which permits unrestricted use, distribution, and reproduction in any medium, provided the original work is properly cited.
Abstract
Introduction The objectives of this study were to systematically
identify and summarize quality indicators of tight glycaemic
control in critically ill patients, and to inspect the applicability of
their definitions.
Methods We searched in MEDLINE
®
for all studies evaluating
a tight glycaemic control protocol and/or quality of glucose
control that reported original data from a clinical trial or
observational study on critically ill adult patients.
Results Forty-nine studies met the inclusion criteria; 30 different
indicators were extracted and categorized into four
nonorthogonal categories: blood glucose zones (for example,
'hypoglycaemia'); blood glucose levels (for example, 'mean
blood glucose level'); time intervals (for example, 'time to
occurrence of an event'); and protocol characteristics (for
example, 'blood glucose sampling frequency'). Hypoglycaemia-
related indicators were used in 43 out of 49 studies, acting as a
proxy for safety, but they employed many different definitions.
Blood glucose level summaries were used in 41 out of 49
studies, reported as means and/or medians during the study
period or at a certain time point (for example, the morning blood
glucose level or blood glucose level upon starting insulin
therapy). Time spent in the predefined blood glucose level
range, time needed to reach the defined blood glucose level
target, hyperglycaemia-related indicators and protocol-related
indicators were other frequently used indicators. Most indicators
differ in their definitions even when they are meant to measure
the same underlying concept. More importantly, many definitions
are not precise, prohibiting their applicability and hence the
reproducibility and comparability of research results.
Conclusions An unambiguous indicator reference subset is
necessary. The result of this systematic review can be used as
a starting point from which to develop a standard list of well
defined indicators that are associated with clinical outcomes or
that concur with clinicians' subjective views on the quality of the
regulatory process.
Introduction
Hyperglycaemia is frequently encountered in critically ill
patients [1,2]. Even critically ill patients without diabetes
develop hyperglycaemia. Until recently it was common prac-
tice to treat only marked hyperglycaemia in these patients,
because hyperglycaemia was considered to be an adaptive
response to critical illness [3]. Blood glucose control aiming to
achieve normoglycaemia (blood glucose levels of 80 to 110
mg/dl), frequently referred to as 'tight glycaemic control'
(TGC), decreases mortality and morbidity in critically ill
patients [4,5]. It is the lowered blood glucose level (BGL)
rather than the insulin dose that is related to reduced mortality
and morbidity [6]. Attempts at achieving TGC, however, are
not perfect and carry a risk for hypoglycaemia [4,5].
Several observational studies have reported on the quality of
the glucose control process itself. The results and conclusions
of these studies are contradictory [7]. Some show that the pro-
tocol prescribing the control process improves blood glucose
control whereas others do not. Apart from differences in case-
mix and in the associated therapy (for example, steroid ther-
apy), two important issues hamper comparability between
studies. The first impediment is the existing variability in the
intervention's evaluation. The following interpretations, based
BGL: blood glucose level; TGC: tight glycaemic control.
Critical Care Vol 12 No 6 Eslami et al.
Page 2 of 11
(page number not for citation purposes)
on intention and on process, are both possible: the patient is
intended to be treated according to a TGC protocol (for exam-
ple, when a specific intensive care unit is designated an inter-
vention group), independent of actual adherence to the
glucose control protocol; or the characterization of the
patient's blood glucose regulation is evaluated according to
the actual intensity of blood glucose control. The latter inter-
pretation requires agreement on the level of adherence to the
TGC protocol in terms of timing of glucose measurements and
insulin provision to qualify a patient as being on TGC. The sec-
ond impediment concerns the variability in outcome measures;
studies may not use a standard list of well defined indicators
for evaluating the quality of glucose control. Work presented
in this paper concerns this second impediment.
The objective of the present systematic review is to identify
and summarize quality indicators for glucose control in pub-
lished studies of TGC in critically ill patients. It also assesses
the applicability of definitions of quality indicators and organ-
izes the indicators into categories. This review may form a
basis for future developments of a standard list of well defined
indicators that may correlate with clinical outcomes or that
reflect clinicians' intuition regarding the quality of a given reg-
ulatory process.
Materials and methods
We searched for relevant English language articles based on
keywords in title, abstract and MeSH terms, using Ovid
MEDLINE
®
and Ovid MEDLINE
®
In-Process (1950 to 31
December 2007). The final literature search was performed on
31 December 2007.
The following search strategy was used to identify the relevant
articles. In the first stage we searched for 'glucose' and 'insu-
lin'. In the second stage we limited the search using 'critical ill-
ness', 'critical care' or 'intensive care'. The results of these two
stages were combined using the Boolean operator 'and'.
Searching was supplemented by scanning the bibliographies
of the identified articles.
Two reviewers independently examined all titles and abstracts.
Discrepancies between the two reviewers were resolved by
consensus involving a third reviewer. Articles were selected if
they reported original data from a clinical trial or observational
study conducted in critically ill adult patients, and only if one of
their main objectives concerned the evaluation of quality of
TGC, with or without implementing an explicitly specified pro-
tocol. A study was defined as evaluating a TGC protocol if the
(implicit or explicit) protocol implied an upper target range.
Adherence to the protocol did not influence whether the study
was included. Opinion papers, surveys and letters were
excluded. Studies employing glucose-insulin-potassium proto-
cols were excluded because they are not originally designed
to achieve TGC.
From the selected papers, the same two reviewers extracted
data on TGC quality indicators (their definition and applicabil-
ity). A quality indicator was defined as a measurable quantity
of the TGC process that may, alone or in combination with
other quantities, indicate some aspect of its quality. This
includes, for example, mean (or median) BGLs as well as inter-
pretations thereof in terms of counts of hyperglycaemic
events. Discrepancies between the two reviewers were again
resolved by consensus after involving the same third reviewer.
We then attempted to categorize the quality indicators into
coherent categories that capture their essence.
Results
Searching the online databases yielded 486 articles. Initial
screening of titles and abstracts resulted in 50 articles eligible
for further full-text review. One additional article was identified
by reviewing bibliographies, for a total of 51 articles. Based on
the full-text review, two studies were excluded because they
turned out not to address original data, leaving 49 articles for
detailed analysis. Only five out of 49 studies reported on a tar-
get upper limit above 150 mg/dl.
All quality indicators of the 49 studies are summarized in
Tables 1 and 2.
Most papers evaluated multiple quality indicators. The median
number of quality indicators was five (range 2 to 10).
By inspecting the quality indicators, we arrived at four indicator
categories based on the following: zones (adverse-zone
[hypoglycaemia and hyperglycaemia] and in-range zone);
BGLs (for example, mean morning BGL); time intervals (for
example, time elapsed until an event occurs or time spent in
some state); and protocol characteristics (for instance, blood
sampling frequency).
The categories are not mutually exclusive. For example, the
amount of time during which a patient is regarded to be in a
hyperglycaemic state is related to an adverse-zone as well as
to time. Below, we list indicators, in decreasing order of
reported frequency, and describe our findings about them.
Hypoglycaemia (adverse-zone and time categories)
Almost all studies reported at least one hypoglycaemia-related
indicator (43/49 studies). Hypoglycaemia-related indicators
address TGC safety. Because of its central position among
the TGC quality indicators reported, hypoglycaemia is
reported in Table 1 as an overall class of indicators.
Table 3 summarizes the concrete indicators used in this class
along with their definitions.
In total, 15 different thresholds of BGL were used to define a
hypoglycaemic event, varying from <40 mg/dl to <72 mg/dl.
These included four different thresholds to define mild and
Available online />Page 3 of 11
(page number not for citation purposes)
Table 1
List of applied quality indicators
Indicator Description References
Hypoglycaemia
a
Represented in different ways. In most studies it is represented as
the number or percentage of measurements below a certain BGL
value and/or number or percentage of patients who experienced at
least one measurement below a predefined BGL value
43 articles [8-13,15-35,42-57]
BGLs over time Represented as mean and/or median BGL values. Each BGL
measurement or each patient was regarded the unit of observation.
In one study, it was calculated as area under the glucose/time
curve divided by total time per admission [10]. Mean or median
BGL was also calculated:
• at the end of IIT [52];
• after the target range was achieved [9,33,49,54];
• after stopping IIT [45,55];
• for patients who had admission BGL above a threshold [10];
• during IIT [27] or during the last 5 hours of IIT [57];
• after 24 hours [15]; or
• 24 hours before, within and after IIT [39] or 48 hours after IIT [11]
37 articles [8-12,15,17,18,20-
22,24,26,27,29,30,32-36,39,42-47,49-
52,54-58]
Measurements in predefined
BGL ranges
Represented as the number or percentage of measurements in a
predefined BGL range:
• during the study;
• after the target is achieved [27,49,55,56]; or
• at the start of IIT [21]
Each BGL measurement, and in one study each patient [11], was
considered the unit of observation
31 articles [9,11,12,17-21,25-28,30-
33,35,36,42-45,47,49-51,55-57,59,60]
Time to capture defined BGL
target
Represented as:
• mean and median of time; or
• by Kaplan-Meier curve, as in [17,20,23,25,49]
In one study two successive BGL measurements in the target
range were required before calculating time [20]
25 articles [8,9,11,15-
17,20,21,23,25,27,29,30,32-
34,43,45,46,49,52,53,55,56,59]
Frequency of measurements
during the study
Represented as:
• mean or median per patient [11,16,17,23-28];
• mean or median per patient treatment day or days
[12,15,21,22,26,27,29-31];
• sampling interval (time) [13,31-36];
• median frequency per patient-hour [23];
• percentage of patients with more than one measurement in
predefined time interval (every 2 hours, and so on) [31];
• frequency overall per day [12,21]; or
• percentage of time in which at least one measurement per 2
hours was taken [32].
23 articles [11-13,15-17,20-36]
BGL at starting IIT Represented as mean and median BGL 14 articles
[9,11,13,16,21,27,29,33,46,52,54-56,59]
Protocol compliance Compare measurement times suggested by protocol with actual
times of measurements and/or pump speed during IIT and/or at the
time of hypoglycaemic events [9,21]. In one studya time-motion
method was used to measure discrepancy in timing of BGL
measurements between protocol and actual [28]
13 articles [9,11,13,14,16,21,28-
31,33,46,57]
Time in predefined range Represented as:
• mean of percentage of time per patient [12,32,58];
• median of fraction of time per patient [13,15,21,34];
• median of fraction of time per day [29];
• percentage of time for all patients [14,17,21,25]; or
• percentage of time 24 hours before, within and after trial [39]
12 articles [12-15,17,21,25,29,32,34,39,58]
Hyperglycaemic events Represented as:
• percentage of time >180
b
, >250 (severe hyperglycaemia) [16],
or between 151 and 200 and >200 (severe hyperglycaemia) [21];
• percentage of patients with at least one measurement per day ≥
250 and ≥ 200) [22];
• percentage of measurements above 150 [11] or 180 [17-20]; or
• percentage of measurements and patients with at least one BGL
above the 180 level for more than 2 hours [13]
9 articles [11,13,16-22]
Critical Care Vol 12 No 6 Eslami et al.
Page 4 of 11
(page number not for citation purposes)
moderate hypoglycaemia, and three different levels for defin-
ing severe or marked hypoglycaemia. Although a BGL <40
mg/dl was reported in eight studies as a hypoglycaemic event,
10 other studies considered this to be severe hypoglycaemia.
One study reported severe hypoglycaemia only when a low
BGL was accompanied by clinical symptoms such as sweat-
ing and decreased level of consciousness [8].
In some studies the number and/or percentage of BGL meas-
urements below a given threshold and/or the number and per-
centage of patients with at least one measurement below this
threshold were used as safety-related quality indicators. One
article considered all measurements below the selected
hypoglycaemic threshold value over a period of at least 1 hour
to represent a single hypoglycaemic event; hence only when
the BGL increased to within the normal range and then
dropped below the hypoglycaemic threshold in a subsequent
hour was it counted as a second hypoglycaemic event.
In other studies, the definition of hypoglycaemia was not clear,
and it appeared that any measurement below the threshold
was considered a hypoglycaemic event. Seven studies
reported the number and/or percentage of dextrose injections
when BGL was under a threshold value (using five different
thresholds from 45 to 65 mg/dl) as quality indicators. Seven
other indicators in this category were reported in at least one
out of nine studies. Except for 'time from starting TGC till first
hypoglycaemia', the other six indicators referred to the dura-
tion of hypoglycaemia or speed and quality of recovery after a
hypoglycaemic event.
BGL summaries over time (BGL category)
BGL summaries were used in 41 out of 49 studies. BGL sum-
maries correspond to the efficiency of TGC. This indicator was
calculated in different ways and was represented as mean
and/or median. In some studies the BGL itself was the unit of
observation. In other studies the mean BGL per patient or per
time unit (for example, 1 hour) was the unit of observation. One
Morning BGLs Represent as:
• mean BGL around 06:00 hours [43], between 06:00 and 12:00
hours [50], or between 06:00 and 09:00 hours [19];
• mean lowest BGL between 06:00 and 09:00 [43];
• median between 06:00 and 08:00 hours [24] or between 03:00
and 06:00 hours [27]; or
• mean of BGL, but morning time was not mentioned [20]
6 articles [19,20,24,27,43,50]
Hyperglycaemic index Represented as median area between glucose-time curve and
upper normal range divided by time per patient during the trial
[15,24], in first 24 hours [23,25] or in first 48 hours [17]. Upper
normal range was 207 [23], 117 [15], 108 [24], 120 [17], and
150 [25]. It was calculated with the same definition but without
labeling as hypoglycaemic index [23,25]
5 articles [15,17,23-25]
Time until starting or
adjusting IIT
Represented as mean or median of time until starting and/or
adjusting IIT [9,10,27,28], or proportion of patients per time until
starting IIT [12]. In one study a time-motion method was used [28]
5 articles [9,10,12,27,28]
Minimum and maximum
recorded BGL
Represented as:
• minimum and maximum recorded BGL over all patients [35,47];
or
• median of minimum and maximum recorded BGL per patients
[24] or per patient-day [29]
4 articles [24,29,35,47]
Number of patients with at
least one BGL in predefined
range
Represented as number and percentage per month [31] or at
defined time interval after starting TGC [11] or during the study
periods [60]
3 articles [11,31,60]
BGL change over time Represented as:
• speed of BGL change per hour [54]; or
• BGL change in first 24 hours [15]
2 articles [15,54]
Number of patients who
achieved or did not achieve
target or predefined range
Represented as number and percentage 2 articles [17,27]
Number of positive culture Represented as median (per patient) or rate (per year per patient). 2 article [31,59]
Target acquisition error Represented as absolute value and percentage of difference
between the target BGL and achieved BGL
2 articles [32,48]
a
Hypoglycaemia is a concept in this table and related quality indicators are described in table 3.
b
Unit of all BGL thresholds is mg/dl. BGL, blood
glucose level; IIT, intensive insulin therapy; TGC, tight glycaemic control.
Table 1 (Continued)
List of applied quality indicators
Available online />Page 5 of 11
(page number not for citation purposes)
study reported the mean and median of all BGLs as well as the
mean and median of BGL during each intensive insulin therapy
run [9]. 'Mean BGL' was also calculated as the area under the
glucose/time curve divided by the total time per admission
[10]. As long as there is no continuous measurement of BGLs
over time (provided at any time point), this measure reflects
mean BGL when BGL indeed behaves according to the
assumptions underlying the interpolation of consequent BGL
measurements.
BGLs are usually summarized as their mean at various points
in time or in time intervals, and they are presented in graphs
that show mean BGL versus time. Some studies used quality
indicators that refer to the mean or median BGL measured at
the end of TGC, before and after achieving the target range,
or after stopping TGC. Summary of morning BGL was
reported in six studies. The time used to define morning BGL
varied among the studies. BGL at starting TGC (reported in
14 out of 49 studies) was another frequently used indicator in
this group.
Measurements and time in predefined BGL ranges (in-
range zone and time categories)
Thirty-eight studies out of 49 examining the number of meas-
urements and/or the time during which BGL was within a pre-
defined range were reported. These indicators are intended to
address TGC efficiency. In 31 out of 49 of these studies, the
percentage of measurements within the predefined range was
considered a proxy for the proportion of time in each prede-
fined BGL range. In 12 out of 49 studies, the percentages of
time during which BGL was within the predefined range were
calculated, in most of them under the assumption that BGL
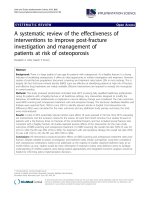
was linear over time. As shown in Figure 1, under this assump-
tion a straight line is drawn between each two consecutive
BGL measurements, and the time to the intersection between
the line and a threshold value defining the range was taken as
the time spent within the predefined BGL range. Five studies
used both the number/percentage of measurements within the
predefined range as well as the time during which BGL was
within the predefined range. The unit of observation differed
also among these studies. Only in one study was the percent-
age of measurements within the predefined range calculated
Table 2
List of applied quality indicators
Indicator Description References
Adequate daily blood glucose control Represented as median hours spent each day within the target range
per patient
1 article [21]
Correlation between within-run mean BGL and within-
run mean coefficient of variance for hourly insulin rate
To illustrate whether hyperglycaemia after attaining target is
correlated with variability in infusion rate
1 article [9]
Correlation between within-run mean BGL and within-
run mean hourly insulin rate
To illustrate whether the protocol performed equally well independent
of insulin resistance
1 article [9]
Distribution of the individual patient BGL mean in a
predefined time interval
Represented in box plot 1 article [11]
Number of patients with well and poor BGL control Represented as percentage of patients and defined as:
• well controlled patient: <130
a
BGL for more than half of the
measured time; or
• poor controlled patient: <130 BGL for less than or equal to half of
the measured time.
1 article [31]
Odds ratio of achieving certain BGL Per additional Intensive Care day and some drugs 1 article [50]
Number of patients having defined mean BGL Represented as percentage of patients with mean BGL ≥ 200 for
each day after surgery
1 article [22]
Probability density function for BGL measurements Represented as a curve for comparison with other protocols 1 article [35]
Proportion of patient-day with mean BGL<200 and ≥
200 and IIT at least in part of the day
1 article [22]
Number of report on necessary departure from protocol,
clinical intervention or adverse events
1 article [35]
Time from admission to first BGL Represented as mean of time [15] 1 articles [15]
Variability after achieving target Represented as within-run mean (IIT episode) ± standard deviation
and mean of within-run coefficient variance ± standard deviation (%)
1 article [9]
a
Unit of all BGL thresholds is mg/dl. BGL, blood glucose level; IIT, intensive insulin therapy.
Critical Care Vol 12 No 6 Eslami et al.
Page 6 of 11
(page number not for citation purposes)
Table 3
Hypoglycaemia quality indicator subgroups
Indicators Description Reference
Hypoglycaemic events Reported thresholds
a
for defining a BGL as hypoglycaemic
event:
• <40 [8,10,17-19,30,35,43];
• ≤ 40 [26];
• <45 [44,54];
• <50 [31,49,50];
• <54 [34];
• <57 [32];
• <60 [8,11,45,52,55];
• ≤ 60 [16,21];
• <63 [23];
• <65 [25];
• <70 [9,17,22,27,28,57];
• <72 [20]; or
• threshold was not reported [48]
Represented as:
• percentage and number of measurements and/or patients
with hypoglycaemic event during the trial, or normalized for
duration of therapy [16];
• mean or median of events per patient-day [57];
• mean of events per patient [27];
• patients with at least one event per day [22]; or
• in three studies, hypoglycaemic events did not occur and
therefore were not reported [32,48,54]
31 articles [8-11,16-23,25-28,30-
32,34,35,43-45,48-50,52,54,55,57]
Severe or marked hypoglycaemic
events
Reported threshold for defining a BGL as severe
hypoglycaemic event:
• <40 [15,20,25,29,33,42,46,47,51,56];
• ≤ 40 [12,13,16];
• <48 [24]; or
• in one study clinical finding defined as severe
hypoglycaemia [8]
Represented as:
• percentage and number of measurements and/or patients
with severe hypoglycaemic event;
• mean or median of events per patient-day [29];
• In two studies severe hypoglycaemic events did not occur
and therefore not reported [47,56]
15 articles
[8,12,13,15,16,20,24,25,29,33,42,46,47,51
,56]
Need for dextrose injection Reported threshold for dextrose injection:
• <45 [29];
• <54 [44];
• <60 [53];
• <63 [23];
• <65 [25]; or
• threshold was not reported [21,56]
Represented as:
• percentage and number of patient with dextrose injection
[21,23,29,44,53,56]; or
• percentage and number of dextrose injections [25]
7 articles [21,23,25,29,44,53,56]
Mild or moderate hypoglycaemic
events
Reported threshold for defining an BGL as severe
hypoglycaemic event:
• 40–59 [42];
• <60 [46];
• 40–60 [51];
• <63 [15]
Represented as percentage and number of measurements
and/or patients with a moderate hypoglycaemic event
4 articles [15,42,46,51]
Hypoglycaemia duration Represented cumulatively [29], as median [24] and per
patient [21]
3 articles [21,24,29]
Time until next in predefined range
after hypoglycaemia
Represent as mean [8,49] or median [31] time 3 articles [8,31,49]
Duration of stopping IIT because of
hypoglycaemia
Represented as median of percentage of time per patient 2 articles [29,33]
Next BGL after hypoglycaemia Represented as mean BGL 2 articles [8,49]
Available online />Page 7 of 11
(page number not for citation purposes)
per patient, and the mean percentage per patient was
reported [11].
Time to capture the defined BGL target (time category)
The time needed to capture the defined BGL target was
reported in 25 out of 49 studies and was represented as mean
or median.
Similar to the time-related indicators in the predefined BGL
range subcategory, in most of these studies it was unclear
how this indicator was calculated. Linearity of BGL over time
was explicitly mentioned in some studies [12-15] and
appeared to have been assumed in other studies. It is possible
that some of the studies might have used the time needed to
capture the actual first BGL measurement within the target
range, instead of the interpolated value shown in Figure 1.
Hyperglycaemic indicators (adverse zone category)
Although the reduction in duration of a hyperglycaemic period
forms a major goal of TGC, only 13 out of 49 studies explicitly
mentioned how a hyperglycaemic event or indicator were
defined. The threshold for considering a BGL measurement to
be hyperglycaemic varied among studies from >150 to >250
mg/dl. Four different thresholds for hyperglycaemia and two
thresholds for severe hyperglycaemia were reported. Six stud-
ies considered a BGL >180 mg/dl to be hyperglycaemic.
Among the definitions, hyperglycaemia was identified as the
percentage of time or of measurements above the threshold by
seven studies [11,16-21], by one study [22] as the percent-
age of patients with at least one measurement above the
threshold per day, and by one study [13] as a BGL above the
threshold for at least 2 hours.
The hyperglycaemic index of BGL was defined by determining
the area under the curve of BGL over time that is above the
hyperglycaemic threshold divided by time per patient
[15,17,23-25]. The thresholds varied between these studies
(from 108 to 207 mg/dl).
Sampling of BGL during the study, BGL at starting TGC
and adherence to protocol (protocol category)
Sampling of BGL during the study was represented as mean
or median of number of measurements per patient
[11,16,17,23-28], per patient treatment day
[12,15,21,22,26,29,30] or over 2 days [31], sampling interval
[13,31-36], frequency per patient hour [23], percentage of
patients with more than one measurement in a predefined time
interval (2 hours) [31], or overall per day [12,21], and as the
percentage of time during which at least one measurement per
2 hours was taken [32].
Frequent BGL measurement is a key element in TGC, in order
to steer the process in a timely manner. However, greater sam-
pling frequency increases nursing and laboratory utilization
[30]. In some studies [14,18,19] the total number of BGL
measurements was reported.
Adherence to protocol (reported in 12/49 studies) is another
frequently used indicator. Evaluation of adherence to protocol
mainly focused on the difference between the protocol-recom-
mended time of the next BGL test and the actual time of
testing.
The remaining indicators (19/30) were mentioned in fewer
than six studies, and 12 of them in only one study.
Time until reaction to
hypoglycaemic event
Represented as maximum time till hypoglycaemia
recognition [8] or mean time till IIT adjustment after
hypoglycaemic event [28]
2 articles [8,28]
Time from starting IIT until first
hypoglycaemia
Represented as mean time 1 article [19]
Time till next BGL after
hypoglycaemia
Represented as mean time 1 article [49]
a
Unit of all BGL thresholds is mg/dl. BGL, blood glucose level; IIT, intensive insulin therapy.
Table 3 (Continued)
Hypoglycaemia quality indicator subgroups
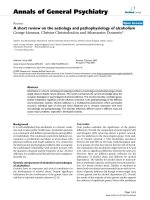
Figure 1
BGL measurements against timeBGL measurements against time. Presented is a graph of hypothetical
BGL measurements against time, showing hyperglycaemic and
hypoglycaemic events, time to capture first (interpolated or measured)
BGL in defined range, hyperglycaemic index and mean BGL.
Critical Care Vol 12 No 6 Eslami et al.
Page 8 of 11
(page number not for citation purposes)
On the whole, the included studies did not comment on why a
specific group of indicators was selected, and – after further
inspection – we could not find an association between indica-
tor selection and patient population, disease or specification
of the designed protocols.
Discussion
We have identified, listed and categorized TGC quality indica-
tors, as used in 49 studies. In our search for studies pertaining
to TGC, we allowed any synonym, without limiting the search
a priori. A limitation of our search is that we addressed only
studies in which evaluation and quality measurement formed a
main objective; we might therefore have missed some studies
with a limited evaluation and quality measurement focus. In
addition, frequency was used as the ordering principle for pre-
senting and describing indicators. Although this approach pro-
vides a good overview of the popular indicators used, it may
overlook less frequent but useful indicators. Finally, although
indicator categories are useful in terms of managing and
understanding indicators, their induction is subjective. One
may for example also consider the complexity of calculation of
indicators (for instance, calculating mean BGL is simpler and
faster than time-weighted mean BGL).
To our knowledge this is the first review dedicated exclusively
to quality indicators for TGC in critically ill patients. Existing
reviews on TGC have focused on its effects [7,37]; evidence
of its utility and its advantages were reported, and ways to
implement TGC protocols successfully discussed.
Indicators and indicator groups have merits and limitations.
Measures of mean BGL may mask measurements within
adverse zones (for instance, two high BGLs may 'compensate'
for one or more BGLs that are too low). Looking at hypogly-
caemia and hyperglycaemic events separately would solve this
problem, but this requires a way to combine both indicators
into one quality indicator of blood glucose management. The
Glycaemic Penalty Index, proposed very recently [38], is an
attempt to address each zone and combine the two results.
Indicators that neglect measurement timing, including the Gly-
caemic Penalty Index, may be sensitive to sampling. For exam-
ple, the mean BGL of two determinations yielding the same
BGL value taken at t
1
and t
2
or at t
1
and t
3
, where say t
3
> t
2
,
will provide the same result, although the BGL – behaving as
a function of time – may differ markedly. The hyperglycaemia
index, which measures the area under the BGL over the time
during which it was above a threshold, can mitigate this prob-
lem. The use of BGL measurement as the independent unit of
observation neglects the within-patient correlation in BGLs.
On the other hand, when providing summaries at the patient
level, some information is lost. Finally, a statistical point worth
noting is that most BGL distributions are log-normal rather
than normal [39], and hence nonparametric measures such as
the median and interquartile range are likely to be more appro-
priate for summarizing the data and inference [40].
Because hypoglycaemia is the main potential risk from imple-
mentation of a TGC protocol, almost all studies reported at
least one indicator related to hypoglycaemia. The number of
hypoglycaemic events before and after TGC implementation
and/or the management of these events form the main TGC
safety indicators. However, we found several definitions and
ambiguous terminology for defining a blood glucose measure-
ment (or a set of measurements) a hypoglycaemic event.
Hypoglycaemic events were usually represented as the per-
centage or number of measurements below a defined level.
Based on most glucose management protocols, the next BGL
measurement after a hypoglycaemic event should be taken
within 15 to 30 minutes. Only one study clearly stated that all
measurements below the hypoglycaemia threshold over 1
hour after the first hypoglycaemic measurement were consid-
ered part of a single hypoglycaemic event or episode. In other
studies it was not clear how these hypoglycaemic measure-
ments where dealt with within a short interval, and hence
whether they were regarded a single or as multiple events.
Some studies also reported the number of dextrose injections
to address this problem, where each injection corresponds to
one hypoglycaemic event regardless of the number of meas-
urements within the short interval. Even in these studies, the
criteria and the BGL threshold for dextrose injection were
different.
Indicators such as the percentage or number of BGL measure-
ments and the time during which BGL was within predefined
ranges were frequently used to represent the time duration in
each predefined BGL range. However, the predefined ranges
were different in the various studies, once again hampering
comparability among them. Summary measures themselves,
like mean and median of BGLs, were calculated with different
units of analysis. Studies reporting the percentage of meas-
urements tended to base calculations on all BGL measure-
ments, regardless of the number of measurements of per
patient.
In contrast, the percentage of time was calculated by taking a
summary of each patient as the unit of analysis. These two
ways of performing calculations do not necessarily yield the
same results, because of within-patient correlations in meas-
urements. It seems prudent to provide both results.
The strong relation between hyperglycaemia and mortality and
morbidity is well known from the literature. Hence, hypergly-
caemia reduction forms the main goal of TGC. Surprisingly,
only nine studies explicitly defined a hyperglycaemic event and
employed different definitions of an event in terms of timing
and the BGL thresholds (between 150 to 250 mg/dl). Report-
ing the fraction of time above a threshold instead of the per-
centage of measurements above a threshold, without time
consideration, seems more useful as a proxy for reducing time
in a hyperglycaemic state. The hyperglycaemia index – calcu-
lated as the area between the curve and the hyperglycaemia
Available online />Page 9 of 11
(page number not for citation purposes)
threshold divided by time – seems to be a useful time-
weighted indicator for hyperglycaemia. In some other studies,
the percentage of BGL measurements or time in a predefined
BGL range above the defined normoglycaemic threshold was
reported but without explicitly labeling them as
hyperglycaemia.
The quality of TGC in individual patients was rarely reported.
Useful indicators include the percentages of patients with well
and poorly controlled BGL, as defined by Carr and coworkers
[31]; patients with at least one BGL outside the blood glucose
target range; and patients who were not within the target
blood glucose range
On the whole, the authors of studies did not explain their
choices of specific subsets of indicators. It is conceivable that
an indicator was described by a specific statistic such as a
median because of an underlying non-normal distribution, in
order to permit sound statistical inference. Although this may
explain the specific choice of a statistic, it does not account for
the choice for the underlying concept in the first place.
Conclusion
When comparing the results of studies, one must consider dif-
ferences in case-mix, in insulin therapy, in other associated
therapies, in the power of the analysis and in outcome meas-
ures. The latter was the focus of this paper. The ambiguity and
variability in the definitions of indicators and the threshold val-
ues for reporting an event as hypoglycaemia or hyperglycae-
mia severely hamper comparability among studies. A main
problem is the absence of a 'gold standard' against which to
compare indicators. Although there are almost no studies
comparing different glycaemic metrics with relevant clinical
outcomes, such as severity-associated mortality, deciding
upon a common glycaemic vocabulary is an essential first
step.
One possible useful way to proceed is to investigate further
the relationship between indicators and clinical outcomes, for
example their prognostic value (for example [24,41]). A sec-
ond possible way is to ask a committee of experts to assess,
for a wide range of patients, the perceived adequacy of TGC.
Ideally, for this sample of patients the BGL would be continu-
ously measured, with insulin provision being based only on
protocol-based measurement sampling. Because this is an
ethically questionable approach (because not all measured
BGLs are acted upon), an alternative is to attempt to achieve
very high sampling of BGL measurements. Then, the indica-
tors could be assessed according to their concordance with
how well BGL is controlled, as assessed by expert opinion.
This approach is subjective but it can provide important insight
into the merits of indicators. In the meantime, studies should
report on a more comprehensive set of indicators, including at
least one pertaining to each of time, hyperglycaemia and
hypoglycaemia. One should also report results at the measure-
ment as well as patient level. An important message of this
review is that many indicators are not but should be precisely
defined, using formulas when necessary, to facilitate their
assessment and comparability.
Competing interests
The authors declare that they have no competing interests.
Authors' contributions
All authors made substantial contributions to the study design
and methods. SE, AA and NdK performed the literature
search, evaluated studies, extracted data, analyzed data and
drafted the manuscript. All authors interpreted the results and
were involved in revising the final manuscript.
References
1. Krinsley JS: Association between hyperglycemia and increased
hospital mortality in a heterogeneous population of critically ill
patients. Mayo Clin Proc 2003, 78:1471-1478.
2. Capes SE, Hunt D, Malmberg K, Gerstein HC: Stress hypergly-
caemia and increased risk of death after myocardial infarction
in patients with and without diabetes: a systematic overview.
Lancet 2000, 355:773-778.
3. Schultz MJ, Royakkers AA, Levi M, Moeniralam HS, Spronk PE:
Intensive insulin therapy in intensive care: an example of the
struggle to implement evidence-based medicine. PLoS Med
2006, 3:e456.
4. Berghe G Van den, Wilmer A, Hermans G, Meersseman W, Wout-
ers PJ, Milants I, Van Wijngaerden E, Bobbaers H, Bouillon R:
Intensive insulin therapy in the medical ICU. N Engl J Med
2006, 354:449-461.
5. Berghe G van den, Wouters P, Weekers F, Verwaest C, Bruyn-
inckx F, Schetz M, Vlasselaers D, Ferdinande P, Lauwers P, Bouil-
lon R: Intensive insulin therapy in the critically ill patients. N
Engl J Med 2001, 345:1359-1367.
6. Berghe G Van den, Wouters PJ, Bouillon R, Weekers F, Verwaest
C, Schetz M, Vlasselaers D, Ferdinande P, Lauwers P: Outcome
benefit of intensive insulin therapy in the critically ill: insulin
dose versus glycemic control. Crit Care Med 2003,
31:359-366.
7. Meijering S, Corstjens AM, Tulleken JE, Meertens JH, Zijlstra JG,
Ligtenberg JJ: Towards a feasible algorithm for tight glycaemic
control in critically ill patients: a systematic review of the
literature. Crit Care 2006, 10:R19.
8. Davidson PC, Steed RD, Bode BW: Glucommander: a compu-
ter-directed intravenous insulin system shown to be safe, sim-
Key messages
• TGC indicators differ widely in their definitions, even
when they are meant to measure the same underlying
concept.
• Many definitions of indicators are not precise, limiting
their applicability and hence the reproducibility and
comparability of research findings.
• An unambiguous indicator reference subset is neces-
sary for evaluating quality of TGC.
• The result of this systematic review can be used as a
starting point from which to develop a standard list of
well defined indicators, which are associated with clini-
cal outcomes or concur with clinicians' subjective views
on the quality of the regulatory process.
Critical Care Vol 12 No 6 Eslami et al.
Page 10 of 11
(page number not for citation purposes)
ple, and effective in 120,618 h of operation. Diabetes Care
2005, 28:2418-2423.
9. Braithwaite SS, Edkins R, Macgregor KL, Sredzienski ES, Houston
M, Zarzaur B, Rich PB, Benedetto B, Rutherford EJ: Performance
of a dose-defining insulin infusion protocol among trauma
service intensive care unit admissions. Diabetes Technol Ther
2006, 8:476-488.
10. Laver S, Preston S, Turner D, McKinstry C, Padkin A: Implement-
ing intensive insulin therapy: development and audit of the
Bath insulin protocol. Anaesth Intensive Care 2004,
32:311-316.
11. Barth MM, Oyen LJ, Warfield KT, Elmer JL, Evenson LK, Tescher
AN, Kuper PJ, Bannon MP, Gajic O, Farmer JC: Comparison of a
nurse initiated insulin infusion protocol for intensive insulin
therapy between adult surgical trauma, medical and coronary
care intensive care patients. BMC Emerg Med 2007, 7:14.
12. Boord JB, Sharifi M, Greevy RA, Griffin MR, Lee VK, Webb TA,
May ME, Waitman LR, May AK, Miller RA: Computer-based insu-
lin infusion protocol improves glycemia control over manual
protocol. J Am Med Inform Assoc 2007, 14:278-287.
13. Shulman R, Finney SJ, O'Sullivan C, Glynne PA, Greene R: Tight
glycaemic control: a prospective observational study of a com-
puterised decision-supported intensive insulin therapy
protocol. Crit Care 2007, 11:R75.
14. Rood E, Bosman RJ, Spoel JI van der, Taylor P, Zandstra DF: Use
of a computerized guideline for glucose regulation in the
intensive care unit improved both guideline adherence and
glucose regulation. J Am Med Inform Assoc 2005, 12:172-180.
15. Vogelzang M, Zijlstra F, Nijsten MW: Design and implementation
of GRIP: a computerized glucose control system at a surgical
intensive care unit. BMC Med Inform Decis Mak 2005, 5:38.
16. Ku SY, Sayre CA, Hirsch IB, Kelly JL: New insulin infusion proto-
col Improves blood glucose control in hospitalized patients
without increasing hypoglycemia. Jt Comm J Qual Patient Saf
2005, 31:141-147.
17. Hermayer KL, Neal DE, Hushion TV, Irving MG, Arnold PC,
Kozlowski L, Stroud MR, Kerr FB, Kratz JM: Outcomes of a cardi-
othoracic intensive care web-based online intravenous insulin
infusion calculator study at a Medical University Hospital. Dia-
betes Technol Ther 2007, 9:523-534.
18. Bone EG, Young D, Chantler J: Target ranges and the apparent
compliance with tight glycaemic control. Anaesthesia
2006,
61:956-958.
19. Orford N, Stow P, Green D, Corke C: Safety and feasibility of an
insulin adjustment protocol to maintain blood glucose con-
centrations within a narrow range in critically ill patients in an
Australian level III adult intensive care unit. Crit Care Resusc
2004, 6:92-98.
20. Chant C, Wilson G, Friedrich JO: Validation of an insulin infu-
sion nomogram for intensive glucose control in critically ill
patients. Pharmacotherapy 2005, 25:352-359.
21. Oeyen SG, Hoste EA, Roosens CD, Decruyenaere JM, Blot SI:
Adherence to and efficacy and safety of an insulin protocol in
the critically ill: a prospective observational study. Am J Crit
Care 2007, 16:599-608.
22. Markovitz LJ, Wiechmann RJ, Harris N, Hayden V, Cooper J, John-
son G, Harelstad R, Calkins L, Braithwaite SS: Description and
evaluation of a glycemic management protocol for patients
with diabetes undergoing heart surgery. Endocr Pract 2002,
8:10-18.
23. Brown G, Dodek P: Intravenous insulin nomogram improves
blood glucose control in the critically ill. Crit Care Med 2001,
29:1714-1719.
24. Vogelzang M, Horst IC van der, Nijsten MW: Hyperglycaemic
index as a tool to assess glucose control: a retrospective
study. Crit Care 2004, 8:R122-R127.
25. Zimmerman CR, Mlynarek ME, Jordan JA, Rajda CA, Horst HM: An
insulin infusion protocol in critically ill cardiothoracic surgery
patients. Ann Pharmacother 2004, 38:1123-1129.
26. Meynaar IA, Dawson L, Tangkau PL, Salm EF, Rijks L: Introduction
and evaluation of a computerised insulin protocol. Intensive
Care Med 2007, 33:591-596.
27. Quinn JA, Snyder SL, Berghoff JL, Colombo CS, Jacobi J: A prac-
tical approach to hyperglycemia management in the intensive
care unit: evaluation of an intensive insulin infusion protocol.
Pharmacotherapy 2006, 26:1410-1420.
28. Malesker MA, Foral PA, McPhillips AC, Christensen KJ, Chang JA,
Hilleman DE: An efficiency evaluation of protocols for tight gly-
cemic control in intensive care units. Am J Crit Care 2007,
16:589-598.
29. Kanji S, Singh A, Tierney M, Meggison H, McIntyre L, Hebert PC:
Standardization of intravenous insulin therapy improves the
efficiency and safety of blood glucose control in critically ill
adults. Intensive Care Med 2004, 30:804-810.
30. Mitchell I, Knight E, Gissane J, Tamhane R, Kolli R, Leditschke IA,
Bellomo R, Finfer S: A phase II randomised controlled trial of
intensive insulin therapy in general intensive care patients.
Crit Care Resusc 2006, 8:289-293.
31. Carr JM, Sellke FW, Fey M, Doyle MJ, Krempin JA, de la Torre R,
Liddicoat JR: Implementing tight glucose control after coronary
artery bypass surgery. Ann Thorac Surg 2005, 80:902-909.
32. Shaw GM, Chase JG, Wong J, Lin J, Lotz T, Le Compte AJ, Loner-
gan TR, Willacy MB, Hann CE: Rethinking glycaemic control in
critical illness: from concept to clinical practice change. Crit
Care Resusc 2006, 8:90-99.
33. Balkin M, Mascioli C, Smith V, Alnachawati H, Mehrishi S, Saydain
G, Slone H, Alessandrini J, Brown L: Achieving durable glucose
control in the intensive care unit without hypoglycaemia: a
new practical IV insulin protocol. Diabetes Metab Res Rev
2007, 23:49-55.
34. Plank J, Blaha J, Cordingley J, Wilinska ME, Chassin LJ, Morgan C,
Squire S, Haluzik M, Kremen J, Svacina S, Toller W, Plasnik A,
Ellmerer M, Hovorka R, Pieber TR: Multicentric, randomized,
controlled trial to evaluate blood glucose control by the model
predictive control algorithm versus routine glucose manage-
ment protocols in intensive care unit patients. Diabetes Care
2006, 29:271-276.
35. Chase JG, Shaw GM, Lotz T, LeCompte A, Wong J, Lin J, Loner-
gan T, Willacy M, Hann CE: Model-based insulin and nutrition
administration for tight glycaemic control in critical care. Curr
Drug Deliv 2007, 4:283-296.
36. Lonergan T, Le Compte A, Willacy M, Chase JG, Shaw GM, Wong
XW, Lotz T, Lin J, Hann CE: A simple insulin-nutrition protocol
for tight glycemic control in critical illness: development and
protocol comparison. Diabetes Technol Ther 2006, 8:191-206.
37. Nazer LH, Chow SL, Moghissi ES: Insulin infusion protocols for
critically ill patients: a highlight of differences and similarities.
Endocr Pract 2007, 13:137-146.
38. Van Herpe T, De Brabanter J, Beullens M, De Moor B, Berghe G
Van den: Glycemic penalty index for adequately assessing and
comparing different blood glucose control algorithms. Crit
Care 2008, 12:R24.
39. Chee F, Fernando T, van Heerden PV: Closed-loop control of
blood glucose levels in critically ill patients. Anaesth Intensive
Care 2002, 30:295-307.
40. Limpert E, Stahel W, Abbt M: Log-normal distributions across
the sciences: keys and clues. BioScience 2001, 51:341-352.
41. Vogelzang M, Nijboer JM, Horst IC van der, Zijlstra F, ten Duis HJ,
Nijsten MW: Hyperglycemia has a stronger relation with out-
come in trauma patients than in other critically ill patients. J
Trauma 2006, 60:873-879.
42. Krinsley J, Grissler B: Intensive glycemic management in criti-
cally ill patients. Jt Comm J Qual Patient Saf 2005, 31:308-312.
43. Ball C, de Beer K, Gomm A, Hickman B, Collins P: Achieving tight
glycaemic control. Intensive Crit Care Nurs 2007, 23:137-144.
44. McMullin J, Brozek J, McDonald E, Clarke F, Jaeschke R, Heels-
Ansdell D, Leppert R, Foss A, Cook D: Lowering of glucose in
critical care: a randomized pilot trial. J Crit Care 2007,
22:112-119.
45. Goldberg PA, Sakharova OV, Barrett PW, Falko LN, Roussel MG,
Bak L, Blake-Holmes D, Marieb NJ, Inzucchi SE: Improving glyc-
emic control in the cardiothoracic intensive care unit: clinical
experience in two hospital settings. J Cardiothorac Vasc
Anesth 2004, 18:690-697.
46. Taylor BE, Schallom ME, Sona CS, Buchman TG, Boyle WA, Maz-
uski JE, Schuerer DE, Thomas JM, Kaiser C, Huey WY, Ward MR,
Zack JE, Coopersmith CM: Efficacy and safety of an insulin infu-
sion protocol in a surgical ICU. J Am Coll Surg 2006, 202:1-9.
47. Lonergan T, Compte AL, Willacy M, Chase JG, Shaw GM, Hann
CE, Lotz T, Lin J, Wong XW: A pilot study of the SPRINT proto-
col for tight glycemic control in critically Ill patients. Diabetes
Technol Ther 2006, 8:449-462.
Available online />Page 11 of 11
(page number not for citation purposes)
48. Wong XW, Singh-Levett I, Hollingsworth LJ, Shaw GM, Hann CE,
Lotz T, Lin J, Wong OS, Chase JG: A novel, model-based insulin
and nutrition delivery controller for glycemic regulation in crit-
ically ill patients. Diabetes Technol Ther 2006, 8:174-190.
49. Juneja R, Roudebush C, Kumar N, Macy A, Golas A, Wall D, Wol-
verton C, Nelson D, Carroll J, Flanders SJ: Utilization of a compu-
terized intravenous insulin infusion program to control blood
glucose in the intensive care unit. Diabetes Technol Ther 2007,
9:232-240.
50. Thomas AN, Marchant AE, Ogden MC, Collin S: Implementation
of a tight glycaemic control protocol using a web-based insulin
dose calculator. Anaesthesia 2005, 60:1093-1100.
51. Bland DK, Fankhanel Y, Langford E, Lee M, Lee SW, Maloney C,
Rogers M, Zimmerman G: Intensive versus modified conven-
tional control of blood glucose level in medical intensive care
patients: a pilot study. Am J Crit Care 2005, 14:370-376.
52. Osburne RC, Cook CB, Stockton L, Baird M, Harmon V, Keddo A,
Pounds T, Lowey L, Reid J, McGowan KA, Davidson PC: Improv-
ing hyperglycemia management in the intensive care unit: pre-
liminary report of a nurse-driven quality improvement project
using a redesigned insulin infusion algorithm. Diabetes Educ
2006, 32:394-403.
53. Dilkhush D, Lannigan J, Pedroff T, Riddle A, Tittle M: Insulin infu-
sion protocol for critical care units. Am J Health Syst Pharm
2005, 62:2260-2264.
54. Dazzi D, Taddei F, Gavarini A, Uggeri E, Negro R, Pezzarossa A:
The control of blood glucose in the critical diabetic patient: a
neuro-fuzzy method. J Diabetes Complications 2001, 15:80-87.
55. Goldberg PA, Siegel MD, Sherwin RS, Halickman JI, Lee M, Bailey
VA, Lee SL, Dziura JD, Inzucchi SE: Implementation of a safe
and effective insulin infusion protocol in a medical intensive
care unit. Diabetes Care 2004, 27:461-467.
56. Iqbal M, Al-Aithan AM, Rehmani R, Eledrisi M: Initial experience
with an intensive care hyperglycemia protocol in a Saudi Ara-
bian intensive care unit. Saudi Med J 2006, 27:492-496.
57. Lien LF, Spratt SE, Woods Z, Osborne KK, Feinglos MN: Optimiz-
ing hospital use of intravenous insulin therapy: improved man-
agement of hyperglycemia and error reduction with a new
nomogram. Endocr Pract 2005, 11:240-253.
58. De Block C, Manuel YKB, Van Gaal L, Rogiers P: Intensive insulin
therapy in the intensive care unit: assessment by continuous
glucose monitoring. Diabetes Care 2006, 29:1750-1756.
59. Scheuren L, Baetz B, Cawley MJ, Fitzpatrick R, Cachecho R: Phar-
macist designed and nursing-driven insulin infusion protocol
to achieve and maintain glycemic control in critical care
patients. J Trauma Nurs 2006, 13:140-145.
60. Roth JM, Bolin B, Baird RW: Evaluation of blood glucose values
in critically ill patients before and after implementation of an
intensive insulin infusion protocol. Proc (Bayl Univ Med Cent)
2007, 20:237-239.