Báo cáo y học: "Tight perioperative glucose control is associated with a reduction in renal impairment and renal failure in non-diabetic cardiac surgical patients" ppsx
Bạn đang xem bản rút gọn của tài liệu. Xem và tải ngay bản đầy đủ của tài liệu tại đây (488.78 KB, 12 trang )
Open Access
Available online />Page 1 of 12
(page number not for citation purposes)
Vol 12 No 6
Research
Tight perioperative glucose control is associated with a reduction
in renal impairment and renal failure in non-diabetic cardiac
surgical patients
Patrick Lecomte
1
, Bruno Van Vlem
2
, Jose Coddens
1
, Guy Cammu
1
, Guy Nollet
1
, Frank Nobels
3
,
Hugo Vanermen
4
and Luc Foubert
1
1
Department of Anaesthesiology and Critical Care Medicine, Onze-Lieve-Vrouw Hospital, Moorselbaan 164, 9300 Aalst, Belgium
2
Department of Nephrology, Onze-Lieve-Vrouw Hospital, Moorselbaan 164, 9300 Aalst, Belgium
3
Department of Endocrinology, Onze-Lieve-Vrouw Hospital, Moorselbaan 164, 9300 Aalst, Belgium
4
Department of Cardiothoracic and Vascular Surgery, Onze-Lieve-Vrouw Hospital, Moorselbaan 164, 9300 Aalst, Belgium
Corresponding author: Luc Foubert,
Received: 18 Aug 2008 Revisions requested: 20 Sep 2008 Revisions received: 4 Nov 2008 Accepted: 4 Dec 2008 Published: 4 Dec 2008
Critical Care 2008, 12:R154 (doi:10.1186/cc7145)
This article is online at: />© 2008 Lecomte et al.; licensee BioMed Central Ltd.
This is an open access article distributed under the terms of the Creative Commons Attribution License ( />),
which permits unrestricted use, distribution, and reproduction in any medium, provided the original work is properly cited.
Abstract
Introduction Acute renal failure after cardiac surgery increases
in-hospital mortality. We evaluated the effect of intra- and
postoperative tight control of blood glucose levels on renal
function after cardiac surgery based on the Risk, Injury, Failure,
Loss, and End-stage kidney failure (RIFLE) criteria, and on the
need for acute postoperative dialysis.
Methods We retrospectively analyzed two groups of
consecutive patients undergoing cardiac surgery with
cardiopulmonary bypass between August 2004 and June 2006.
In the first group, no tight glycemic control was implemented
(Control, n = 305). Insulin therapy was initiated at blood glucose
levels > 150 mg/dL. In the group with tight glycemic control
(Insulin, n = 745), intra- and postoperative blood glucose levels
were targeted between 80 to 110 mg/dL, using the Aalst
Glycemia Insulin Protocol. Postoperative renal impairment or
failure was evaluated with the RIFLE score, based on serum
creatinine, glomerular filtration rate and/or urinary output. We
used the Cleveland Clinic Severity Score to compare the
predicted vs observed incidence of acute postoperative dialysis
between groups.
Results Mean blood glucose levels in the Insulin group were
lower compared to the Control group from rewarming on
cardiopulmonary bypass onwards until ICU discharge (p <
0.0001). Median ICU stay was 2 days in both groups. In non-
diabetics, strict perioperative blood glucose control was
associated with a reduced incidence of renal impairment (p =
0.01) and failure (p = 0.02) scoring according to RIFLE criteria,
as well as a reduced incidence of acute postoperative dialysis
(from 3.9% in Control to 0.7% in Insulin; p < 0.01). The 30-day
mortality was lower in the Insulin than in the Control group (1.2%
vs 3.6%; p = 0.02), representing a 70% decrease in non-
diabetics (p < 0.05) and 56.1% in diabetics (not significant).
The observed overall incidence of acute postoperative dialysis
was adequately predicted by the Cleveland Clinic Severity
Score in the Control group (p = 0.6), but was lower than
predicted in the Insulin group (1.2% vs 3%, p = 0.03).
Conclusions In non-diabetic patients, tight perioperative blood
glucose control is associated with a significant reduction in
postoperative renal impairment and failure after cardiac surgery
according to the RIFLE criteria. In non-diabetics, tight blood
glucose control was associated with a decreased need for
postoperative dialysis, as well as 30-day mortality, despite of a
relatively short ICU stay.
Introduction
Postoperative deterioration of renal function after cardiac sur-
gery remains a serious complication, associated with
increased length of Intensive Care Unit (ICU) stay, increased
in-hospital morbidity and mortality and with worse long-term
outcome [1,2]. Acute renal failure develops in 5% to 30% of
cardiac surgical patients depending on its definition, whereas
1% to 5% of them need hemodialysis [1-3]. The need for post-
BGL: blood glucose level; CPB: cardio pulmonary bypass; ETCO
2
: end tidal carbon dioxide; ICU: intensive care unit; MAC: minimal alveolar concen-
tration; OR: operating room.
Critical Care Vol 12 No 6 Lecomte et al.
Page 2 of 12
(page number not for citation purposes)
operative renal replacement therapy is an independent risk
factor of death [1]. To date, no drug has been identified as truly
nephroprotective in cardiac surgical patients. However, tight
glycemic control in the ICU is reported to improve morbidity,
mortality and outcome in cardiac surgical patients and to
reduce the need for postoperative renal replacement therapy
by up to 40% [4-6]. Recently, several studies focused on the
benefit of intraoperative tight glycemic control and its relation-
ship with postoperative acute renal failure requiring dialysis
[3,5-7]. In cardiac surgery poor intraoperative glycemic control
in diabetics is associated with a sevenfold increase in postop-
erative renal failure, whereas severe hyperglycemia during car-
diopulmonary bypass (CPB) in non-diabetics is associated
with acute renal failure requiring dialysis [3-6]. Recent obser-
vations indicate that hyperglycemia-induced oxidative stress
inhibits Na
+
/glucose cotransporter activity in renal proximal
tubule cells and stimulates renal oxygen consumption by
increased endothelial nitric oxide synthase [8,9].
Until recently, the outcome parameter of choice when evaluat-
ing the effect of tight glycemic control in cardiac surgical
patients has been the incidence of postoperative dialysis. The
possible benefit of intra- and postoperative tight glycemic con-
trol on the development of renal impairment with elevated cre-
atinine levels and/or decreased glomerular filtration rates, but
without the need for renal replacement therapy, is unknown.
Therefore, we evaluated the effect of both intra- and postoper-
ative tight blood glucose control (80 to 110 mg/dL) with con-
tinuous intravenous insulin on the incidence and severity of
acute kidney injury after cardiac surgery, using the RIFLE cri-
teria. RIFLE is the acronym for R(isk of renal failure), I(njury to
kidney function) and F(ailure of kidney function), L(oss of kid-
ney function) and E(nd-stage renal failure) (the criteria are
shown in detail in Table 1). According to the consensus crite-
ria of the Acute Dialysis Quality Initiative Workgroup [10],
postoperative renal impairment or renal failure was based on
the RIFLE criteria and on the need for acute postoperative dial-
ysis. The RIFLE score was recently validated in cardiac surgi-
cal patients [11]. We also used the Cleveland Clinic Severity
Score to compare the predicted vs observed incidence of
postoperative acute renal failure requiring dialysis in both
groups [12].
Materials and methods
Between August 2004 and June 2006, a total of 1,862
patients were scheduled for cardiac procedures at the Onze-
Lieve-Vrouw Hospital in Aalst, Belgium. Inclusion criteria were
an age > 18 years and the use of CPB. Exclusion criteria were
any surgery needing deep hypothermic circulatory arrest, as
well as preoperative end-stage renal failure requiring hemodi-
alysis. All data were retrieved from patient files and from the
database of the Department of Cardiothoracic and Vascular
Surgery. This study was approved by the hospital ethics com-
mittee, and informed consent was waived. Patients not previ-
ously treated for diabetes mellitus but with a fasting glucose <
125 mg/dL were considered to be diabetics, according to the
consensus criteria [13]. Patients treated for diabetes mellitus,
and patients not previously known as diabetics but with a fast-
ing glucose ≥ 125 mg/dL, were considered diabetics, accord-
ing to international guidelines [13]. During a 2-year period,
intra- and postoperative management was similar, except for
the blood glucose management: strict glucose control was not
implemented until June 2005 and insulin therapy was only ini-
tiated after the blood glucose level (BGL) had reached > 150
mg/dL. During surgery, blood glucose measurements were
performed after induction, every 30 min during cardiopulmo-
nary bypass. In intensive care, BGLs were controlled every 3
h during the first 12 h after arrival. Afterwards, blood glucose
measurements were scheduled every 6 h. From January until
May 2005, several different insulin regimens were tested on
performance, BGL variability and safety in order to achieve
tight glycemic control (80 to 110 mg/dL) with a minimal risk of
hypoglycemia. During this period, the Aalst Glycemia Insulin
Protocol was conceived, tested, and adjusted to optimize per-
formance [14]. Because of different major adjustments to the
insulin protocol during the testing and implementation period,
no outcome data were recorded. Only at the end of May 2005
were the performance and safety of the Aalst Glycemia Insulin
Protocol were considered satisfactory for general implementa-
tion in the cardiac operating theatres and the intensive care
unit. From June 2005 onwards, both intra- and postoperative
Table 1
Overview of the RIFLE criteria [9]
GFR criteria Urinary output (UO) criteria
R(isk) Increased serum creatinine × 1.5 or GFR decrease > 25% UO < 0.5 mL/kg/u × 6 h
I(njury) increased serum creatinine × 2 or GFR decrease > 50% UO < 0.5 mL/kg/u × 12 h
F(ailure) increased serum creatinine × 3, GFR decrease 75% or serum creatinine
≥ 4 mg/dL
UO < 0.3 mL/kg/u × 24 h or anuria × 12 h
L(oss) Persistent ARF = complete loss of kidney function > 4 weeks
E(nd-stage kidney failure) End stage kidney disease
ARF, acute renal failure; GFR, glomerular filtration rate.
Available online />Page 3 of 12
(page number not for citation purposes)
BGL were strictly targeted between 80 to 110 mg/dL using
the Aalst Glycemia Insulin Protocol for cardiac surgery [14].
According to the algorithm, blood glucose measurements
were scheduled every 30 min intraoperatively and every 60
min in intensive care. This regimen has been described exten-
sively elsewhere [13]. There were no changes in standard
operational procedures, both in the operating room and in the
ICU. Basic fluid management in the ICU consisted of 1 mL/kg/
h of dextrose 5% in both groups. Additional fluid administra-
tion with colloids or crystalloids was based on a clinical deci-
sion at the discretion of the attending intensivist. The
departments of anesthesia, ICU, cardiac surgery, nephrology
and perfusion consisted of the same staff members, and no
new types of surgery were introduced during the study period.
The decision for initiating renal replacement therapy was
based on clinical variables at the discretion of the attending
nephrologist.
Because of this important change in perioperative care, we
were able to study two groups of consecutive patients under-
going cardiac surgery with the use of CPB: in the Control
group, operated between August and December 2004, there
was no strict blood glucose control, both during surgery as in
the ICU. Insulin therapy was only initiated after BGL reached
> 150 mg/dL. From June 2005 until June 2006, both intra- and
postoperative BGLs were strictly controlled between 80 to
110 mg/dL using the Aalst Glycemia Insulin Protocol in all
patients. The conditions and conduct of hypothermic (28°C)
CPB remained constant throughout the study period. Myocar-
dial protection was provided by cold antero- and/or retrograde
St. Thomas solution in all cases. The Aalst Glycemia Insulin
Protocol in all patients was continued in the ICU until enteral
feeding was started. Preoperative variables needed for the
additive European System for Cardiac Operative Risk Evalua-
tion (EuroSCORE) and Cleveland Clinic Severity Score calcu-
lation are shown in Table 2. Data collection fo the Control
group consisted of reviewing each patient file separately, and
Table 2
Patient characteristics
Control Insulin p Value
Period August to December 2004 June 2005 to June 2006
Total (n) 305 745
Female 103 (33.8) 265 (35.6) 0.61
Body Mass Index, mean ± SD 26.1 ± 4.0 26.0 ± 4.3 0.98
Insulin-treated diabetics, n (%) 17 (5.6) 33 (4.4) 0.43
Non-Insulin-treated diabetics, n (%) 33 (10.8) 89 (11.9) 0.67
Untreated diabetics with fasting glucose ≥ 125 mg/dL, n (%) 22 (7.2) 40 (5.4) 0.25
Fasting glucose (mg/dL) 106 ± 31 107 ± 26 0.11
Unstable angina, n (%) 4 (1.3) 11 (1.5) 1.0
Congestive heart failure, n (%) 48 (15.8) 128 (17.2) 0.65
LVEF 30% to 50%, n (%) 47 (15.6) 99 (13.3) 0.38
LVEF < 30%, n (%) 23 (7.6) 60 (8.1) 0.89
Recent myocardial infarction, n (%) 9 (3) 18 (2.4) 0.67
COPD, n (%) 32 (10.5) 63 (8.4) 0.29
Peripheral arteriopathy, n (%) 5 (1.6) 16 (2.1) 0.80
Neurologic dysfunction, n (%) 19 (6.3) 37 (4.9) 0.45
Serum creatinine > 2.1 mg/dL, n (%) 6 (1.9) 17 (2.3) 1.0
Endocarditis, n (%) 3 (1.0) 8 (1.1) 1.0
Angiotensin-converting Enzyme Inhibitors 105 (34.4) 296 (39.7) 0.12
EuroSCORE, mean ± SD 4 ± 3 4 ± 3 0.76
Cleveland Clinic Severity Score 2 ± 2 3 ± 2 0.19
Data are presented as mean ± SD or number (%) unless otherwise mentioned.
COPD, chronic obstructive pulmonary disease; EuroSCORE, European System for Cardiac Operative Risk Evaluation; LVEF, left ventricular
ejection fraction; SD, standard deviation.
Critical Care Vol 12 No 6 Lecomte et al.
Page 4 of 12
(page number not for citation purposes)
entering all data in a data management file. The data collection
of the BGL and outcome in the Insulin group was prospec-
tively designed. Only patients with a complete dataset were
included in this analysis.
The primary endpoint of this retrospective analysis was to eval-
uate the effect of tight glycemic control on acute renal failure
with or without the need for dialysis, in both non-diabetic and
diabetic cardiac surgical patients. The degree of renal impair-
ment and/or failure was evaluated using the criteria of the
Acute Dialysis Quality Initiative Workgroup [10]. Patients were
classified into three severity categories, Risk, Injury and Fail-
ure, according to plasma creatinine or estimated glomerular fil-
tration rate and urinary output (Table 1). The estimated
glomerular filtration rate was calculated, using the Modification
of Diet in Renal Disease equitation [15]. When RIFLE scores
based on plasma creatinine, estimated glomerular filtration
rate or urinary output were not congruent, the most severe
score was recorded. The RIFLE scores 'Loss and End stage
renal failure' were not relevant to this analysis because their
criteria (renal function loss > 4 weeks) exceeded the study
period. RIFLE classification was calculated in the ICU the
morning after surgery. Additionally, the maximal RIFLE score
during the entire hospital stay was registered. Patients not
scoring R, I or F were classified as '0-RIF', patients scoring R,
I, or F but without the need for de novo postoperative dialysis
as 'RIF-D' and patients with renal failure requiring postopera-
tive dialysis as 'RIF+D'. Additionally, to evaluate the effect of
tight glycemic control on the expected incidence of acute
renal failure requiring dialysis after cardiac surgery, we used
the Cleveland Clinic Severity Score [12]. This score predicts
the incidence of acute renal failure requiring dialysis across 4
categories of severity, based on an absolute score (0 to 17)
using 13 preoperative clinical variables as follows. Scoring 1
point: female gender, congestive heart failure, left ventricular
ejection fraction < 35%, chronic obstructive pulmonary dis-
ease (COPD), insulin-requiring diabetes, previous cardiac sur-
gery, only valve surgery; scoring 2 points: coronary artery
bypass graft (CABG) + valve surgery, other cardiac surgery,
emergency surgery, preoperative creatinine 1.2 to < 2.1 mg/
dL, preoperative use of intra-aortic balloon pump (IABP); scor-
ing 5 points: preoperative creatinine ≥ 2.1 mg/dL. Patients
scoring 0 to 2 points have a predicted incidence for acute
postoperative dialysis of 0.4%. A score between 3 to 5 points
represents a risk of 1.8%. Patients scoring 6 to 8 points have
a risk of 9.5% and patients scoring 9 to 13 points have a pre-
dicted incidence of 21.3%.
Secondary endpoints of this retrospective analysis were the
effect of tight glycemic control on the incidence of 30-day mor-
tality and in-hospital morbidity in diabetic and non-diabetic car-
diac surgical patients. Severe in-hospital morbidity was
defined as one or more of (a) cardiac outcome: low cardiac
output and/or hypotension treated with an IABP and/or ≥ 2
intravenous inotropes or vasopressors during more than 24 h,
malignant arrhythmia (asystole, ventricular tachycardia, or ven-
tricular fibrillation) requiring cardiac resuscitation; (b) respira-
tory outcome: mechanical ventilation > 48 h, reintubation,
tracheotomy; (c) renal outcome: acute renal failure requiring
dialysis; (d) infectious outcome: any use of intravenous antibi-
otics, other than those used for prophylaxis, with of without
positive cultures; and (e) other outcome: any surgery or inva-
sive procedure necessary to treat a postoperative adverse
event associated with the initial cardiac surgery.
Statistical analysis
Uni- and multivariate analysis for assessment of the relation-
ships between potential prognostic factors and need for dial-
ysis was performed by using the Fisher exact test, Mann-
Whitney U test, analysis of variance (ANOVA), multinomial
logistic regression analysis and Student t test when appropri-
ate. Data are expressed as mean ± standard deviation (SD) for
continuous variables and numbers and percentages for quali-
tative variables. All p values were two-tailed. p < 0.05 was con-
sidered significant.
Results
Preoperative characteristics
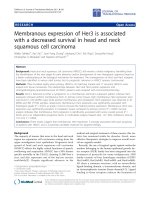
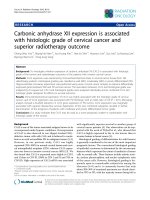
Of the 1,862 patients scheduled for cardiac surgery between
August 2004 and June 2006, a total of 1,050 patients were
included in this retrospective analysis, with 305 patients in the
Control and 745 patients in the Insulin group (Figure 1). Pre-
operative demographic data are shown in Table 2. Euro-
SCORE risk profiles and Cleveland Clinic Severity Scores
were similar between groups (not significant).
Blood glucose control
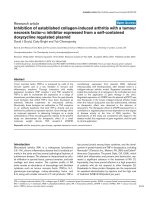
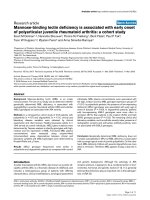
At induction of anesthesia, mean BGLs of non-diabetics were
comparable between groups: 100 ± 14 mg/dL (Control) vs 98
± 11 mg/dL (Insulin), respectively (p = 0.10). During surgery,
from rewarming on CPB onwards, BGLs in the Insulin group
were significantly lower than in the Control group at all meas-
ured time points until the end of surgery (p < 0.0001; Figure
2). At ICU admission, mean BGL in the Insulin group (104 ±
21 mg/dL) was significantly lower than in the Control group
(117 ± 29 mg/dL; p < 0.001). After arrival in the ICU, BGL in
the Insulin group remained significantly lower until ICU dis-
charge (p < 0.0001; Figure 2). The preset target of 80 to 110
mg/dL was reached in 71% of all measurements.
In diabetics, mean BGLs at induction of anesthesia were
higher in the Control group than in the Insulin group: 142 ± 45
mg/dL vs 125 ± 39 mg/dL, respectively (p = 0.01). Until ICU
admission, BGLs were comparable between groups (not sig-
nificant; Figure 2). Afterwards, mean BGL in the Insulin group
remained significantly lower until ICU discharge (p < 0.0001;
Figure 2). The preset target of 80 to 110 mg/dL was reached
in diabetics in 59.5% of all measurements.
Available online />Page 5 of 12
(page number not for citation purposes)
Hypoglycemia (BGL < 50 mg/dL) in the Control group
occurred in 9/305 (2.9%) vs 5/745 (0.7%) patients in the
Insulin group (p = 0.006).
In the Insulin group, tight glycemic control in the ICU was rel-
atively short with the 10th and 90th percentile at 15.0 and
46.0 h, respectively. As much as 70% of all patients in the
Insulin group were in the ICU for 24 h or less and were there-
fore exposed to tight glycemic control for a limited period of
time. For '0-RIF' and 'RIF-D' patients, median duration of tight
glycemic control was comparable, 21.0 (9.0 to 48.0) h and
21.0 (10.0 to 48.0) h, respectively (not significant). The
median duration of tight glycemic control in the RIF+D patients
was 312 (72 to 2,304) h, because of their longer ICU stay.
Renal function
On the morning after surgery, fewer patients in the Insulin
group scored R (11.4 vs 24.4%, p < 0.0001), I (0.9 vs 4.6%,
p < 0.003) or F (0.1 vs 1.3%, p < 0.026) than in the Control
group.
Maximal RIFLE scores were lower in the Insulin group and
there were significantly more '0-RIF' patients in the Insulin
group (54.0%) than in the Control group (39.6%) (p < 0.001).
Mean creatinine levels in the Control group significantly
increased from 0.98 ± 0.41 at admission to 1.23 ± 0.68 mg/
dL at hospital discharge in 'RIF-D' patients (p = 0.015). In con-
trast, in the Insulin group there was no significant change in
mean creatinine levels between hospital admission and dis-
charge (1.02 ± 0.36 vs 1.10 ± 0.42 mg/dL, p = 0.12).
In the Control group there were 183 patients who developed
renal injury/failure (scoring R, I or F). In 24 (13.1%) of them,
renal injury was solely attributable to low urinary output (as
defined by the definition of RIFLE), and in 10 (5.5%) solely to
an increase in serum creatinine. In the Insulin group there were
342 patients who developed renal injury/failure (scoring R, I or
F). In 87 (25.4%) of them, renal injury was solely attributed to
low urinary output (as defined by the definition of RIFLE), and
in 4 (1.2%) solely to an increase in serum creatinine. Between
groups, there were significantly more patients in the Insulin
group scoring R, I or F solely based on low urinary output cri-
teria (p = 0.002), but significantly less patients developing
renal injury based on an isolated increased serum creatinine (p
< 0.001).
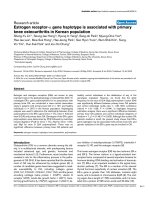
In non-diabetics, there were significantly more '0-RIF' patients
in the Insulin group (55.7%) then in the Control group (40.4%)
(p = 0.002). The incidence in patients maximally scoring R dur-
ing the entire hospital stay was similar between groups (p =
0.27). In contrast, for non-diabetics maximally scoring I and F,
there was a significant difference between groups (p = 0.008
and p = 0.02, respectively) (Figure 3). Moreover, the incidence
of acute postoperative dialysis in non-diabetic patients
decreased from 3.9% (n = 9) in the Control group to 0.7% (n
= 4) in the Insulin group (p = 0.004) (Figure 3).
In diabetics, there was a similar incidence of '0-RIF' patients in
both the Insulin and the Control group, 47.5% and 35.7%
respectively (p = 0.11). It did not affect postoperative R (p =
1.0), I (p = 0.21) and F (p = 0.27) scoring (Figure 3), or the
incidence of acute postoperative dialysis (p = 0.45).
Figure 1
Overview of enrolment processOverview of enrolment process. CPB, cardiopulmonary bypass; DHCA, deep hypothermic circulatory arrest; ESRF, end-stage renal failure.
Critical Care Vol 12 No 6 Lecomte et al.
Page 6 of 12
(page number not for citation purposes)
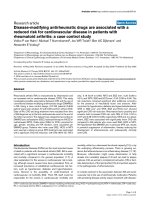
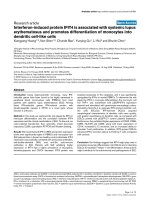
The distribution into different risk classes of the predictive
Cleveland Clinic Severity Score was comparable between
groups (not significant). The observed overall incidence of
acute postoperative dialysis was adequately predicted by the
Cleveland Clinic Severity Score in the Control group (p = 0.6),
but was 60% lower in the Insulin group than predicted (1.2 vs
3%, p = 0.03). In non-diabetics, the observed vs predicted
incidence of acute postoperative dialysis in the severe (6 to 8
points) to high (9 to 13 points) risk classes was significantly
lower in the Insulin group (severe risk: 1.2% vs 9.5%, p =
0.03; high risk: 2.9% vs 21.3%, p = 0.03) (Figure 4). The dif-
ference between the predicted vs observed incidence of post-
operative dialysis in the Control group was not significant (1.8
vs 5.7%, p = 0.21). In diabetics, there was no significant dif-
ference between the predicted vs observed incidence of acute
postoperative dialysis throughout all risk classes (not signifi-
cant).
Results from multinomial regression analysis on preoperative
angiotensin-converting enzyme inhibitors and perioperative
aprotinin administration and packed cell transfusion are repre-
sented in Table 3. The preoperative use of angiotensin-con-
verting enzyme inhibitors was not associated with a
preoperative increased serum creatinine > 1.5 mg/dL in nei-
ther groups (p = 1.0 (Control); p = 0.75 (Insulin)).
Postoperative morbidity and 30-day mortality
The distribution of procedures is shown in Table 4. In the Insu-
lin group, patients suffered significantly less cardiac (p <
0.0001), renal (p = 0.003) and infectious (p = 0.003) morbid-
ities than in the Control group. Length of ICU stay was compa-
rable between groups (p = 0.78), as well as the use of
intravenous diuretics in the ICU (p = 1.0).
The overall incidence of 30-day mortality was significantly
lower in the Insulin group than in the Control group (1.2 vs
3.6%, respectively) (p = 0.02). In non-diabetics, 30-day mor-
Figure 2
Mean blood glucose levels ± standard deviation (SD) (mg/dL) during surgery and during ICU stay between groupsMean blood glucose levels ± standard deviation (SD) (mg/dL) during surgery and during ICU stay between groups. Induction, startCPB, rewarming,
stopCPB, arrival ICU, ICU12, 24, 36, 48 = blood glucose level at induction of anesthesia, on the initiation of cardiopulmonary bypass, at
rewarming to normothermia on CPB, at separating from bypass, at admission in the ICU and after 12, 24, 36 and 48 h after arrival in the ICU,
respectively. Control, control group; CPB, cardiopulmonary bypass; ICU, Intensive Care Unit; Insulin, group with tight glycemic control.
Available online />Page 7 of 12
(page number not for citation purposes)
tality decreased from 3.0% in the Control group to 0.9% in the
Insulin group (p < 0.05), representing a relative reduction of
70.0%. In diabetics, the incidence was 5.6% in the Control
and 2.5% in the Insulin group (p = 0.25), representing a rela-
tive reduction of 56.1% (Table 3). Figure 5 compares the inci-
dence of 30-day mortality between both groups in both non-
diabetic and diabetic '0-RIF', 'RIF-D' and 'RIF+D' patients. In
non-diabetics, the 30-day mortality in 'RIF-D' patients was sig-
nificantly lower in the Insulin group than in the Control group
(0.8 vs 4.6%) (p = 0.02).
Discussion
The risk of renal injury and/or failure after cardiac surgery var-
ies between 5% to 30% and 1% to 5% of cardiac surgical
patients develop renal failure requiring dialysis [1]. This widely
varying incidence of renal failure is related to the heterogeneity
in study design and end points [16]. Recently, the RIFLE score
has been proposed as consensus criteria of the Acute Dialysis
Quality Initiative Workgroup [15] and has been validated in
cardiac surgery [11]. Because RIFLE provides a uniform clini-
cal definition for renal failure, we used this scoring system as
a sensitive tool to evaluate the effect of tight perioperative
BGL control. In the present study, tight perioperative glycemic
control is associated with a significant reduction in severe
RIFLE scoring.
Although our study design does not allow to conclude that
intraoperative tight glucose control as such has nephroprotec-
Figure 3
Percentage of patients with R, I or F (according to the RIFLE score) and postoperative dialysis throughout hospital stay, both in non-diabetic and dia-betic patientsPercentage of patients with R, I or F (according to the RIFLE score) and postoperative dialysis throughout hospital stay, both in non-diabetic and dia-
betic patients. Control, control group; F, renal failure; I, impairment of renal function; Insulin, group with tight glycemic control; R, risk for renal failure.
Figure 4
Comparison of the predicted vs the observed incidence of acute renal failure with the need for dialysis in non-diabetics between groupsComparison of the predicted vs the observed incidence of acute renal failure with the need for dialysis in non-diabetics between groups. 0 to 2, 3 to
5, represent the different risk classes for acute renal failure with dialysis, as defined by the Cleveland Clinic Severity Score: 0 to 2 representing a
predicted incidence of ARF with dialysis of 0.4%, 3 to 5 representing a predicted incidence of ARF with dialysis of 1.8%, 6 to 8 representing a pre-
dicted incidence of ARF with dialysis of 9.5%, 9 to 13 representing a predicted incidence of ARF with dialysis of 21.3%. Control, control group;
Insulin, group with tight glycemic control; predicted, the predicted risk for postoperative dialysis based on the Cleveland Clinic Severity Score.
Critical Care Vol 12 No 6 Lecomte et al.
Page 8 of 12
(page number not for citation purposes)
tive effects, it should be noted that by introducing intraopera-
tive BGL control, intraoperative hyperglycemia, an
independent risk factor for mortality [6], is avoided. Further-
more, BGL at ICU admission, a surrogate of subsequent glu-
cose control [17], is lower. By already imposing tight glycemic
control with insulin in the operating theatre, the target of BGL
control in the ICU is reached more quickly [14] as compared
to other studies that focused only on postoperative BGL con-
trol [4,18]. Some previous work has suggested that intraoper-
ative BGL control does not contribute to postoperative
outcome [7]. If so, then our results would be remarkable in the
sense that, for patients scoring R, I or F, a relatively short
period of postoperative BGL control would have such an
effect on renal failure (90% of patients were treated with the
Aalst Glycemia Insulin Protocol in the ICU for less than 46.0
h). Other groups have argued that the beneficial effects of
insulin are related to its anti-inflammatory and antioxidant prop-
erties rather than tight glycemic control. It has been shown that
2 h of insulin administration (2 IU/h) has similar anti-inflamma-
tory effects as 100 mg hydrocortisone intravenously [19]. In
patients with acute myocardial infarction, low-dose insulin has
anti-inflammatory, antioxidant and pro-fibrinolytic effects, inde-
pendently of a decrease in blood glucose levels [20]. In car-
diac surgical patients, C-reactive protein concentrations
decrease during high-dose insulin infusion but increase within
hours after insulin withdrawal [21]. However, Van den Berghe
et al. have reported that the improvement in outcome with low-
dose insulin infusion depends more on the reduction in plasma
glucose levels than on the dose of insulin administered in crit-
ically ill patients [22].
Implementing tight glycemic control is associated with an
increased risk of hypoglycemia. A recent meta-analysis in crit-
ically ill patients has demonstrated that intensive insulin ther-
apy is associated with a sixfold increase in the relative risk of
hypoglycemia [23] and as much as 5.1 to 17.0% of patients
develop glucose levels < 40 mg/dL [4,24]. Such incidence
and levels of hypoglycemia may mask potential benefits of
perioperative glucose control and were considered crucial to
stop ongoing trials early [24,25]. However, in a previous study
with the Aalst Glycemia Insulin Protocol, a dynamic algorithm
that adapts insulin dosage to intrinsic insulin sensitivity and
Table 3
Multinomial logistic analysis
RIF Survival
OR (CI) p Value OR (CI) p Value
Control group:
Non-diabetics
Aprotinin 0.9 (0.4 to 2.2) 0.79 2.3 (0.5 to 11.2) 0.30
ACE inihibitors 1.0 (0.6 to 1.8) 0.94 0.7 (0.2 to 2.8) 0.60
Transfusion 0.9 (0.5 to 1.7) 0.79 0.8 (0.1 to 5.9) 0.69
Diabetics
Aprotinin 0.9 (0.3 to 2.8) 0.94 0.5 (0.2 to 1.4) 0.32
ACE inihibitors 1.4 (0.5 to 3.6) 0.52 12.6 (1.4 to 109.2) 0.02
Transfusion 1.6 (0.5 to 5.9) 0.4 0.7 (0.07 to 7.3) 0.77
Insulin group:
Non-diabetics
Aprotinin 0.7 (0.4 to 1.1) 0.14 2.0 (0.5 to 9.7) 0.39
ACE inihibitors 0.4 (0.3 to 0.5) 0.001 0.7 (0.2 to 3.1) 0.70
Transfusion 0.7 (0.5 to 1.1) 0.15 1.0 (0.6 to 2.9) 0.58
Diabetics
Aprotinin 1.0 (0.3 to 2.8) 0.97 1.7 (0.3 to 5.8) 0.26
ACE inihibitors 1.2 (0.7 to 2.3) 0.65 3.4 (1.2 to 12.3) 0.001
Transfusion 1.5 (0.8 to 3.0) 0.25 1.0 (0.8 to 1.1) 0.92
ACE, angiotensin-converting enzyme; CI, confidence interval; OR, odds ratio; RIF, renal failure according to RIFLE (Risk of renal failure, Injury to
kidney function, Failure of kidney function, Loss of kidney function and End-stage renal failure) score criteria.
Available online />Page 9 of 12
(page number not for citation purposes)
Table 4
Perioperative data
Group Subgroup Control Insulin p Value
Study interval August to December 2004 June 2005 to June 2006
Procedure, n (%): CABG 97 (31.8) 218 (29.3) 0.41
Valve 132 (43.3) 291 (39.0) 0.21
Combined 76 (24.9) 236 (31.7) 0.03
Redo 43 (14.2) 104 (13.9) 1.0
Emergency 33 (10.9) 61 (8.2) 0.19
ICU length of stay (days), median (min-max) 2 (1 to 73) 2 (1 to 106) 0.61
Aprotinin usage, n (%) 29 (9.5) 103 (13.8) 0.06
Administration of intravenous diuretics into the ICU, n(%) 50 (16.4) 121 (16.2) 1.0
Patients with packed cell transfusion, n (%) 240 (78.7) 524 (70.3) 0.006
Packed cells per patient, median (min-max) 2 (0 to 18) 2 (0 to 19) 0.66
Blood glucose level (mg/dL): Induction 109 ± 39 104 ± 24 0.20
End of surgery 115 ± 25 108 ± 22 < 0.001
Admission to ICU 118 ± 29 107 ± 22 < 0.001
Mean in the ICU 133 ± 29 103 ± 15 < 0.0001
Serum creatinine levels (g/dL):
Non-diabetics Preoperative 1.0 ± 0.7 1.0 ± 0.5 0.99
Max in the ICU 1.3 ± 1.0 1.1 ± 0.6 0.09
Max post ICU 1.0 ± 1.0 0.9 ± 0.8 0.33
Diabetics Preoperative 1.0 ± 0.3 1.2 ± 1.1 0.11
Max in the ICU 1.3 ± 1.2 1.4 ± 1.0 0.31
Max post ICU 1.2 ± 1.7 1.3 ± 1.4 0.57
Morbidity, n (%):
Non-diabetics Cardiac 56 (24.0) 62 (10.6) < 0.0001
Renal 9 (3.9) 4 (0.7) < 0.01
Pulmonary 7 (3.0) 38 (6.5) 0.06
Infectious 23 (9.9) 25 (4.3) < 0.01
Other 9 (3.9) 24 (4.1) 1.0
Diabetics Cardiac 22 (31.4) 46 (28.4) 0.64
Renal 4 (5.7) 5 (3.1) 0.45
Pulmonary 6 (8.6) 15 (9.3) 1.0
Infectious 5 (7.1) 7 (4.3) 0.35
Other 2 (2.9) 8 (4.9) 0.72
30-day Mortality, n (%):
Non-diabetics 7 (3.0) 5 (0.9) < 0.05
Diabetics 4 (5.6) 4 (2.5) 0.25
Cause of death, n (%):
Cardiac 4 (36.4) 2 (22.2) 0.64
Respiratory 0 (0.0) 1 (11.1) 0.45
Sepsis 1 (9.1) 1 (11.1) 1.0
Multi organ failure 5 (45.4) 4 (44.4) 1.0
Other 1 (9.1) 1 (11.1) 1.0
Data are presented as mean ± SD or number (%) unless otherwise mentioned.
CABG, coronary artery bypass graft; ICU, Intensive Care Unit; SD, standard deviation.
Critical Care Vol 12 No 6 Lecomte et al.
Page 10 of 12
(page number not for citation purposes)
changes in BGL over time [14], hypoglycemia (BGL < 50 mg/
dL) occurred only in 0.7% of patients, with 40 mg/dL as low-
est value. The incidence of hypoglycemia in this study is com-
parable (0.7% of patients with BGL < 50 mg/dL).
It should be noted that in a recent meta-analysis including 29
studies (8,432 patients), tight glucose control was not associ-
ated with a significant reduction in hospital mortality or in new
need for hemodialysis [26]. However, the authors report a
markedly increased risk for hypoglycemia and in 21% of the
studies mean glucose target was not reached within 5 mg/dL.
Whether these 2 factors affect a potential benefit of tight gly-
cemic control is a matter of speculation. Because the combi-
nation of poorly performing algorithms and hypoglycemia is the
Achilles' heel of tight glycemic control, prospective rand-
omized trials using an algorithm that combines both adequate
tight glucose control with a minimal risk for hypoglycemia may
provide answers to these questions.
To the best of our knowledge, this is the first study that evalu-
ates the effect of perioperative glycemic control in cardiac sur-
gery, comparing the observed incidence of dialysis with that
predicted by the Cleveland Clinic Severity Score [12].
Although tight glycemic control did not reduce the incidence
of dialysis in patients at low risk, it successfully reduced the
need for dialysis in the severe (-87.5%) and high (-86.5%) risk
non-diabetic patients, as compared to the predicted inci-
dence. In patients at risk for acute kidney injury (that is,
patients scoring R, I or F but without the need for dialysis),
mean creatinine level between hospital admission and dis-
charge increased by 25% in the Control group but not in the
Insulin group. Even a slight increase in serum creatinine (0.5
mg/dL) after cardiac surgery predisposes to increased mortal-
ity [27]. Whether this is clinically relevant in a cardiac surgical
setting is still unknown. Also, the reason for the decreased risk
on renal failure in non-diabetics using angiotensin-converting
enzyme inhibitors is unknown to us. Similarly, the apparently
improved survival of diabetics using angiotensin-converting
enzyme inhibitors is remarkable. Whether this is clinically rele-
vant is unknown to us at this time, and our database does not
allow us to draw long-term conclusions due to the limited
number of diabetics in this analysis.
Mortality rates in excess of 50% have been reported in cardiac
surgical patients requiring dialysis [1,4]. Avoiding the need for
renal replacement therapy is probably a key factor in reducing
mortality. The observed 60% reduction in postoperative dialy-
sis in our Insulin group may have contributed to decreased
mortality rates. However, in patients that need hemodialysis,
tight glycemic control did not reduce mortality. The fact that
relatively short-term tight glycemic control during and after car-
diac surgery has such an impact on renal function and mortal-
ity is new, and to a certain extent in contrast to the findings of
Zerr and Furnary who showed beneficial effects after 48 h
[28,29]. This concept was confirmed by Van den Berghe,
showing that tight glycemic control is beneficial for patients
staying 3 days or more in the ICU [30]. However, we have pre-
viously demonstrated that intraoperative tight glycemic control
results in postoperative mean BGL between 80 to 110 mg/dL
within 1 h after ICU admission, and in a low BGL variability
Figure 5
Comparison of 30-day mortality between groupsComparison of 30-day mortality between groups. 0-RIF, patients without R, I or F score; RIF-D = patients scoring R(isk), I(mpairment) or F(ailure)
(accoding to the RIFLE score) but without the need for haemodialysis; RIF+D, patients requiring hemodialysis. Control, control group; Insulin, group
with tight glycemic control.
Available online />Page 11 of 12
(page number not for citation purposes)
[14]. The latter has been reported to be an independent pre-
dictor of ICU and hospital mortality [31]. Consequently, even
patients staying in the ICU for a short period of time would
benefit from tight glycemic control. But in another single-cen-
tre trial, tight glycemic control during cardiac surgery had no
effect on the incidence of renal failure [7]. However, in that
study, mean BGL did not reach the preset target of 80 to 100
mg/dL during surgery as well as in theICU. It is possible that
this observation, together with the fact that 15.0% of patients
in the control group did receive insulin, masks the potential
benefit of tight intraoperative glycemic control in their investi-
gation.
Finally, in our analysis, we acknowledge that statistical power
is not sufficient to draw conclusions on the effect of tight gly-
cemic on in-hospital outcome in diabetics. They suffer from a
chronic state of insulin resistance, with inhibition of the insulin-
signaling cascade by free fatty acids [32] or by inflammatory
cytokines, such as TNFα [33]. Short-term insulin treatment
may not be able to overcome these metabolic derangements
and fail to protect renal function.
Another limitation is that, although the data collection for the
Aalst Glycemia Insulin Protocol in all patients was prospec-
tively designed, the comparison between the Control and Insu-
lin groups was not randomized. Therefore this analysis remains
retrospective in nature. However, the Cleveland Clinic Severity
Score is a prospective score. The comparison of the observed
vs predicted incidence of acute renal failure requiring dialysis
is not affected by the retrospective nature of this study. The
findings of our retrospective analysis may be controversial with
respect to the time frame of tight glycemic control. However,
one could speculate that the beneficial effects of tight glyc-
emic control in patients that stay in the ICU for a relatively short
period of time may be attributed to in part by strict intraopera-
tive BGL control. Therefore, a prospective study is needed to
validate this concept.
Conclusion
Tight intra- and postoperative glucose control with intravenous
insulin is associated with a significant reduction in postopera-
tive renal impairment and injury according to the RIFLE criteria
in non-diabetic cardiac surgical patients. Despite of a relatively
short ICU-stay, the need for acute postoperative dialysis, as
well as 30-day mortality were significantly lower in non-diabet-
ics benefiting from tight glucose control.
Competing interests
The authors declare that they have no competing interests.
Authors' contributions
All authors actively participated in this study, read the manu-
script and attest to the validity and legitimacy of the data and
its interpretation.
Acknowledgements
We would like to thank the anesthetic nurses, perfusionists and inten-
sive care staff for their dedication and cooperation during this study. We
especially thank our study nurse K. Van Vaerenbergh for meticulously
retrieving the retrospective data.
References
1. Chertow G, Levy E, Hammermeister K, Grover F, Daley J: Inde-
pendent association between acute renal failure and mortality
following cardiac surgery. Am J Med 1998, 104:343-348.
2. Lok C, Austin P, Wang H, Ju T: Impact of renal insufficiency on
short-term and long-term outcomes after cardiac surgery. Am
Heart J 2004, 148:430-438.
3. Ouattara A, Lecomte P, Le Manach Y, Landi M, Jacqueminet S,
Platonov I, Bonnet N, Riou B, Coriat P: Poor intraoperative blood
glucose control is associated with a worsened hospital out-
come after cardiac surgery in diabetic patients. Anesthesiology
2005, 103:687-694.
4. Berghe G Van den, Wouters P, Weekers F, Verwaest C, Bruyn-
inckx F, Schetz M, Vlasselaers D, Ferdinande P, Lauwers P, Bouil-
lon R: Intensive insulin therapy in critically ill patients. N Engl
J Med 2001, 345:1359-1367.
5. Furnary AP, Gao G, Grunkemeier GL, Wu Y, Zerr KJ, Bookin SO,
Floten HS, Starr A: Continuous infusion reduces mortality in
patients with diabetes undergoing coronary artery bypass
grafting. J Thorac Cardiovasc Surg 2003, 125:1007-1021.
6. Doenst T, Wijeysundera D, Karkouti K, Zechner C, Maganti M, Rao
V, Borger M: Hyperglycemia during cardiopulmonary bypass is
an independent risk factor for mortality in patients undergoing
cardiac surgery. J Thorac Cardiovasc Surg 2005,
130:1144-1150.
7. Ghandi G, Nuttall G, Abel M, Mullany C, Schaff H, O'Brien P, John-
son M, Williams A, Cutshall S, Mundy L, Rizza R, Mc Mahon M:
Intensive intraoperative insulin therapy versus conventional
glucose management during cardiac surgery. Ann Intern Med
2007, 146:233-243.
8. Han H, Lee Y, Park S, Lee J, Taub M: High glucose-induced oxi-
dative stress inhibits Na
+
/glucose cotransporter activity in
renal proximal tubule cells. Am J Physiol Renal Physiol 2005,
288:F988-F996.
9. Baines A, Ho P: Glucose stimulates O
2
consumption, NOS and
Na
+
/H exchange in diabetic rat proximal tubules. Am J Physiol
Renal Physiol 2002, 283:F286-F293.
10. Bellomo R, Ronco C, Kellum J, Metha R, Pavelsky P, the ADQI
workgroup: Acute Renal failure – definition, outcome meas-
ures, animal models, fluid therapy and information technology
needs: the Second International Consensus Conference on
the Acute Dialysis Quality Initiative (ADQI) Group. Crit Care
2004, 8:R204-R212.
Key messages
• In non-diabetic cardiac surgical patients, tight blood
glucose control is associated with a decreased inci-
dence of renal impairment and postoperative dialysis
according to RIFLE criteria, as well as 30-day mortality.
• Improved renal outcome associated with tight glycae-
mic control is present even after a relatively short ICU
stay.
• In diabetic cardiac surgical patients, tight glycaemic
control is not associated with improved renal outcome
or 30-day mortality.
• The observed overall incidence of acute postoperative
dialysis in patients with perioperative tight glycaemic
control is lower than predicted by the Cleveland Clinic
Severity Score.
Critical Care Vol 12 No 6 Lecomte et al.
Page 12 of 12
(page number not for citation purposes)
11. Kuitunen A, Vento A, Suojaranta-Ylinen R, Petilla V: Acute renal
failure after cardiac surgery: evaluation of the RIFLE classifica-
tion. Ann Thorac Surg 2006, 81:542-546.
12. Thakar C, Arrigain S, Worley S, Yared J-P, Paganini E: A clinical
score to predict acute renal failure after cardiac surgery. J Am
Soc Nephrol 2005, 16:162-168.
13. Genuth S, Alberti KG, Bennett P, Buse J, Defronzo R, Kahn R, Kitz-
miller J, Knowler WC, Lebovitz H, Lernmark A, Nathan D, Palmer J,
Rizza R, Saudek C, Shaw J, Steffes M, Stern M, Tuomilehto J, Zim-
met P, Expert Committee on the Diagnosis and Classification of
Diabetes Mellitus: Follow-up report on the diagnosis of diabe-
tes mellitus. Diabetes Care 2003, 26:3160-3167.
14. Lecomte P, Foubert L, Nobels F, Coddens J, Nollet G, Casselman
F, Van Crombrugge P, Vandenbroucke G, Cammu G: Dynamic
tight glycemic control during and after cardiac surgery is effec-
tive, feasible and safe. Anesth Analg 2008, 107:51-58.
15. Levey A, Bosch J, Lewis J, Greene T, Rogers N, Roth D: A more
accurate method to estimate glomerular filtration rate from
serum creatinine: a new prediction equation. Modification of
Diet in Renal Disease Study Group. Ann Intern Med 1999,
130:461-470.
16. Zacharias M, Gilmore I, Herbison G, Sivalingam P, Walker R: Inter-
ventions for protecting renal function in the perioperative
period. Cochrane Database Syst Rev 2005:CD003590.
17. Egi M, Bellomo R, Stachowski E, French G, Hart G, Stow P: Blood
glucose on day of intensive care unit admission as a surrogate
of subsequent glucose control in intensive care. J Crit Care
2006, 21:197-202.
18. Goldbergh P, Sakharova O, Barrett P, Falko L, Roussel M, Bak L,
Blake-Holmes D, Marieb N, Inzucchi S: Improving glycemic con-
trol in cardiothoracic intensive care unit: clinical experience in
two hospital setting. J Cardiothorac Vasc Anesth 2004,
18:690-697.
19. Dandona P, Thusu K, Hafeez R, Abdel-Rahman E, Chaudhuri A:
Effect of hydrocortisone on oxygen free radical generation by
mononuclear cells. Metabolism 1998, 47:788-791.
20. Chaudhuri A, Janicke D, Wilson M, Tripathy D, Garg R, Bandyo-
padhyay A, Calieri J, Hoffmeyer D, Syed T, Ghanim H, Aljada A,
Dandona P: Anti-inflammatory and pro-fibrinolytic effect of
insulin in acute ST-elevation myocardial infarction. Circulation
2004, 109:849-854.
21. Visser L, Zuurbier J, Hoek F, Opmeer B, de Jonge E, de Mol B, van
Wezel H: Glucose, insulin and potassium applied as perioper-
ative hyperinsulinaemic normoglycaemic clamp: effects on
inflammatory response during coronary artery surgery. Br J
Anaesth 2005, 95:448-457.
22. Vanhorebeek I, De Vos R, Mesotten D, Wouter P, De Wolf P,
Berghe G Van den: Protection of hepatocyte mitochondrial
ultrastructure and function by strict blood glucose control with
insulin in critically ill patients. Lancet 2005, 365:53-59.
23. Thomas G, Rojas M, Epstein S, Balk E, Liangos O, Jaber B: Insulin
therapy and acute kidney injury in critically ill patients – a sys-
tematic review. Nephrol Dial Transplant 2007, 22:2849-2255.
24. Brunkhorst F, Engel C, Bloos F, Meier-Hellmann A, Ragaller M,
Weiler N, oerer O, Gruendling M, Oppert M, Grond S, Olthoff D,
Jaschinski U, John S, Rossaint R, Welt T, Schaefer M, Kern P,
Kuhnt E, Kiehntopf M, Hartog C, Natason C, Loefler M, Reinhart K,
German Competence Network Sepsis (SepNet): Intensive Insu-
lin Therapy and Pentastarch Resuscitation in severe sepsis. N
Engl J Med 2008, 358:125-139.
25. Chaney M, Nikolov M, Blakeman B, Bakhos M: Attempting to
maintain normoglycemia during cardiopulmonary bypass with
insulin may initiate postoperative hypoglycemia. Anesth Analg
1999, 89:1091-1095.
26. Wiener R, Wiener D, Larson R: Benefits and risks of tight glu-
cose control in critically ill adults. JAMA 2008, 300:933-944.
27. Lassnigg A, Schmidlin D, Mouhieddine M, Bachmann L, Druml W,
Bauer P, Hiesmayr M: Minimal changes of serum creatinine
predit prognosis in patients after cardiothoracic surgery: a
prospective cohort study. J Am Soc Nephrol 2004,
15:1597-1605.
28. Zerr K, Furnary A, Grinkemeier G, Bookin S, Kanhere V, Starr A:
Glucose control lowers the risk of wound infection in diabetics
after open heart operations. Ann Thorac Surg 1997,
63:356-361.
29. Furnary A, Zerr K, Grunkemeier G, Starr A: Continuous intrave-
nous insulin infusion reduces the incidence of deep sternal
wound infection in diabetic patients after cardiac surgical pro-
cedures. Ann Thorac Surg 1999, 67:352-362.
30. Berghe G Van den, Wilmer A, Hermans G, Meerseman W, Wout-
ers P, Milants I, Van Wijngaerdeen E, Bobbaers H, Bouillon R:
Intensive insulin therapy in the medical ICU.
N Engl J Med
2006, 354:449-461.
31. Egi M, Bellomo R, Stachowski E, French C, Hart G: Variability of
blood glucose concentration and short-term mortality in criti-
cally ill patients. Anesthesiology 2006, 105:244-252.
32. Yu C, Chen Y, Cline G, Zhang D, Zong H, Wang Y, Bergeron R,
Kim J, Cushman S, Cooney G, Atcheson B, White M, Kraegen E,
Shulman G: Mechanism by which fatty acids inhibit insulin acti-
vation of insulin receptor substrate-1 (IRS-1)-associated
phosphatidylinositol 3-kinase activity in muscle. J Biol Chem
2002, 277:50230-50236.
33. Hatanaka E, Monteagudo P, Marrocos M, Campa A: Neutrophils
and monocytes as potentially important sources of proinflam-
matory cytokines in diabetes. Clin Exp Immunol 2006,
146:443-447.