Báo cáo y học: "Benefits of intensive insulin therapy on neuromuscular complications in routine daily critical care practice: a retrospective study" docx
Bạn đang xem bản rút gọn của tài liệu. Xem và tải ngay bản đầy đủ của tài liệu tại đây (335.47 KB, 12 trang )
Open Access
Available online />Page 1 of 12
(page number not for citation purposes)
Vol 13 No 1
Research
Benefits of intensive insulin therapy on neuromuscular
complications in routine daily critical care practice: a retrospective
study
Greet Hermans
1
*, Maarten Schrooten
2
*, Philip Van Damme
2,3
, Noor Berends
4
,
Bernard Bouckaert
4
, Wouter De Vooght
2
, Wim Robberecht
2,3
and Greet Van den Berghe
4
1
Medical Intensive Care Unit, Department of Internal Medicine, University Hospitals Leuven, Catholic University Leuven, Herestraat 49, B-3000
Leuven, Belgium
2
Department of Neurology, University Hospitals Leuven, Catholic University Leuven, Herestraat 49, B-3000 Leuven, Belgium
3
Laboratory for Neurobiology, Department of Experimental Neurology, Flemish Institute for Biotechnology, Catholic University Leuven, Herestraat 49,
B-3000 Leuven, Belgium
4
Department of Intensive Care Medicine, University Hospitals Leuven, Catholic University Leuven, Herestraat 49, B-3000 Leuven, Belgium
* Contributed equally
Corresponding author: Greet Van den Berghe,
Received: 24 Aug 2008 Revisions requested: 14 Oct 2008 Revisions received: 9 Nov 2008 Accepted: 24 Jan 2009 Published: 24 Jan 2009
Critical Care 2009, 13:R5 (doi:10.1186/cc7694)
This article is online at: />© 2009 Hermans et al.; licensee BioMed Central Ltd.
This is an open access article distributed under the terms of the Creative Commons Attribution License ( />),
which permits unrestricted use, distribution, and reproduction in any medium, provided the original work is properly cited.
Abstract
Introduction Intensive insulin therapy (IIT) reduced the
incidence of critical illness polyneuropathy and/or myopathy
(CIP/CIM) and the need for prolonged mechanical ventilation
(MV ≥ 14 days) in two randomised controlled trials (RCTs) on
the effect of IIT in a surgical intensive care unit (SICU) and
medical intensive care unit (MICU). In the present study, we
investigated whether these effects are also present in daily
clinical practice when IIT is implemented outside of a study
protocol.
Methods We retrospectively studied electrophysiological data
from patients in the SICU and MICU, performed because of
clinical weakness and/or weaning failure, before and after
routine implementation of IIT. CIP/CIM was diagnosed by
abundant spontaneous electrical activity on electromyography.
Baseline and outcome variables were compared using
Student's t-test, Chi-squared or Mann-Whitney U-test when
appropriate. The effect of implementing IIT on CIP/CIM and
prolonged MV was assessed using univariate analysis and
multivariate logistic regression analysis (MVLR), correcting for
baseline and ICU risk factors.
Results IIT significantly lowered mean (± standard deviation)
blood glucose levels (from 144 ± 20 to 107 ± 10 mg/dl, p <
0.0001) and significantly reduced the diagnosis of CIP/CIM in
the screened long-stay patients (125/168 (74.4%) to 220/452
(48.7%), p < 0.0001). MVLR identified implementing IIT as an
independent protective factor (p < 0.0001, odds ratio (OR):
0.25 (95% confidence interval (CI): 0.14 to 0.43)). MVLR
confirmed the independent protective effect of IIT on prolonged
MV (p = 0.002, OR:0.40 (95% CI: 0.22–0.72)). This effect was
statistically only partially explained by the reduction in CIP/CIM.
Conclusions Implementing IIT in routine daily practice in
critically ill patients evoked a similar beneficial effect on
neuromuscular function as that observed in two RCTs. IIT
significantly improved glycaemic control and significantly and
independently reduced the electrophysiological incidence of
CIP/CIM. This reduction partially explained the beneficial effect
of IIT on prolonged MV.
Introduction
Critical illness polyneuropathy (CIP) is an acute and primary
axonal motor and sensory neuropathy that typically occurs in
critically ill patients as a complication of their illness and
APACHE: acute physiology and health evaluation; CI: confidence interval; CIP/CIM: critical illness polyneuropathy and/or myopathy; CMAPs: com-
pound muscle action potentials; EMG: needle electromyography; IIT: intensive insulin therapy; MICU: medical intensive care unit; MOF: multiple organ
failure; MV: mechanical ventilation; MVLR: multivariate logistic regression analysis; NCS: nerve conduction studies; OR: odds ratio; RCT: randomised
controlled trial; SICU: surgical intensive care unit; SIRS: systemic inflammatory response syndrome; SNAP: sensory nerve action potential.
Critical Care Vol 13 No 1 Hermans et al.
Page 2 of 12
(page number not for citation purposes)
possibly its therapy [1]. The signs and symptoms are not
always easily distinguished from critical illness myopathy
(CIM), which is a primary muscle disease that may occur in the
same setting [2]. Both CIP and CIM also frequently occur
simultaneously [3-5], and therefore, from a clinical point of
view, both are often grouped together as critical illness
polyneuropathy and/or myopathy (CIP/CIM). They result in
limb and respiratory muscle weakness, causing difficulty in
weaning from the ventilator and impaired rehabilitation [6-9].
CIP/CIM is therefore associated with prolonged intensive care
unit (ICU) and hospital stay and increased mortality rates
[6,8,10]. Differentiation between both conditions is possible in
some patients using nerve conduction studies (NCS) and nee-
dle electromyography (EMG). However, the differential diag-
nosis between CIP and CIM on routine electrophysiological
examination is frequently hampered by tissue oedema, interfer-
ing with correct sensory nerve action potential (SNAP)
assessment, and the inability to voluntarily contract muscles,
interfering with correct motor unit potential analysis.
The pathophysiology of CIP/CIM is very complex and many
factors and mechanisms, such as electrical, microvascular,
metabolic alterations, bioenergetic failure and altered Ca
2+
homeostasis, have been suggested to explain the observed
changes in the neural and muscular system [11]. Also, differ-
ent risk factors for CIP/CIM development have been identified
in several prospective studies. These include systemic inflam-
matory response syndrome (SIRS) and multiple organ failure
(MOF), in which severity of illness [4,12] and duration of organ
dysfunction [13] seem to be crucial. Other risk factors identi-
fied include hyperglycaemia [14,15], vasopressor and cate-
cholamine support [15], neuromuscular blocking agents [9],
corticosteroids [13], female sex [13], hypoalbuminaemia [14],
parenteral nutrition [10], hyperosmolarity [10], renal replace-
ment therapy [10], duration of ICU stay [14,15] and central
neurological failure [10]. Not all risk factors have been consist-
ently identified and many remain controversial.
Until recently, prevention of CIP/CIM was solely based on min-
imising the effects of these identified risk factors. However, in
two randomised controlled trials (RCTs) in a surgical ICU
(SICU) [15] and medical ICU (MICU) [9], our group has dem-
onstrated that intensive insulin therapy (IIT) aimed at blood glu-
cose levels between 80 and 110 mg/dl, significantly reduced
the electrophysiological incidence of CIP/CIM and also the
need for prolonged mechanical ventilation (MV) in the subpop-
ulation of patients with an ICU stay of at least one week.
Indeed, hyperglycaemia had been previously identified to be
associated with CIP/CIM development. Potential mechanisms
are impairment of the microcirculation in the nerve and mito-
chondrial dysfunction because of an increased generation/
deficient scavenging of reactive oxygen species. In addition,
insulin itself may have some benefits by affecting the balance
between anabolic and catabolic hormones.
As the beneficial effect of IIT has been observed in the setting
of RCTs, we further studied whether the implementation of IIT
in routine daily ICU practice and outside a study protocol
would result in similar beneficial effects on neuromuscular
electrophysiology.
Materials and methods
We retrospectively evaluated all electronically available elec-
trophysiological data derived from NCS/EMG in patients in the
SICU and MICU before and after implementation of IIT in rou-
tine clinical practice. For this purpose, only NCS/EMG per-
formed because the treating physician noticed a clinical
problem of weakness and/or weaning failure were selected
and therefore the study sample comprised only a subset of the
long-stay ICU population. We diagnosed CIP/CIM solely
based on the presence of abundant spontaneous electrical
activity in the form of positive sharp waves and/or fibrillation
potentials. Excluded from the study were patients with an
NCS/EMGs suggesting diagnoses other than CIP/CIM,
patients under the age of 18 and those with technically incon-
clusive examinations, as well as all data of patients included in
the previous RCTs.
To explore the effects of IIT on CIP versus CIM, we compared
patients in whom reliable contraction patterns could be
obtained, allowing identification of primarily myopathic pathol-
ogy. However, this can not be achieved in all patients.
Because reduction in amplitude of the SNAPs are suggestive
of CIP (and not encountered in pure CIM without accompany-
ing CIP) we also studied the SNAPs before and after imple-
mentation of IIT. Finally, the need for prolonged MV, defined as
MV for at least 14 days, as in the previous trials [9,15], was
recorded. This study was approved by the local ethics commit-
tee. As it concerned retrospective analysis of data obtained
during usual clinical practice, local regulations do not require
informed consent to be obtained.
Statistics
Data were analysed using Statview 5.0 (SAS Institute, Inc.,
Cary, NC). Baseline and outcome variables are presented as
mean ± standard deviation if normally distributed, and median
and interquartile range if skewed. Data were compared using
Student's t-test, Chi-squared test or Mann-Whitney U test
when appropriate. The effect of implementing IIT in daily prac-
tice on CIP/CIM and prolonged mechanical ventilation was
assessed using univariate analysis. Next, also multivariate
logistic regression analysis (MVLR) was used to evaluate the
effect of IIT on CIP/CIM and prolonged MV. We included in
the model, all baseline factors and risk factors that occurred
during ICU stay that either showed an imbalance between the
groups before and after implementation of IIT (p ≤ 0.1) or
showed at least a trend in the univariate analysis (p ≤ 0.1) on
CIP/CIM, respectively prolonged mechanical ventilation.
Available online />Page 3 of 12
(page number not for citation purposes)
Results
Patient characteristics
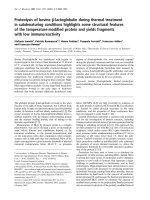
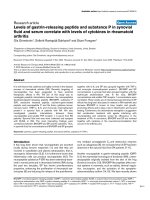
After excluding other diagnoses, NCS/EMGs of a total of 620
patients performed because of weakness and/or weaning fail-
ure were included in the analysis (Figures 1 and 2). This
included 168 patients in the ICU before and 452 after the
implementation of IIT. The proportion of patients receiving
NCS/EMGs before and after the RCTs and the implementa-
tion of IIT in daily practice was not different (MICU before:
5.3%, after: 5.6%, SICU before: 4.0% after: 3.9%). Baseline
characteristics of these patients are shown in Table 1.
The studied sample comprised of a subset of long-stay
patients as the median duration to the time of electrophysio-
logical diagnosis was 18 (12 to 28) days before and 21 (13 to
32) days after implementation of IIT. As expected, both groups
differed in multiple baseline characteristics such as proportion
of medical patients, diagnostic group on admission, acute
physiology and health evaluation (APACHE) II score and on
admission blood glucose. Also exposure to known risk factors
for CIP/CIM during ICU stay (Table 2) was different before and
after IIT, such as treatment with noradrenaline, aminoglyco-
sides, glucocorticoids and neuromuscular blocking agents.
This necessitated MVLR analysis to correct for these imbal-
ances, which were due to greater percentage of MICU
patients in the 'before' than in the 'after' sample.
Glycaemia control and general outcome
We noticed a significant reduction of mean morning blood glu-
cose from 144 ± 20 mg/dl before to 107 ± 10 mg/dl after IIT
had become routine daily practice (p < 0.0001; Table 3). This
significant difference was present in the medical as well as in
the surgical ICU. There was no significant difference in dura-
tion of ICU stay, hospital stay, mortality rates, duration of
mechanical ventilation and need for prolonged mechanical
ventilation in the studied sample.
Electrophysiological data
We found the incidence of CIP/CIM as defined above in the
patients who were electrophysiologically evaluated, to be sig-
Figure 1
CONSORT diagram of the studyCONSORT diagram of the study. IIT = intensive insulin therapy; MICU = medical intensive care unit; SICU = surgical intensive care unit.
Critical Care Vol 13 No 1 Hermans et al.
Page 4 of 12
(page number not for citation purposes)
nificantly reduced from 125/168 (74.4%) to 220/452
(48.7%) after IIT (p < 0.0001). This reduction was present
among MICU patients (76/106 (71.7%) to 11/38 (28.9%), p
< 0.0001) as well as SICU patients (49/62 (79.0%) to 209/
414 (50.5%), p < 0.0001). After correction for baseline risk
factors and risk factors occurring during ICU stay (Table 4),
MVLR analysis showed that the implementation of IIT was
indeed an independent protective factor for the occurrence of
CIP/CIM (odds ratio (OR) 0.25 (95% confidence interval (CI):
0.14 to 0.43), p < 0.0001; Table 5). Furthermore, in the upper
limbs, absolute and relative values of SNAPs were significantly
improved after IIT (p = 0.002). In the lower limbs, the average
SNAP was about 1 μV higher in the IIT group, but this differ-
ence was not significance.
The proportion of patients in whom voluntary contraction pat-
terns could be obtained was not different between both
patient groups (90/168 (53.6%) before and 247/452 (54.6%)
after IIT, p = 0.8). However, the presence of a myopathic com-
ponent in the tracings obtained, was significantly lower after
IIT (27/90 (30%) versus 45/247 (18.2%), p = 0.02).
Prolonged mechanical ventilation
In the univariate analysis, no significant reduction in the need
for prolonged MV was noticed in this patient sample after insti-
tuting IIT (before: 84/142 (59.2%), after: 259/399 (64.9%), p
= 0.2). MVLR, however, showed that after correction for base-
line risk factors and risk factors occurring during ICU stay
(Table 4), the implementation of IIT was indeed an independ-
ent protective factor for prolonged MV (OR 0.40 (95% CI:
0.22 to 0.72), p = 0.002; Table 5). Another independent pro-
tector was MICU, whereas independent risk factors were
number of days treatment with noadrenaline, treatment with
aminoglycosides, number of days treatment with neuromuscu-
lar blocking agents, number of days treatment with dialysis and
bacteraemia. To examine the impact of the reduced incidence
of CIP/CIM after IIT on the need for prolonged MV, this varia-
ble was entered into the multivariate model. This analysis
showed that, first of all, CIP/CIM was an independent risk fac-
tor for prolonged MV (OR:1.61(95% CI: 1.05 to 2.45), p =
0.03), and that the beneficial effect of IIT on prolonged MV
remained present after this correction (OR: 0.49 (95% CI:
0.26 to 0.92), p = 0.03).
Discussion
This is a retrospective analysis, which was conducted to exam-
ine whether the beneficial effects of IIT on neuromuscular func-
tion of critically ill patients, as was observed in two RCTs in
SICU and MICU patients, could be confirmed in routine daily
practice. We therefore compared electrophysiological data
and data on prolonged MV from patients screened for clinical
reasons before the RCTs and after, at which moment IIT was
implemented in routine daily practice. This population com-
prised a subset of long-stay ICU patients.
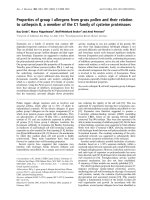
Figure 2
Chronological order of the studyChronological order of the study. Data were collected from patients in both intensive care units (ICUs) before the randomised controlled trials
(RCTs). After the trials intensive insulin treatment was implemented in both ICUs. EMG = needle electromyography; IIT = intensive insulin therapy;
MICU = medical intensive care unit; NCS = nerve conduction studies; SICU = surgical intensive care unit.
Available online />Page 5 of 12
(page number not for citation purposes)
As the surgical trial was performed earlier than the medical
trial, most data before implementation are derived from the
MICU and most data after from the SICU. The very different
patient population admitted to the MICU and SICU created a
large imbalance between baseline characteristics and also
known risk factors for CIP/CIM encountered during ICU stay
between both groups. As shown in Tables 1 and 2, most of the
imbalances are completely attributable to the different per-
centages of medical and surgical patients before and after IIT
implementation. Strikingly, however, on admission blood glu-
cose was significantly lower after implementation of IIT in the
MICU as well as in the SICU, suggesting that in general and
also outside the ICU more attention was given to glucose con-
trol. To correct for the differences in patient populations and
possible changes over time in therapeutic regimens, further
analyses on risk factors were corrected for all baseline charac-
teristics and risk factors occurring during ICU stay showing at
least a trend towards significance in the univariate analysis.
Table 1
Baseline characteristics of the studied sample of long-stay patients
Total population n = 620 Surgical intensive care unit n = 476 Medical intensive care unit n = 144
Before IIT n
= 168
After IIT n =
452
p-value Before IIT n
= 62
After IIT n =
414
p-value Before IIT n
= 106
After IIT n =
38
p-value
Male/female sex, n
(%)
105/168
(62.5)
305/452
(67.5)
0.2 41/62 (66.1) 285/414
(68.8)
0.7 64/106
(60.4)
20/38 (52.6) 0.4
Age, years (mean ±
SD)
61 ± 15 62 ± 14 0.4 64 ± 13 63 ± 14 0.6 60 ± 15 61 ± 17 0.9
ICU type/MICU
total n (%)
106/168
(63.1)
38/452 (8.4) < 0.0001
Diagnostic group,
total n (%) of the
category
< 0.0001 0.1
Abdominal/gastro-
intestinal/liver
19/71 (26.8) 52/71 (73.2) 6/55 (10.9) 49/55 (89.1) 13/16 (81.3) 3/16 (18.7)
Cardiovascular 24/171
(14.0)
147/171
(86.0)
21/167
(12.6)
146/167
(87.4)
3/4 (75.0) 1/4 (25.0)
Cerebral/
neurological
6/60 (10.0) 54/60 (90.0) 2/52 (3.8) 50/52 (96.2) 4/8 (50.0) 4/8(50.0)
Haematological/
oncol ogy/
transplant
3/31 (9.7) 28/31 (90.3) 2/29 (6.9) 27/29 (93.1) 1/2 (50.0) 1/2 (50.0)
Other 32/73 (43.8) 41/73 (56.2) 10/43 (23.3) 33/43 (76.7) 22/30 (73.3) 8/30 (26.7)
Polytrauma 6/37 (16.2) 31/37 (83.8) 6/37 (16.2) 31/37 (83.8) 0/0 0/0
Respiratory/
thoracic
61/136
(44.9)
75/136
(55.1)
8/64 (12.5) 56/64 (87.5) 53/72 (73.6) 19/72 (26.4)
History of diabetes,
total n (%)
0.2 0.9 0.07
Insulin treated 11/151 (7.3) 26/420 (6.2) 3/55 (5.5) 23/384 (6.0) 8/96(8.3) 3/36 (8.3)
Oral antidiabetic
treatment and/or
diet
16/151
(10.6)
26/420 (6.2) 3/55 (5.5) 26/384 (6.8) 13/96 (13.5) 0/36 (0)
Baseline APACHE
II, (mean ± SD)
19.0 ± 8.3 16.2 ± 7.1 < 0.0001 14.6 ± 6.7 15.7 ± 6.9 0.3 21.7 ± 8.1 21.5 ± 7.5 0.9
On admission
blood glucose, mg/
dl median (IQR)
157 (126 to
202)
134 (107 to
172)
< 0.0001 163 (126 to
199)
135 (109 to
173)
0.007 151 (126 to
202)
124 (96 to
156)
0.008
On admission
mechanical
ventilation, total n
(%)
133/140
(95.0)
402/413
(97.3)
0.2 55/55 (100) 375/381
(98.4)
0.3 78/85 (91.8) 27/32 (84.4) 0.2
APACHE = acute physiology and health evaluation; IIT = intensive insulin therapy; IQR = interquartile range; MICU = medical intensive car unit; n
= number; SD = standard deviation.
Critical Care Vol 13 No 1 Hermans et al.
Page 6 of 12
(page number not for citation purposes)
First of all we found that IIT in routine daily care is feasible and
reduced mean morning blood glucose levels to values within
the target range. As in the RCTs, we found that the incidence
of CIP/CIM was markedly and to the same extent reduced
after IIT became part of routine care in our critically ill patients.
MVLR showed that this was indeed an independent protective
effect. In this study, we diagnosed CIP/CIM solely based on
the presence of abundant spontaneous electrical activity. We
chose to do so first of all because compound muscle action
potentials (CMAPs) and SNAPs may be aspecific in the ICU
Table 2
incidence known risk factors for CIP/CIM, occurring during ICU stay
Total population n = 620 Surgical ICU n = 476 Medical ICU n = 144
Before IIT n
= 168
After IIT n =
452
p- value Before IIT n
= 62
After IIT n =
414
p-value Before IIT n
= 106
After IIT n =
38
p-value
Treatment with
noradrenaline
Treated patients,
total n (%)
84/142
(59.2)
345/399
(86.5)
< 0.0001 37/53
(69.8)
319/366
(87.2)
< 0.0001 47/89
(52.8)
26/33
(78.8)
0.007
Number of days
treatment, median
(IQR)
2(0 to 9) 8 (3 to 16) < 0.0001 6(0 to 15) 9(4 to 17) 0.03 1(0 to 6) 9(4 to 17) 0.03
Treatment with
aminoglycosides
Treated patients,
total n (%)
45/142
(31.7)
82/399
(20.6)
0.007 14/53
(26.4)
76/366
(20.8)
0.3 31/89
(34.8)
6/33 (18.2) 0.08
Number of days
treatment, median
(IQR)
0 (0 to 1) 0 (0 to 0) 0.08 0 (0 to 1) 0 (0 to 0) 0.5 0 (0 to 1) 0 (0 to 0) 0.2
Treatment with
glucocorticoids
Treated patients,
total n (%)
93/142
(65.5)
201/399
(50.4)
0.002 30/53
(56.6)
177/366
(48.4)
0.3 63/89
(70.8)
24/33
(72.7)
0.04
Number of days
treatment, median
(IQR)
4.5 (0 to 12) 1 (0 to 11) 0.02 1(0 to 12) 0(0 to 11) 0.6 6(0 to 12) 5(0 to 11) 0.6
Cumulative dose
hydrocortisone
equivalent mg
(IQR)
945 (0 to
4350)
50 (0 to
2100)
0.001 300 (0 to
3009)
0 (0 to
1725)
0.3 1125 (0 to
5181)
833 (0 to
2695)
0.3
Treatment with
NMBA
Treated patients
prolonged (min
3d bolus or drip)
total n (%)
37/142
(26.1)
129/399
(32.3)
0.2 15/53
(28.3)
121/366
(33.1)
0.5 22/89
(24.7)
8/33 (24.2) 0.9
Number of days
treatment at least
1 bolus or drip,
median (IQR)
1 (0 to 3) 2 (1 to 4) 0.006 2 (0 to 4) 2 (1 to 4) 0.6 1 (0 to 3) 1 (0 to 2) 0.8
Dialysis,
Yes 41/142
(28.9)
149/399
(37.3)
0.07 18/53
(34.0)
142/366
(38.8)
0.5 23/89
(25.8)
7/33 (21.2) 0.6
d, median (IQR) 0 (0 to 3) 0 (0 to 9) 0.06 0 (0 to 9) 0 (0 to 11) 0.6 0 (0 to 1) 0 (0 to 0) 0.7
Bacteraemia, yes,
total n (%)
54/142
(38.0)
135/399
(33.8)
0.4 24/53
(45.3)
119/366
(32.5)
0.07 30/89
(33.7)
16/33
(48.5)
0.1
Time to diagnosis,
days median (IQR)
18 (12 to
28)
21 (13 to
32)
0.01 21 (15 to
34)
22 (14 to
32)
0.7 15 (9 to 25) 12 (8 to 18) 0.2
CIM = critical illness myopathy; CIP = critical illness polyneuropathy; IIT = intensive insulin therapy; IQR = interquartile range; ICU = intensive car
unit; n = number; NMBA = neuromuscular blocking agent.
Available online />Page 7 of 12
(page number not for citation purposes)
setting due to technical problems, oedema, difficult access to
nerves due to wound dressings etc., whereas the presence of
abnormal spontaneous electrical activity indicates without any
question that a neuromuscular problem is present. In contrast
to other myopathies, abnormal spontaneous electrical activity
is often present in CIM. Also, by using the same definition as
in the RCTs, results could be compared.
Table 3
Outcome characteristics of the studied sample of long-stay patients
Total population n = 620 Surgical ICU n = 476 Medical ICU n = 144
Outcome before
and after IIT
Before IIT n
= 168
After IIT n
= 452
p- value Before IIT
n = 62
After IIT n
= 414
p- value Before IIT n
= 106
After IIT n
= 38
p- value
General outcome
Mean glyc mg/dl,
(mean ± SD)
144 ± 20 107 ± 10 < 0.0001 142 ± 18 107 ± 10 < 0.0001 145 ± 21 111 ± 15 < 0.0001
ICU stay, days,
median (IQR)
37 (22 to
54)
41 (25 to
61)
0.07 45 (27 to
77)
41 (27 to
61)
0.4 32 (20 to
50)
24 (16 to
52)
0.3
Hospital stay, days,
median (IQR)
61 (33 to
106)
60 (42 to
98)
0.4 74 (38 to
130)
61 (43 to
100)
0.3 50 (32 to
95)
47 (27 to
78)
0.4
Hospital mortality,
total n (%)
66/152
(43.4)
170/425
(40.0)
0.5 23/54
(42.6)
154/389
(39.6)
0.7 43/98
(43.9)
16/36
(44.4)
0.9
Mechanical
ventilation ≥ 14 days,
total n (%)
84/142
(59.2)
259/399
(64.9)
0.2 38/53
(71.7)
248/366
(67.8)
0.6 46/89
(51.7)
11/33
(33.3)
0.07
Electrophysiological
data
Spontaneous
electrical activity
present, total n (%)
125/168
(74.4)
220/452
(48.7)
< 0.0001 49/62
(79.0)
209/414
(50.5)
< 0.0001 76/106
(71.7)
11/38
(28.9)
< 0.0001
SNAP UL
absolute value
(uV), median
(IQR)
6 (0 to 10) 8 (4–13) 0.0002 6 (3–9) 8 (4–13) 0.02 6 (0–10) 6 (4–13) 0.08
percentage of
normal median
(IQR)
75 (0 to
125)
100 (50 to
162)
0.0002 75 (34 to
113)
100 (50 to
163)
0.02 75 (0 to
125)
80 (50 to
163)
0.08
SNAP LL
absolute value
(uV), median
(IQR)
4 (0 to 8) 5 (0 to 8) 0.3 5 (0 to 8) 5 (0 to 8) 0.3 2 (0 to 6) 5 (0 to 8) 0.1
percentage of
normal median
(IQR)
83 (0 to
200)
100 (0 to
200)
0.5 133 (0 to
250)
100 (0 to
200)
0.09 27 (0 to
163)
102 (0 to
197)
0.1
Voluntary motor unit
potential recruitment
obtained, total n (%)
90/168
(53.6)
247/452
(54.6)
0.8 36/62
(58.1)
221/414
(53.4)
0.5 54/106
(50.9)
26/38
(68.4)
0.06
myogenic
component
present, total n (%
of all patients)
27/168
(16.1)
45/452
(10.0)
0.04 12/62
(19.4)
39/414
(9.4)
0.02 15/106
(14.1)
6/38 (15.8) 0.8
myogenic
component, total
n (% of patients in
whom contraction
achieved)
27/90
(30.0)
45/202
(18.2)
0.02 12/36
(33.3)
39/221
(17.6)
0.03 15/54
(27.8)
6/26 (23.1) 0.6
IIT = intensive insulin therapy; IQR = interquartile range; LL = lower limbs; SD = standard deviation; SNAP = sensory nerve action potential; UL =
upper limbs.
Critical Care Vol 13 No 1 Hermans et al.
Page 8 of 12
(page number not for citation purposes)
Table 4
Univariate analysis of risk factors for CIP/CIM and prolonged mechanical ventilation
CIP/CIM Total population, n = 620 Prolonged mechanical ventilation Total population, n =
541
CIP/CIM n = 345 No CIP/CIM n = 275 p- value Prolonged mechanical
ventilation
No prolonged
mechanical ventilation
p- value
Therapy
IIT total n (%) 220/345 (63.8) 232/275 (84.4) < 0.0001 259/343 (75.5) 140/198 (70.7) 0.2
Baseline
Male/female sex, n (%) 239/345 (69.3) 171/275 (62.2) 0.06 242/343 (70.6) 118/198 (59.6) 0.009
Age, years (mean ± SD) 62 ± 14 63 ± 15 0.4 62 ± 14 64 ± 15 0.2
ICU type (MICU, %) 87/345 (25.2) 57/275 (20.7) 0.2 57/343 (16.6) 65/198 (32.8) < 0.0001
Baseline APACHE II,
median (IQR)
15 (11 to 22) 15 (11 to 22) 0.4 15 (12 to 22) 16 (11 to 23) 0.7
On admission blood
glucose, mg/dl median
(IQR)
137 (109 to 174) 139 (112 to 181) 0.5 139 (111 to 175) 139 (113 to 183) 0.6
On admission
mechanical ventilation,
total n (%)
298/306 (97.4) 237/247 (96.0) 0.3 332/341 (97.4) 185/194 (95.4) 0.2
Diagnostic group, total n
(%) of the category
0.3 0.4
Abdominal/
gastrointestinal/liver
39/71 (54.9) 32/71 (45.1) 45/67 (67.2) 22/67 (32.8)
Cardiovascular 91/171 (53.2) 80/171 (46.8) 111/165(67.3) 54/165 (32.7)
Cerebral/neurological 26/60 (43.3) 34/60 (56.7) 34/53 (64.2) 19/53 (35.8)
Haematological/
oncologic/transplant
15/31 (48.4) 16/31 (51.6) 19/27 (70.4) 8/27 (29.6)
Other 42/73 (57.5) 31/173 (42.5) 38/70 (54.3) 32/70 (45.7)
Polytrauma 221/37 (59.5) 15/37 (40.5) 22/32 (68.8) 10/32 (31.2)
Respiratory/thoracic 85/136 (62.5) 51/136 (37.5) 74/127 (58.3) 53/127 (41.7)
History of diabetes, total
n (%)
0.2 0.7
Insulin treated 21/317 (6.6) 16/254 (6.3) 25/343 (7.3) 11/198 (5.6)
Oral antidiabetic
treatment and/or diet
22/317 (6.9) 20/254 (7.9) 24/343 (7.0) 15/198 (7.6)
Known risk factors
Treatment with
noradrenaline
Treated patients, total
n (%)
232/301 (77.1) 197/240 (82.1) 0.2 289/343 (84.3) 129/198 (65.2) < 0.0001
Number of days
treatment, median
(IQR)
7(1 to 15) 6(2 to 13) 0.4 8 (3 to 13) 3 (0 to 6) < 0.0001
Treatment with
aminoglycosides
Treated patients, total
n (%)
76/301 (25.2) 51/240 (21.3) 0.3 77/343 (22.4) 29/198 (14.6) 0.03
Available online />Page 9 of 12
(page number not for citation purposes)
As differential diagnosis between CIP and CIM via routine
NCS/EMG is often difficult because of the lack of cooperation
of critically ill patients, we used the SNAPs as a surrogate
marker for CIP. Although other conditions such as oedema will
also influence the SNAPs, we found that these values in the
upper limbs were significantly increased after implementing
IIT. The absence of effect in the lower limbs is noteworthy. This
may be caused by the fact that screening in the lower limbs is
always performed on the sural nerve, which is vulnerable to tis-
sue oedema. Concerning effects on myopathy, we chose to
take into account only results of patients in whom voluntary
contraction was possible and therefore motor unit morphology
and recruitment could be assessed, because these results can
reliably confirm muscle versus nerve involvement. We noticed
that myopathic patterns were also significantly reduced after
IIT. Mechanistically, several effects of IIT may play a role, such
as improvement of the microcirculation or mitochondrial func-
tion of neurons and/or muscle cells, and an effect on the bal-
ance between anabolism and catabolism.
We found no difference in the need for prolonged MV in the
overall population before and after IIT. However, after correc-
tion for baseline differences and exposure to known risk fac-
tors, implementing IIT appeared to be independently
associated with reduced risk of prolonged MV. As in the
RCTs, the beneficial effect of IIT on prolonged MV could not
be entirely explained by the reduction in CIP/CIM. The fact that
the electrophysiological diagnosis of CIP/CIM itself was an
independent determinant of prolonged MV suggests that this
diagnosis is indeed a clinically relevant one.
This study has some important limitations, first of all because
of the retrospective nature. Because of our intention to evalu-
ate effects of a change in glycaemic control in daily clinical
practice outside the controlled setting of a study protocol, and
the recent results of our two RCTs, the nature of this study
inevitably was retrospective and observational. Due to the dif-
ferent timing of the RCTs in our SICU and MICU there was a
large imbalance in characteristics between the groups before
and after implementation of IIT, and some daily care practices
Number of days
treatment, median
(IQR)
0 (0 to 1) 0 (0 to 0) 0.5 0 (0 to 0) 0 (0 to 0) 0.1
Treatment with
glucocorticoids
Treated patients, total
n (%)
165/301 (54.8) 129/240(53.8) 0.8 163/343 (47.5) 100/198 (50.5) 0.5
Number of days
treatment, median
(IQR)
1 (0 to 12) 1 (0 to 10) 0.4 0 (0 to 8) 1 (0 to 7) 0.9
Cumulative dose up to
time t
250 (0 to 2500) 300(0 to 2500) 0.8 0 (0 to 1398) 31 (0 to 1140) 0.9
Treatment with NMBA
Number of days
treatment (≥ 1 bolus
or drip), median (IQR)
2 (1 to 4) 1 (0 to 4) 0.06 2 (1 to 3) 1 (0 to 2) < 0.0001
Patients treated
prolonged (≥ 3d bolus
or drip) total n (%)
95/301 (31.6) 71/240(29.6) 0.6 262/343 (76.4)) 107/198 (54.0) < 0.0001
Dialysis
yes 118/301 (39.2) 72/240 (30.0) 0.03 126/343 (36.7) 37/198 (18.7) < 0.0001
n days, median (IQR) 0 (0 to 10) 0 (0 to 5) 0.05 0 (0 to 6) 0 (0 to 0) 0.0001
Bacteraemia, yes, total n
(%)
113/301 (37.5) 76/240 (31.7) 0.2 92/343 (26.8) 32/198 (16.2) 0.004
Time to diagnosis, d
median (IQR)
22 (14 to 33) 18 (11 to 27) 0.000 7
Diagnosis of CIP/CIM
during ICU stay, total n
(%)
207/343 (60.4) 94/198 (47.5) 0.004
APACHE = acute physiology and health evaluation; CIM = critical illness myopathy; CIP = critical illness polyneuropathy; IIT = intensive insulin
therapy; IQR = interquartile range; MICU = medical intensive care unit; NMBA = neuromuscular blocking agent; SD = standard deviation.
Table 4 (Continued)
Univariate analysis of risk factors for CIP/CIM and prolonged mechanical ventilation
Critical Care Vol 13 No 1 Hermans et al.
Page 10 of 12
(page number not for citation purposes)
Table 5
Multivariate logistic regression analysis for the risk for development of CIP/CIM and prolonged mechanical ventilation
Risk for development of CIP/CIM
a
Risk for prolonged mechanical ventilation
b
OR (95% CI) p-value OR (95% CI) p-value
A. Uncorrected.
Glycaemic control, IIT 0.33 (0.22 to 0.48) < 0.0001 1.28 (0.86 to 1.89) 0.2
B. Corrected for baseline risk factors.
Glycaemic control, IIT 0.24 (0.14 to 0.42) < 0.0001 0.56 (0.32 to 0.96) 0.04
ICU type, medical 0.49 (0.27 to 0.90) 0.02 0.29 (0.16 to 0.53) < 0.0001
Diagnostic category
Cardiovascular 1.005 (0.55 to 1.82) 0.9 0.78 (0.41 to 1.47) 0.4
Cerebral/neurological 0.77 (0.37 to 1.63) 0.5 0.79 (0.36 to 1.72) 0.5
Haematological/oncological/transplant 1.04 (0.41 to 2.60) 0.9 0.96 (0.35 to 2.63) 0.9
Other 1.02 (0.50 to 20.7) 0.9 0.60 (0.29 to 1.26) 0.2
Polytrauma 1.03 (0.43 to 2.49) 0.9 0.75 (0.29 to 1.90) 0.5
Respiratory/thoracic 1.43 (0.75 to 2.71) 0.3 0.85 (0.44 to 1.64) 0.6
On admission blood glucose 0.99 (0.99 to 1.001) 0.1 0.99 (0.99 to 1.002) 0.7
Gender, female 0.68 (0.47 to 1.000) 0.05 0.63 (0.43 to 0.93) 0.02
C. Corrected for baseline risk factors and known risk factors occurring during ICU stay.
Glycaemic control, IIT 0.25 (0.14 to 0.43) < 0.0001 0.40 (0.22 to 0.72) 0.002
ICU type, medical 0.62 (0.33 to 1.16) 0.1 0.35 (0.18 to 0.67) 0.002
Diagnostic category
Cardiovascular 0.99 (0.54 to 1.83) 0.9 0.64 (0.31 to 1.29) 0.2
Cerebral/neurological 0.83 (0.39 to 1.80) 0.6 0.87 (0.36 to 2.11) 0.8
Haematological/ 1.18 (0.45 to 3.12) 0.7 0.60 (0.19 to 1.93) 0.4
oncological/transplant 1.002 (0.49 to 2.07) 0.9 0.58 (0.26 to 1.27) 0.2
Other 1.09 (0.43 to 2.73) 0.9 0.88 (0.30 to 2.57) 0.8
Polytrauma 1.38 (0.72 to 2.66) 0.3 089 (0.43 to 1.86) 0.8
Respiratory/thoracic
On admission blood glucose 0.99 (0.99 to 1.001) 0.1 0.99 (0.99 to 1.002) 0.4
Gender, female 0.74 (0.50 to 1.09) 0.1 0.74 (0.48 to 1.12) 0.2
Number of days treatment with noradrenaline, per day added 1.002 (0.98 to 1.03) 0.8 1.16 (1.11 to 1.22) < 0.0001
Cumulative dose hydrocortisone equivalent, per mg added 1.000 (1.000 to 1.000) 0.3 1.00 (1.00 to 1.00) 0.9
Treatment with aminoglycosides, yes 1.073 (0.69 to 1.68) 0.8 1.72 (1.003 to 2.96) 0.05
Number of days treatment with NMBAs (min 1 bolus or drip), per
day added
1.04 (0.98 to 1.10) 0.2 1.15 (1.04 to 1.27) 0.007
Number of days treatment with dialysis, per day added 1.004 (0.98 to 1.02) 0.7 1.09 (1.03 to 1.15) 0.004
Time t, per day added 1.01 (0.99 to 1.03) 0.2 - -
Bacteraemia, yes - - 2.11 (1.26 to 3.55) 0.005
CI = confidence interval; CIM = critical illness myopathy; CIP = critical illness polyneuropathy; ICU = intensive care unit; IIT = intensive insulin
therapy; NMBA = neuromuscular blocking agent; OR = odds ratio; SD = standard deviation.
a
risk factors occurring during ICU stay were calculated for each patient up to the point of diagnosis of presence or absence of CIP/CIM;
b
risk factors occurring during ICU stay were calculated for the first 14 days.
Available online />Page 11 of 12
(page number not for citation purposes)
may have changed during the study period. Although we cor-
rected for these imbalances, some caution is needed concern-
ing the comparability of the groups before and after
implementation of IIT and the validity of MVLR to correct for
this. Another approach could have been to use propensity
scores. However, it was recently stated that in the great major-
ity of published studies that have used both approaches, esti-
mated effects from propensity score and regression methods
have been similar and simulation studies further suggest com-
parable performance of the two approaches in many settings
[16]. For this reason, and because of the practical impossibility
of calculating propensity scores for patients who did not
receive electrophysiological examination, this statistical
method was not used in this study.
The diagnosis of CIP/CIM also had some limitations. CIP/CIM
was solely diagnosed on the presence of abundant spontane-
ous electrical activity. Therefore, we may have missed some
diagnoses because muscle membrane inexcitability was not
detected. By omitting those patients with only reduced
CMAPs or SNAPs and no spontaneous electrical activity, we
may also have missed some early diagnoses as the reduction
in amplitude of the nerve and muscle action potentials (com-
pound sensory or motor) or both, with preserved normal con-
duction velocity is the first electrophysiological sign that
precedes other electrophysiological signs such as fibrillation
potentials and positive sharp waves [17-20]. However, based
on the time to diagnosis, which was quite long (median of 22
days before and 18 days after implementation), the number of
patients for whom this was the case is expected to be small.
Also, although the indication for electrophysiological testing
was clinical weakness and/or weaning failure, no systematic
evaluation of clinical weakness was reported and more sophis-
ticated electrophysiological testing using direct muscle stimu-
lation could have provided more details on the effects on CIP
and CIM individually.
Conclusion
We conclude that implementing IIT into standard daily care of
critically ill patients exerted a similar beneficial effect on the
electrophysiological diagnosis of CIP/CIM and the need for
prolonged MV, as was shown in two previous RCTs. Future
research should concentrate on underlying pathophysiological
mechanisms.
Competing interests
The authors declare that they have no competing interests.
Authors' contributions
GH analysed the data, had a major contribution to the interpre-
tation hereof and drafted the manuscript. MS designed the
study concept, collected data and had a major contribution to
the interpretation hereof. PD designed the study concept, col-
lected data and had a major contribution to the interpretation
of data. NB collected data. BB collected data. WDV collected
data. WR had an essential contribution to the interpretation of
the data. GvdB performed the statistics, had an essential con-
tribution to the interpretation of data and the content of the
manuscript.
References
1. Bolton CF, Laverty DA, Brown JD, Witt NJ, Hahn AF, Sibbald WJ:
Critically ill polyneuropathy: electrophysiological studies and
differentiation from Guillain-Barre syndrome. J Neurol Neuro-
surg Psychiatry 1986, 49:563-573.
2. Lacomis D, Zochodne DW, Bird SJ: Critical illness myopathy.
Muscle Nerve 2000, 23:1785-1788.
3. Latronico N, Fenzi F, Recupero D, Guarneri B, Tomelleri G, Tonin
P, De Maria G, Antonini L, Rizzuto N, Candiani A: Critical illness
myopathy and neuropathy. Lancet 1996, 347:1579-1582.
4. Bednarik J, Vondracek P, Dusek L, Moravcova E, Cundrle I: Risk
factors for critical illness polyneuromyopathy. J Neurol 2005,
252:343-351.
5. de Letter MA, van Doorn PA, Savelkoul HF, Laman JD, Schmitz PI,
Op de Coul AA, Visser LH, Kros JM, Teepen JL, Meche FG van der:
Critical illness polyneuropathy and myopathy (CIPNM): evi-
dence for local immune activation by cytokine-expression in
the muscle tissue. J Neuroimmunol 2000, 106:206-213.
6. Leijten FS, Harinck-de Weerd JE, Poortvliet DC, de Weerd AW:
The role of polyneuropathy in motor convalescence after pro-
longed mechanical ventilation. JAMA 1995, 274:1221-1225.
7. De Jonghe B, Bastuji-Garin S, Sharshar T, Outin H, Brochard L:
Does ICU-acquired paresis lengthen weaning from mechani-
cal ventilation? Intensive Care Med 2004, 30:1117-1121.
8. Garnacho-Montero J, Amaya-Villar R, Garcia-Garmendia JL,
Madrazo-Osuna J, Ortiz-Leyba C: Effect of critical illness
polyneuropathy on the withdrawal from mechanical ventilation
and the length of stay in septic patients. Crit Care Med 2005,
33:349-354.
9. Hermans G, Wilmer A, Meersseman W, Milants I, Wouters PJ,
Bobbaers H, Bruyninckx F, Berghe G Van den: Impact of Inten-
sive Insulin Therapy on Neuromuscular Complications and
Ventilator-dependency in MICU. Am J Respir Crit Care Med
2007, 175:480-489.
10. Garnacho-Montero J, Madrazo-Osuna J, Garcia-Garmendia JL,
Ortiz-Leyba C, Jimenez-Jimenez FJ, Barrero-Almodovar A, Garna-
cho-Montero MC, Moyano-Del-Estad MR: Critical illness
polyneuropathy: risk factors and clinical consequences. A
cohort study in septic patients. Intensive Care Med 2001,
27:1288-1296.
11. Hermans G, De Jonghe B, Bruyninckx F, Van den Berghe G:
Inter-
ventions for preventing critical illness polyneuropathy and crit-
ical illness myopathy. Cochrane Database Syst Rev
2009:CD006832.
12. de Letter MA, Schmitz PI, Visser LH, Verheul FA, Schellens RL, Op
de Coul DA, Meche FG van der: Risk factors for the develop-
ment of polyneuropathy and myopathy in critically ill patients.
Crit Care Med 2001, 29:2281-2286.
13. De Jonghe B, Sharshar T, Lefaucheur JP, Authier FJ, Durand-Zale-
ski I, Boussarsar M, Cerf C, Renaud E, Mesrati F, Carlet J, Raphael
JC, Outin H, Bastuji-Garin S: Paresis acquired in the intensive
care unit: a prospective multicenter study. JAMA 2002,
288:2859-2867.
Key messages
• Implementing IIT in daily care of critically ill medical and
surgical patients is feasible.
• IIT reduced electrophysiological incidence of CIP/CIM
in daily clinical practice in critically ill medical and surgi-
cal patients, outside the controlled setting of a study
protocol.
Critical Care Vol 13 No 1 Hermans et al.
Page 12 of 12
(page number not for citation purposes)
14. Witt NJ, Zochodne DW, Bolton CF, Grand'Maison F, Wells G,
Young GB, Sibbald WJ: Peripheral nerve function in sepsis and
multiple organ failure. Chest 1991, 99:176-184.
15. Berghe G Van den, Schoonheydt K, Becx P, Bruyninckx F, Wout-
ers PJ: Insulin therapy protects the central and peripheral nerv-
ous system of intensive care patients. Neurology 2005,
64:1348-1353.
16. Glynn RJ, Schneeweiss S, Sturmer T: Indications for propensity
scores and review of their use in pharmacoepidemiology.
Basic Clin Pharmacol Toxicol 2006, 98:253-259.
17. Bolton CF, Young GB: Critical Illness Polyneuropathy. Curr
Treat Options Neurol 2000, 2:489-498.
18. Bednarik J, Lukas Z, Vondracek P: Critical illness polyneuromy-
opathy: the electrophysiological components of a complex
entity. Intensive Care Med 2003, 29:1505-1514.
19. Bolton CF: Neuromuscular manifestations of critical illness.
Muscle Nerve 2005, 32:140-163.
20. Tennila A, Salmi T, Pettila V, Roine RO, Varpula T, Takkunen O:
Early signs of critical illness polyneuropathy in ICU patients
with systemic inflammatory response syndrome or sepsis.
Intensive Care Med 2000, 26:1360-1363.