Basic Electrocardiography Normal and abnormal ECG patterns - Part 3 pps
Bạn đang xem bản rút gọn của tài liệu. Xem và tải ngay bản đầy đủ của tài liệu tại đây (863.09 KB, 18 trang )
P1: OTE/SPH P2: OTE
BLUK096-Bayes de Luna June 7, 2007 21:25
30 Chapter 5
A
lll
lll VR
V
1
V
2
V
3
V
4
V
6
V
5
V
1
V
2
V
3
V
4
V
6
V
5
VL
VF
lll
lll
VR VL
VF
B
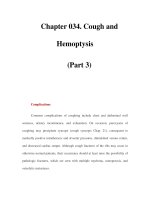
Figure 27 (A) ECG of a 3-year-old child. (B) ECG of an 80-year-old normal man.
Electrocardiographic changes with age (Figure 27)
Infants, children and adolescents (Figure 27A)
The most important features of the ECG of healthy children as compared to
normal adults can be summarised as follows:
1 There is a faster heart rate and shorter PR interval.
2 Due to the physiological right ventricular hypertrophy of infants, the heart
is usually vertical with
ˆ
AQRS to the right and negative or bimodal T waves
in V1 to V3–V4, and has a characteristic morphology (infantile repolarisation)
that can be seen until adolescence, particularly in females. The QRS loop goes
to the left before going back, which explains why the morphology of V6 looks
P1: OTE/SPH P2: OTE
BLUK096-Bayes de Luna June 7, 2007 21:25
Normal ECG characteristics 31
like the adult’s morphology before V1 (there is higher R in V1 compared with
‘q’ in V6). Sometimes the rsr
pattern is observed in V1. In infants, especially if
they are post-term, even R or qR patterns can be seen at birth with a somewhat
positive T wave. The Rs pattern persists for a time, perhaps even years even
until adulthood. However, the T wave usually becomes flattened or negative
in the days following birth.
3 In some adolescents, an R wave with high voltage in precordial leads
(Sv2 + RV5 > 60 mm) without the existence of left ventricular enlargement
may be seen.
4 Sometimes evident increase in the heart rate with inspiration.
Elderly subjects (Figure 27B)
The following phenomena can be considered age-related variants in ECGs of
the elderly:
1 A slower heart rate and longer PR interval (normal until 0.22 seconds).
2 Occasionally, a more right-pointing
ˆ
AP is present because of pulmonary
emphysema with the ‘S’wave in lead V6 and an
ˆ
AQRS that, in general, points
more to the left (from 0
◦
to −30
◦
).
3 A poor ‘r’ progression from V1 to V3, probably due to septal fibrosis. This
can produce problems in the differential diagnosis with septal necrosis.
4 Some alteration ofrepolarisation(slightlydepressedSTsegmentand/orflat-
tened T wave). A frequent ‘U’wave particularly in the intermediate precordial
leads.
P1: OTE/SPH P2: OTE
BLUK096-Bayes de Luna June 7, 2007 22:21
CHAPTER 6
Electrocardiographic diagnostic criteria
Electrocardiography can be considered the test of choice, the ‘gold standard’,
for the diagnosis of atrial and ventricular blocks, ventricular pre-excitation,
most cardiac arrhythmias and acute myocardial infarction. However, in other
cases, such as atrial and ventricular enlargement, abnormalities secondary to
chronic coronary artery disease (electrocardiographic pattern of ischaemia or
necrosis), in the assessment of other repolarisation abnormalities or certain ar-
rhythmias, electrocardiography provides useful information and may suggest
the diagnosis based on predetermined electrocardiographic criteria; however,
these criteria have lesser diagnostic potential compared with other electrocar-
diological or imaging techniques (echocardiography, for example, for atrial or
ventricular enlargement, etc.). In conditions for which electrocardiography is
the technique of choice, the electrocardiographic criteria we use are diagnostic
for that disease (e.g. blocks), while for other conditions (e.g. cavity enlarge-
ment) the criteria are only indicative of that disease.
Regarding diagnostic criteria employed in electrocardiography (ECG) (or
other techniques) when these are not techniques of choice for the diagnosis
of a certain condition, e.g. diagnostic ECG criteria for atrial or ventricular
enlargement, chronic myocardial infarction, ventricular tachycardia, etc., it is
necessary to know their real usefulness. To this end, it is mandatory to apply
the concepts of sensitivity, specificity and predictive value.
Specificity of an electrocardiographic criterion (e.g. height of R wave in
V5 > 35 mm for left ventricular hypertrophy) isdefined as 100 – the percentage
of normal individuals that present with that criterion. An electrocardiographic
criterion will be more specific when presented by fewer normal individuals.
When no normal individuals present these criteria, specificity is 100% (no false
positive cases will be found).
Specificity =
True negatives (TN)
TN + False positives (FP)
× 100
Sensitivity of an electrocardiographic criterion (e.g. height of R wave in
V5 > 35 mm for left ventricular hypertrophy) isdefined as 100 – the percentage
of individuals with a determined abnormality (in this case left ventricular
hypertrophy) presenting with that criterion. If all the individuals with the
heart disease under discussion show a certain electrocardiographic criterion,
the sensitivity will be 100% (no false negative cases will be found).
Sensitivity =
True positive (TP)
TP + False negatives (FN)
× 100
32
P1: OTE/SPH P2: OTE
BLUK096-Bayes de Luna June 7, 2007 22:21
Electrocardiographic diagnostic criteria 33
As can be appreciated, specificity is determined in a control group (patients
without the abnormality under study) and sensitivity in a group with the ab-
normality once other first-choice techniques (echocardiography, angiography,
etc.) have been used to define these two groups with or without the abnormal-
ity under study.
Predictive value represents theclinical significance of a criterion.It indicates
the probability of a result being valid, bearing in mind the concrete result of
the criterion, whether positive or negative. It signifies what is the percentage
of patients with a criterion who will suffer from that disease (f.i. percentage of
valvular heart disease patients with P± in II, III and VF that will present left
atrial enlargement – positive predictive value) or what is the percentage of
patients without the criterion under discussion who do not suffer that disease
(negative predictive value).
PPV =
TP
TP + FP
NPV =
TN
TN + FN
The predictive value of an ECG criterion (f.i. P± in II, III, VF) to predict left
atrial enlargement in patients with valve heart disease must be assessed on the
basis of the epidemiological reality because it is related to the prevalence of the
ECG criterion in the population studied. This means that we need to study a
consecutive group ofpatients,inthiscase,withvalveheartdisease,toknowthe
predictive value of this ECG criterion to detect left atrial enlargement already
proven by echocardiography. Therefore, wecannot use, to know the predictive
value (for positives andnegatives),the sample sizes chosen at random to assess
sensitivity and especificity of the same criterion (e.g. 100 patients with and
100 without left atrial enlargement detected by echocardiography), unless the
corrections that are appropriate for the epidemiological reality are applied.
Table 2 shows the practical form to detect sensitivity, specificity and predictive
Table 2 Calculation of sensitivity (SE), specificity (SP), positive and negative predictive values
(PPV, NPV) of a certain electrocardiographic criterion.
100 VALVULAR PATIENTS
100 Valvular
patients
Total
Total
LAE by echocardiography
YES NO
P± en II, III, VF
Without p± en
II, III, VF
202
88 10 98
PPV
NPV
= = x100
≈
100%
TP
TP + FP
TN + FP
TN + FN
2
2 + 0
10 + 0
10 + 88
10
10
TN
TN
90 10 100
SP
= = x100%
≈
10%
= x100
=
100 %
TP + FN
2 + 88
2
TP
SE
= x100
≈
2 %
An example to demonstrate whether the presence of an electrocardiographic criterion (in this case
a +/− P wave in II, III and aVF in patients with valvular heart disease) does or does not predict the
presence of left atrial enlargement (LAE) as detected by echocardiography.
Abbreviations: PPV, positive predictive value; NPV, negative predictive value; TP, true positive;
FP, false positive; TN, true negative; FN, false negative; SE, sensitivity; SP, specificity.
P1: OTE/SPH P2: OTE
BLUK096-Bayes de Luna June 7, 2007 22:21
34 Chapter 6
value taking as an example the criterion of left atrial enlargement (LAE) P ±in
II, III, VF ina group of 100patients with valvular heart disease.We use the table
2 × 2 (Table 2). All cases have an echocardiogram as a gold standard for LAE.
The cases with P ± in II, III, VF are located in the upper part of the table, and
the cases that do not present this ECG criterion in the lower part. In both rows
there are cases with and without LAE by echocardiography. The table shows
how easily we may perform the calculation of SP, SE, PPV and NPV using the
formulae explained earlier. It is important to remember that for calculation of
PV (positive and negative) we have to consider the epidemiological reality and
we have to study a cohort of consecutive patients.
It must be borne in mind that sensitivity and specificity of different electro-
cardiographic criteria vary in an inverse manner, so that very specific criteria
will not be very sensitive (e.g. P wave > 0.15 seconds or with ±morphology in
II, III, VF is very specific criterion for the diagnosis of left atrial enlargement
(LAE), as a very small number of patients without LAE will present it; how-
ever, it is not very sensitive, as few patients with LAE have a P wave with that
duration or morphology). Given this inverse relationship, it is difficult to find
criteria that maintain a high level of sensitivity without losing specificity.
Finally, it should be stated that the accuracy of an electrocardiographic cri-
terion or test increases, according to Bayes’ theorem, when applied to a popu-
lation with a high prevalence of a given heart disease (high a priori probability
of having the disease) and decreases when applied to a population with a low
prevalence of that heart disease (low a priori probability). Thus, the value of
ST-segment depression as a criterion of coronary heart disease is much higher
if found in a population with a high prevalence of coronary heart disease
(middle-aged patient with family history, chest pain and risk factors (hyperc-
holesterolemia, high blood pressure, diabetes)) than in a populationwith a low
prevalence of coronary heart disease (e.g. young adults with no risk factors).
P1: OTE/SPH P2: OTE
BLUK096-Bayes de Luna May 1, 2007 18:18
CHAPTER 7
Atrial abnormalities
All the electrocardiographic patterns observed in patients with atrial enlarge-
ment and with atrial conduction blocks are encompassed by this term (Figures
28–30). It is convenient to bear in mind the following facts [1]:
1 The normal P wave (Figures 16, 28A and 29A) is explained by activation first
of the right atrium and then of the left atrium, with an intermediate period
during which both atria are depolarised together [13,14].
2 Atria become dilated more than hypertrophied.
3 The classical morphology of P wave in right atrial enlargement is an increase
in voltage without increase in length (Figures 28B, 29B and C).
4 The classical morphology of left atrial enlargement is secondary to the delay
in interatrial conduction rather than to atrial dilation (Figures 28C and 29D)
[15].
5 P-wave voltage is influenced by extracardiac factors that increase (hypoxia,
sympathicotonia, etc.) or decrease it (emphysema, atrial fibrosis, etc.).
6 In an interatrial block, the conduction delay occurs between the right and
left atria. Although usually associated with left atrial enlargement, it may also
exist as an isolated finding in the cases of pericarditis, ischaemic heart disease,
etc. The block can be partial or complete.
Right atrial enlargement (Figures 28B, 29B and C)
Right atrial enlargement (RAE) is especiallypresent in patients withcongenital
and valvular heart diseases affecting the right side of the heart and in cor
pulmonale.
Diagnostic criteria
Diagnostic criteria of RAE are based on the following:
1 QRS complex alterations: (1) ‘qr (qR)’ morphology in V1 in the absence of
an infarction (specificity = 100% according to some authors); (2) QRS complex
voltage ≤4 mm in V1 and V2/V1 QRS complex voltage ≥5 (quite a specific
criterion, SP = 90%).
2 P-wave abnormalities (P ≥ 2.5 mm in II and/or 1.5 mm in V1). These criteria
have low sensitivity and they are somewhat more specific.
Left atrial enlargement (Figures 28C and 29D)
Left atrial enlargement (LAE) is seen in patients with mitral and aorticvalvular
disease, ischaemic heart disease, hypertension and some cardiomyopathies.
35
P1: OTE/SPH P2: OTE
BLUK096-Bayes de Luna May 1, 2007 18:18
36 Chapter 7
2 mm.
3 mm.
2 mm.
2
1
1
1
right atrium
right atrium
right atrium
Left atrium
Left atrium
Left atrium
0.10 s
Normal P wave
RAE
ABC
LAE
0.10 s
0.12 s
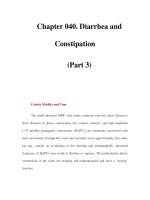
Figure 28 Top: scheme of atrial depolarisation in (A) normal P wave, (B) right atrial enlargement
(RAE) and (C) left atrial enlargement (LAE). Bottom: three examples of these P waves.
Diagnostic criteria
The diagnostic criteria of LAE are as follows:
1 P wave with a duration ≥0.12 seconds especially seen in leads I or II, gener-
ally bimodal, but with normal height.
2 Diphasic P wave in V1 with an evidentfinalnegativityofatleast0.04 seconds
because the second part of the loop is directed backwards due to left atrial
enlargement (see Figure 29D – HP).
Figure 29 Morphology of P wave. (A) Normal. (B), (C) Right atrial enlargement: (B) P pulmonale;
(C) P congenitale; (D) left atrial enlargement (P mitrale); and (E) biatrial enlargement.
P1: OTE/SPH P2: OTE
BLUK096-Bayes de Luna May 1, 2007 18:18
Atrial abnormalities 37
These two criteria have a good specificity (close to 90%) (few false positive
cases), but a discrete sensitivity (lower than 60%) (more false negative cases).
1 The ± P-wave morphology in II, III and VF with P ≥ 0.12 seconds is very
specific and presents high PPV (100% in valvular heart disease and cardiomy-
opathies), though with a low sensitivity and low negative predictive value for
left atrial enlargement [16,17] (see Table 2).
Biatrial enlargement (Figure 29E)
Diagnostic criteria
Diagnostic criteria of biatrial enlargement include criteriaofrightandleft atrial
enlargement:
1 P wave in II taller (≥2.5 mm) and wider (≥0.12 seconds) than normal. On
certain occasions there can be a ‘peaked’ positive P wave in V1–V2.
2 Criteria of left atrial enlargement with an
ˆ
AP shifted to the right and/or
criteria of right atrial enlargement based on QRS complex alterations.
Interatrial block
∗
Partial block
In a partial interatrial block, the stimulus reaches the left atrium via the normal
pathway, but with a certain delay.
Diagnostic criteria
P wave witha duration ≥0.12 seconds in the frontalplane.TheP-wavelength
and consequently the bimodal morphology of P wave seen in lead II as a
most typical lead detected in an isolated partial interatrial block is similar
to the P wave of left atrial enlargement. In fact, as we have already stated,
the delay in interatrial conduction, more than left atrium dilation, generally
explains the morphology of left atrial enlargement (LAE). However, the mor-
phology of P wave in HP especially V1 is usually different. In the case of
an isolated interatrial block (f.i. pericarditis) the second part of the loop is
not directed so much backwards because there is no LAE and, consequently,
the P wave morphology in V1 is positive or presents only a small negative
part.
∗
The concept of a block means that in a certain part of the heart (sinoatrial union, atria,
atrioventricular union or ventricles) the electrical stimulus encounters overall significant
difficulties for its conduction. If conduction is slow, but the stimulus passes through the area
with slow conduction, we call it a first-degree or partial block; when the stimulus is
completely blocked we call it a third-degree or complete block, and when the stimulus
sometimes passes and sometimes not, we call it a second-degree block.
P1: OTE/SPH P2: OTE
BLUK096-Bayes de Luna May 1, 2007 18:18
38 Chapter 7
Figure 30 Top: example of atrial activation and characteristics of the P loop in the frontal plane
and the morphology of P wave in VF in normal conditions (A), and in the case of partial (B) and
complete interatrial block with left atrial retrograde activation (C). Bottom left: leads I, II and III in
complete interatrial block with left atrial retrograde activation, with direction of the activation
vectors of the first and the second part of the P wave and four consecutive P waves with ±
morphology in VF in a patient with complete interatrial block. Bottom right: oesophageal and
intracavitary recordings demonstrating the sequence of activation in this type of interatrial block
(high right atrium, low right atrium, high oesophageal lead with −/+ morphology).
Complete interatrial block, with left atrial retrograde activation
[16–18] (Figure 30)
In a complete interatrial block, the stimulus does not reach the left atrium via
the normal path, but by retrograde left atrial activation [16].
Diagnostic criteria
P wave with a duration ≥0.12 seconds and ± in II, III and VF. P wave ±
in V1 to V3–V4 is frequent. This type of block is frequently accompanied by
supraventricular arrhythmias, particularly atypical atrial flutter [17,18].
P1: OTE/SPH P2: OTE
BLUK096-Bayes de Luna June 7, 2007 21:48
CHAPTER 8
Ventricular enlargement
The electrocardiographic concept of enlargement of right and left ventricles
encompasses both hypertrophy and dilatation and, of course, the combination
of both processes.
Ventricular enlargement (VE) morphologies are secondary to hypertrophy
rather than to dilatation, unlike what occurs in the atria. A certain degree of
homolateral block to the enlarged ventricle and interstitial fibrosis are present.
As the degree of septal interstitial fibrosis increases, less ‘Q’ wave is visible in
the leads facing the left ventricle such as V5–V6 [19]. Furthermore, the finding
of a more or less abnormal ECG recording is related more to the evolutionary
phasethantotheseverityof disease. Ontheotherhand,slightor even moderate
degrees of enlargement of either of the ventricles, mainly the right, or of both
at the same time, may not produce abnormalities in the ECG.
More than 50 years ago, the Mexican school [20] coined the electrocardio-
graphic concept of systolic and diastolic overload (rSR
in V1 in diastolic over-
load in right ventricular enlargement as in atrial septal defect and qR with
a tall T wave in V5–V6 in the cases of diastolic overload of the left ventricle
as in aortic regurgitation) and systolic overload pattern (R waves with the
‘strain’ pattern of repolarisation-downsloping ST with a negative asymmetri-
cal T wave – recorded in V1–V2 in the case of systolic right ventricle overload
as in severe pulmonary stenosis or in V5–V6 in the case of left ventricle systolic
overload as aortic stenosis). These concepts later became the subject of great
debate. It is currently considered that, regardless of the type of underlying
haemodynamic overload, the so-called electrocardiographic pattern of dias-
tolic overload usually corresponds to slight or moderate degrees of right or
left ventricular enlargement, while the systolic overload pattern – strain pat-
tern – is usually found in very advanced stages of any right or left ventricular
enlargement.
The superiority of echocardiography over electrocardiography for the diag-
nosis of ventricular enlargement, mainly of the left ventricle, is evident (sen-
sitivity is much higher with nearly similar specificity). However, when the
ventricular enlargement is diagnosed with the electrocardiogram, the value of
the latter is greater than that of the echocardiogram in predicting heart disease
evolution and prognosis.
We will address the diagnostic criteria of ventricular enlargement in the
cases of QRS duration under 120 ms. For the diagnosis of right and/or left
ventricular enlargement combined with ventricular block (QRS duration over
120 ms), we suggest the consultation of other publications [1,5,21,22].
39
P1: OTE/SPH P2: OTE
BLUK096-Bayes de Luna June 7, 2007 21:48
40 Chapter 8
A
PF
I
II I
PH
VF
VF
VF VF
V
1
V
1
V
1
V
1
V
2
V
2
V
2
V
2
V
6
V
6
V
6
V
6
B
C
D
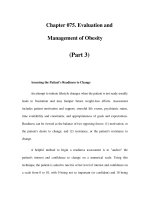
Figure 31 Four different characteristic types of the loop observed in right ventricular enlargement
(RVE). (A) Normal frontal plane (FP) and horizontal plane (HP) with the loop directed more
anteriorly. This explains the morphology of RS in V1–V2. It is often seen in patients with mitral
stenosis and corresponds to a mild RVE. (B) FP with the maximum vector to the right (QRS-type
S
I
,R
II
,R
III
) and HP with the loop directed totally anteriorly and with a clockwise rotation. This
corresponds to a severe RVE and is particularly observed in patients with congenital heart
diseases or severe pulmonary hypertension. In less-advanced phases of disease the morphology
of the QRS loop in HP is somewhat different, e.g. a figure-of-eight morphology. (C) FP with the
maximum vector directed to the right (QRS type S
I
,R
II
,R
III
) and HP with the major part of the loop
directed posteriorly and to the right, which usually corresponds to a moderate or even important
RVE, and may be seen in patients with chronic cor pulmonale. (D) The loop in HP is similar to the
previous one, but with S
I
,S
II
,S
III
morphology in FP. It is usually seen in moderate–severe RVE.
Right ventricular enlargement
Right ventricular enlargement (RVE) is found particularly in the cases of con-
genital heart diseases, valvular heart diseases and cor pulmonale. Figures 31
and 32 show the changes that RVE may produce in ventricular loops and how
these changes may explain the different ECG patterns. The changes produced
move the loop rightwards and posteriorly more as a consequence of the delay
of activation of RV than of an increase of right ventricle mass that also exists,
but usually is not more important than the mass of left ventricle. The lower
part of Figure 31 shows that ECG pattern in V1 (with more or less R wave) is
related more to RVE degree than to RVE aetiology.
Diagnostic criteria
The electrocardiographic criteria most frequently used for the diagnosis of
right ventricular enlargement are shown in Table 3, along with their sensi-
tivity, which is low, and specificity, which is high. The differential diagnosis
of exclusive or predominant R wave in V1 (R, Rs or rSR
pattern) is shown in
Table 4.
1 Morphology of V1. Morphologies with dominant or exclusive R wave in V1
are very specific, but not so sensitive (<10%) for the diagnosis of RVE, since
the loop that gives rise to them (anterior and to the right) (Figure 32B–D) is
P1: OTE/SPH P2: OTE
BLUK096-Bayes de Luna June 7, 2007 21:48
Ventricular enlargement 41
Normal
Anterior loop
A
B
C
D
E
E
F
1
V
1
V
1
V
1
V
1
V
1
V
1
V
1
V
6
V
6
V
6
V
6
V
6
V
6
V
6
2
3
4
5
6
Posterior loop
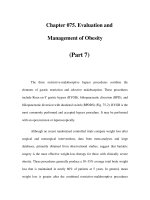
Figure 32 In right ventricular enlargement (RVE) with electrocardiographic repercussion, the
horizontal loop of the QRS is always directed to the right, either forwards or backwards. When it is
directed forwards, different morphologies may be recorded (from A to D cases with more
advanced degree of RVE). A patient may have a morphology changing from one to another during
the course of the disease. However, in general, heart diseases with mild to moderate RVE present
type A or type B morphologies and those with important RVE present type D. If the loop is directed
posteriorly, the morphologies are of types E or F. The QS morphology is seen in the V1 lead in
type E, while rS or rSr
in type F, in both cases accompanied by a significant S in V6. Lower part of
the figure shows that the morphology of QRS in V1 depends more on the severity of RVE than on
the etiology of the disease. 1, 3 and 5 represent examples of mild mitral stenosis, cor pulmonale
and congenital pulmonary stenosis, respectively, while 2, 4 and 6 are the cases of severe and
longstanding mitral stenosis, cor pulmonale with severe pulmonary hypertension and congenital
pulmonary stenosis, respectively.
observed in a small number of cases with RVE (specially congenital heart dis-
easewithsystolicoverload).Inthese cases therepolarizationpresentdepressed
ST with negative andasymetric T wave – strain pattern(Figures 32, 34 and 36)–
except in the newborn, which may present exclusive R wave with a positive
T wave (see Case 10, p. 139). Nevertheless, other causes that may present a
dominant R pattern in V1 must be ruled out (see Table 4). The rS or even QS
morphology in V1, but with RS in V6, may often be observed in chronic cor
pulmonale, even in advanced phases or in the early phases of RVE of other
P1: OTE/SPH P2: OTE
BLUK096-Bayes de Luna June 7, 2007 21:48
42 Chapter 8
Table 3 Electrocardiographic criteria of right ventricular enlargement.
Criterion Sensitivity (%) Specificity (%)
V1 R/S V1 ≥ 1698
RV1≥ 7mm 2 99
qR in V1 5 99
SinV1< 2mm 6 98
IDTinV1≥ 0.35 s 8 98
V5–V6 R/S V5–V6 ≤ 116 93
R V5–V6 < 5mm 13 87
S V5–V6 ≥ 7mm 26 90
V1 + V6 RV1 + SV5–V6> 10.5 mm 18 94
ˆ
AQRS
ˆ
AQRS ≥ 110
◦
15 96
S
I
,S
II
,S
III
24 87
IDT, intrinsicoid deflection (time from QRS onset to R-wave peak).
Table 4 Morphologies with dominant R or (r
)R
in V1. Clinical setting, typical morphologies in V1,
QRS width, and morphology of P in V1.
Morphology in V1 P-wave
Clinical setting with dominant R or R
QRS width morphology in V1
1 No heart disease
• Incorrect electrodes
placement
< 0.12 s Negative in second ICS
and positive or +/− in
fourth ICS
• Normal variant
(post-term infants, scant
Purkinje fibres in
anteroseptal zone
< 0.12 s Normal
• Chest anomalies
< 0.12 s Normal
2 Typical right bundle
branch block
From < 0.12 to
≥0.12 s
Normal
3 A typical right bundle
branch block
• Ebstein’s disease
Often ≥0.12 s Often tall and peaked
and + or ±
• Arrhythmogenic right
ventricular dysplasia
Often ≥0.12 s Often abnormal
• Brugada’s syndrome
Sometimes
≥0.12 s
Normal
4 Right ventricular or
biventricular enlargement
< 0.12 s Often tall and peaked
5 WPW syndrome
From < 0.12 to
≥0.12 s
Normal P, short PR
6 Lateral myocardial
infarction
< 0.12 s Normal P
ICS, intercostal space.
P1: OTE/SPH P2: OTE
BLUK096-Bayes de Luna June 7, 2007 21:48
Ventricular enlargement 43
IVR
A
B
VL
VF
V
1
V
2
V
3
V
6
V
5
II
2
III
III
II
I
VR
VL
VF
V
4
V
1
V
2
V
3
V
6
V
5
V
4
Figure 33 (A) An 8-year-old patient with important pulmonary valve stenosis, with a gradient over
100 mHg. The patient presents a typical morphology of RVE with R-wave-type systolic overload
(strain) from V1 to V3. (B) Patient with right ventricular enlargement due to an advanced chronic
obstructive pulmonary disease with posterior and right QRS-loop-type S
I
,SI
II
,S
III
.
aetiologies (Figures 32E and F). The presence of rsR
is especially typical of an
atrial septal defect, and in the cases of severe pulmonary stenosis, the most
frequent morphology in V1 is a striking R wave with a strain pattern (negative
ST/T wave) with the same morphology in V2 (Figure 33A). On the contrary,
in cases of pulmonary stenosis of tetralogy of Fallot type, the morphology in
V1 is similar to that in isolated pulmonary stenosis, but in V2 this is an rS
morphology.
2 Morphology of V6. The presence of evident forces directed to the right ex-
pressed as an evident S wave in V5–V6 is one of the most important ECG
criteria (see Figures 31 and 32 and Table 3).
3 Electrical axis:
ˆ
AQRS ≥ + 110
◦
. Inferoposterior hemiblock, vertical heart
and lateral infarction must be ruled out. This criterion is quite specific (>95%),
but presents low sensitivity. An
ˆ
AQRS extremely deviated to the right might
suggestRVEduetocongenitalheartdisease (pulmonarystenosis)(Figure33A).
A right
ˆ
AQRS usually not more than +90
◦
or +100
◦
may also be seen in chronic
obstructive pulmonary disease, but in this case usually the voltage of QRS is
lower.
4S
I
,S
II
,S
III
. This morphology is frequently seen in chronic cor pulmonale
with a QS pattern in V1 and an RS pattern in V6, and represents a sign of
bad prognosis (Figure 33B). The possibility of this pattern being secondary to
a positional change (p. 29) or simply to the peripheral right ventricular block
must be ruled out.
The combination of more than one of these criteria increases the diagnostic
possibilities. Horan and Flowers [22] published a scoring system based on the
most frequently used ventricular enlargement electrocardiographic criteria.
P1: OTE/SPH P2: OTE
BLUK096-Bayes de Luna June 7, 2007 21:48
44 Chapter 8
V1
V2 V3
V4
V5
V6
V1 V2 V3
V4
V5
V6
Figure 34 A 60-year-old patient with chronic obstructive pulmonary disease who due to a
respiratory infection presented with an electrocardiographic finding of an acute overload pattern of
the right chamber (A), which disappeared in a few days (B). Note the change in P- and T-wave
morphologies and the disappearance of rS morphology that was observed till V5 as a sign of right
ventricular dilation.
Electrocardiographic signs of right acute overload
(Figures 34 and 35)
The electrocardiographic signs more indicative of right acute overload (de-
compensation of cor pulmonale cor pulmonary embolism) are as follows:
A Change in the
ˆ
AQRS (more than 30
◦
to the right of its usual position).
B Transient negativeT waves sometimes very evidentin right precordial leads
(Figure 34).
C S
1
,Q
III
with a negative T
III
pattern (McGinn and Whitepattern) in the frontal
plane and an RS or rS pattern in V6.
D Appearance of complete right bundle branch block morphology often with
ST-segment elevation. The latter two criteria are highly specific but little sensi-
tive for important pulmonary embolism (Figure 35). Nevertheless, the clinical
setting and the comparison with previous ECG are very important for a differ-
ential diagnosis of both processes to be made.
Left ventricular enlargement
Left ventricular enlargement (LVE) is found particularly in hypertension, is-
chaemic heart disease, valvular heart disease, cardiomyopathies and some
congenital heart diseases.
In general, in patients with left ventricular enlargement, the maximum QRS
vectoroftheloop increasesitsvoltageandisdirectedmore posteriorlythannor-
mal (Figure 36). This explains why negativity of QRS predominates in the right
P1: OTE/SPH P2: OTE
BLUK096-Bayes de Luna June 7, 2007 21:48
Ventricular enlargement 45
I
VR
AB
VL
VF
V
1
V
2
V
3
V
6
V
5
II
III
III
II
IVR
VL
VF
V
4
V
1
V
2
V
3
V
6
V
5
V
4
Figure 35 A 59-year-old patient presenting a typical pattern of McGinn and White (SI QIII with
negative T wave in lead III) (A) in the course of a pulmonary embolism. (B) The ECG findings after
the recovery of the patient.
precordial leads (Figures 36A–C). Occasionally, probably related to significant
cardiac levorotation or due to more significant hypertrophy of the left ven-
tricular septal area, than of the left ventricular free wall, as occurs in some
cases of apical hypertrophic cardiomyopathy, the maximum vector is not di-
rected posteriorly (it is located close to 0
◦
). This implies a tall R wave that is
seen even in V2 (Figure 36E). The presence of striking signs suggestive of left
ventricular enlargement (high voltage of QRS + inverted ST–T wave − strain
pattern) in an asymptomatic patient without heart murmur or hypertension,
suggests hypertrophic cardiomyopathy. In the bottom part of Figure 36 there
is the case of aortic valvular disease (left) without fibrosis (q in V6) and a pos-
itive T wave, and another (right) with fibrosis (no q wave in V6) and a strain
pattern.
The ECG pattern changes during disease evolution. The pattern of ‘strain’
appears moreinrelationwiththedurationofthe disease than with thepresence
of different types of haemodynamic overload. In the past, it was considered
that it appears more in the cases of systolic overload (aortic stenosis) than
of diastolic overload (aortic regurgitation) [6]. However, a ‘q’ wave in V5–V6
remains more frequently in long-standing aortic regurgitation than in aortic
stenosis (Figure 37). The disappearance of q wave in V6 is probably more
related to interstitial septal fibrosis, a substrate of partial left bundle block,
than to haemodynamic overload [19] (Figure 36 bottom and Figure 37).
The LVE pattern is usually fixed but may, at least, partially be resolved with
medical treatment, as occurs in hypertension (Figure 38) or surgery (valvular
heart disease).
P1: OTE/SPH P2: OTE
BLUK096-Bayes de Luna June 7, 2007 21:48
46 Chapter 8
VF
VF
VF
VF VF
V
6
V
6
V
6
V
6
V
6
V
6
V
1
V
1
V
1
V
1
V
1
V
1
H
H
H
SENSI 16
SENSI 16
H
V
6
V
1
Figure 36 The most characteristic loops of left ventricular enlargement (LVE). (A) With the initial
forces to the right and a positive T wave; observed in the cases of LVE that is not long-standing,
and with mild septal fibrosis. (B and C) QRS loops initially to the left and with anti-clockwise
rotation or figure-of-eight rotation on the horizontal plane; corresponds to significant LVE seen in
advanced heart diseases with significant septal fibrosis. (D) QRS loop with ‘q’ of pseudonecrosis
that occurs in some cases of hypertrophic cardiomyopathy with asymmetric septal hypertrophy.
(E) QRS loop pointed approximately 0
◦
on the horizontal plane with a very peaked T loop pointed
backwards and above characteristic for the apical type of hypertrophic cardiomyopathy. Below: two
examples of aortic valve disease; one (left) with mild septal fibrosis and normal ECG and VCG
(presence of ‘q wave’ in V6 as the expression of first vector); the other (right) with important septal
fibrosis and abnormal ECG (ST/T with a strain pattern) and VCG (absence of ‘q’ wave in V6).
1972
A
B
1973
1982
1989
1980
1988
Figure 37 Examples of different ECG
morphologies seen in the evolutionary course of
aortic stenosis (A) and aortic regurgitation (B).
P1: OTE/SPH P2: OTE
BLUK096-Bayes de Luna June 7, 2007 21:48
Ventricular enlargement 47
I
VL
V
5
V
6
I
VL
V
5
V
6
A
B
Figure 38 A 56-year-old male with a hypertensive heart disease. ECG before treatment (A) and 7
months later (B). Note that the repolarisation abnormalities of left ventricular enlargement have
disappeared.
Diagnostic criteria
Various diagnostic criteria exist (Table 5). Those with good specificity (≥85%)
and acceptablesensitivity(between40%and55%)include Cornell’svoltagecri-
teria and the Rohmilt and Estes scoring system. These diagnostic criteria have
many limitations, which are in part secondary to the fact that their usefulness
differs accordingto the population group in which theyare employed. Accord-
ing to the Bayes theorem, the possibility that ECG may be useful to diagnose
left ventricular enlargement is quite high in a group of severely hypertensive
patients and low in an asymptomatic normotensive adults. In hypertensive
patients, the value of ECG diagnosic criteria shown in Table 5 is still lower. For
these patients the criterion described by Rodriguez Padial [1] is useful, that is
the sum of QRS voltage of 12 ECG leads >120 ms.
Table 5 Electrocardiographic criteria of left ventricular enlargement.
Voltage criteria Sensitivity (%) Specificity (%)
1 RI + S
III
> 25 mm 10.6 100
2 RVL > 11 mm 11 100
3 RVL > 7.5 mm 22 96
4 SV1 + RV5–V6 ≥ 35 mm (Sokolow–Lyon) 22 100
5 RV5–V6 > 26 mm 25 98
6 RVL + SV3 > 28 mm (men) or 20 mm (women) 42 96
(Cornell voltage criterion)
7 Cornell voltage duration measurement 51 95
QRS duration ×Cornell voltage > 2436 mm/seg
8 In V1–V6, the deepest S + the tallest R > 45 mm 45 93
9 Romhilt–Estes score > 4 points 55 85
10 Romhilt–Estes score > 5 points 35 95