Báo cáo y học: "A prospective assessment of the inter-laboratory variability of biochemical markers of fibrosis (FibroTest) and activity (ActiTest) in patients with chronic liver disease" ppt
Bạn đang xem bản rút gọn của tài liệu. Xem và tải ngay bản đầy đủ của tài liệu tại đây (395.47 KB, 10 trang )
BioMed Central
Page 1 of 10
(page number not for citation purposes)
Comparative Hepatology
Open Access
Research
A prospective assessment of the inter-laboratory variability of
biochemical markers of fibrosis (FibroTest) and activity (ActiTest)
in patients with chronic liver disease
Philippe Halfon
1
, Françoise Imbert-Bismut
2
, Djamila Messous
2
,
Gilles Antoniotti
3
, Didier Benchetrit
4
, Philippe Cart-Lamy
5
,
Gilles Delaporte
6
, Danièle Doutheau
7
, Théo Klump
8
, Michel Sala
9
,
Didier Thibaud
10
, Elisabeth Trepo
11
, Dominique Thabut
12
, Robert P Myers
12
and Thierry Poynard*
12
Address:
1
Laboratoire Alphabio, 23 Rue de Friedland 13006 Marseille, France,
2
Laboratoire de Biochimie, Groupe Hospitalier Pitié-Salpêtrière,
75651 Paris, France,
3
Laboratoire Biomedica, 7 Rue Davat, 73100 Aix les Bains, France,
4
Laboratoire Barla, 10 Avenue Durante, 6000 Nice, France,
5
Laboratoire Clinilab, 42 Avenue de la Plaine Fleurie, 38240 Meylan, France,
6
Laboratoire Delaporte, 37 Rue de la Marne BP 25, 45501 Gien,
France,
7
Laboratoire Marcel Merieux, BP 7322, 69357 Lyon Cedex 07, France,
8
Laboratoire Klump, 1 Rue Kuhn, 67000 Strasbourg, France,
9
Laboratoire Claude Levy, 78 Avenue de Verdun, 94200 Ivry-sur-Seine, France,
10
Laboratoire Sery, 4 Rue Gustave Cazavan, 76600 Le Havre, France,
11
Centre de Biologie République, Centre de Biologie République, 42 Place de la République, 69002 Lyon, France and
12
Service d'Hépato-
Gastroentérologie, Groupe Hospitalier Pitié-Salpêtrière, AP-HP, Université Paris 6 et UPRESA 8067 CNRS Paris, 47 Boulevard de l'Hôpital, 75651
Paris Cedex 13, France
Email: Philippe Halfon - ; Françoise Imbert-Bismut - ;
Djamila Messous - ; Gilles Antoniotti - ;
Didier Benchetrit - ; Philippe Cart-Lamy - ; Gilles Delaporte - ;
Danièle Doutheau - ; Théo Klump - ; Michel Sala - ;
Didier Thibaud - ; Elisabeth Trepo - ; Dominique Thabut - ;
Robert P Myers - ; Thierry Poynard* -
* Corresponding author
Abstract
Background: Biochemical markers for liver fibrosis (FibroTest) and necroinflammatory features
(ActiTest) are an alternative to liver biopsy in patients with chronic hepatitis C. Our aim was to
assess the inter-laboratory variability of these tests, and their 6 components (γ-glutamyl
transpeptidase, alanine aminotransferase, α2-macroglobulin, haptoglobin, apolipoprotein A1, and
total bilirubin) and to identify factors associated with this variability.
Results: Serum of 24 patients with chronic hepatitis C or severe alcoholic liver disease were
prospectively recorded and analyzed in one reference center and in 8 additional laboratories.
When γ-glutamyl transpeptidase and alanine aminotransferase were expressed in international
units, there was no significant difference between laboratories in the results of FibroTest or
ActiTest; kappa statistics were greater than 0.50 with only 0.8% of cases (3/384) with a discordance
of more than one stage. The main factor significantly associated with variability was the expression
of γ-glutamyl transpeptidase and alanine aminotransferase, as multiples of upper limit of reference
values. The use of standardized method with pyridoxal phosphate reduced the variability of alanine
aminotransferase expression, and standardized original Szasz method reduced the variability of γ-
glutamyl transpeptidase expression.
Published: 30 December 2002
Comparative Hepatology 2002, 1:3
Received: 24 September 2002
Accepted: 30 December 2002
This article is available from: />© 2002 Halfon et al; licensee BioMed Central Ltd. This is an Open Access article: verbatim copying and redistribution of this article are permitted in all
media for any purpose, provided this notice is preserved along with the article's original URL.
Comparative Hepatology 2002, 1 />Page 2 of 10
(page number not for citation purposes)
Conclusions: The variability of FibroTest and ActiTest was acceptable without clinical
consequences for the prediction of the stage of liver fibrosis and grade of activity. Standardized
methods and assay calibration should be used and expression of alanine aminotransferase and γ-
glutamyl transpeptidase in multiples of the upper limit of reference values should not be employed.
Background
The "gold standard" for assessing fibrosis, liver biopsy, is
recommended prior to the initiation of antiviral therapy
[1]; in addition, it is vital for monitoring fibrosis progres-
sion. Unfortunately, this procedure is invasive, prone to
complications, including hemorrhage and death [2], and
has a high risk of sampling error [3]. Biochemical markers
for liver fibrosis (FibroTest) and necroinflammatory fea-
tures (ActiTest) are an alternative to liver biopsy, in pa-
tients with chronic hepatitis C [4]. Since the first
publication, which included a validation period [4], those
tests have been validated in different populations by the
same reference laboratory [5,6] and by an independent
group [7]. The tests combine five components (α2-mac-
roglobulin, haptoglobin, apolipoprotein A1, γ-glutamyl
transpeptidase (GGT), and total bilirubin) for FibroTest
and same plus alanine aminotransferase (ALT) for ActiT-
est.
The aim of this study was to assess the inter-laboratory
variability of FibroTest and ActiTest, including their six se-
rum liver components, in patients with chronic liver dis-
ease, and to identify factors associated with that
variability. Our concern was to assess whether the analyt-
ical methods adapted on the different analyzers were asso-
ciated with significant variability in FibroTest and/or
ActiTest values. Moreover, we aimed to compare the vari-
ability of FibroTest and ActiTest in relation to the method
of expressing enzymatic activity; in particular, in terms of
absolute values or as multiples of the upper limit of nor-
mal. Since we and others have demonstrated that current
definitions of normal values may be inappropriate [8–
10], a major concern was the definition of ALT and GGT
activity. In routine practice, the definition of the upper
limit of normal (ULN) of ALT and GGT varies between
laboratories, but is rarely detailed. Because numerous
medical guidelines make reference to ALT and GGT ex-
pressed as multiples of the ULN (ULN units), variations in
the definition of normal may have important practical
consequences.
Results
The main characteristics of the included patients are out-
lined in Table 1. According to each patient and laboratory,
details of the FibroTest and ActiTest assays are given in Fig-
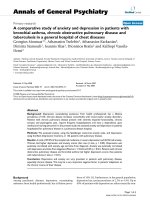
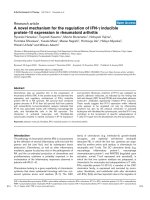
ure 1. There was no significant difference between centers
for FibroTest using GGT expressed in international units
[mean (sd) = 0.57 (0.26), range = 0.48–0.65, F-Ratio =
0.27, p = 0.27]. For FibroTest using GGT expressed in ULN
units [mean (sd) = 0.55 (0.27), range = 0.45–0.68, F-Ratio
= 1.26, p = 0.27], there was a significant difference be-
tween three centers (center 5 had higher means values
than center 2 and 4; p = 0.02 for both comparisons).
There was no significant difference between centers for Ac-
tiTest using ALT and GGT expressed in international units
[mean (sd) = 0.32 (0.26), range = 0.38–0.53, F-Ratio =
1.21, p = 0.30] and for ActiTest using ALT and GGT ex-
pressed in ULN units [mean (sd) = 0.44 (0.27), range =
0.27–0.43, F-ratio = 0.81, p = 0.59).
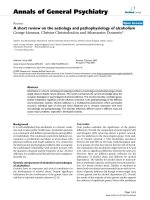
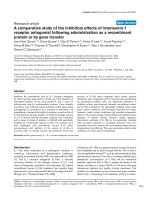
The details of the liver proteins and total bilirubin assays
according to each patient and laboratory are outlined in
Figure 2. There were no significant differences according
to testing center for any of these assays (between centers
or versus the reference center): (α2-macroglobulin [mean
(sd) = 2.89 (1.16) g/l, range = 2.69–3.33, F-Ratio = 0.72,
p = 0.67], haptoglobin [mean (sd) = 0.98 (0.58) g/l, range
= 0.92–1.03, F-Ratio = 0.07, p = 0.99), apolipoprotein A1
[mean (sd) = 1.30 (0.51) g/l, range = 1.16–1.42, F-Ratio =
1.21, p = 0.30] and bilirubin [mean (sd) = 28.8 (66) mi-
cromol/l, range = 15.8–51.1, F-ratio = 0.51, p = 0.85]. One
analyzer (ADVIA) gave lower mean apoliprotein A1 levels
[1.06 (0.43) g/l) than the other analyzers [1.33 (0.52) g/l;
p = 0.02].
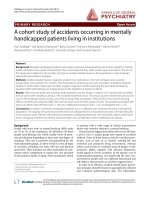
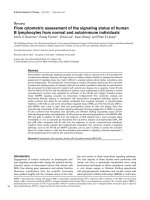
The details of the ALT and GGT assays, according to each
patient and laboratory and expressed in international or
ULN units, are given in Figure 3. There was no significant
difference between centers for ALT expressed in interna-
tional units [mean (sd) = 70 (47) IU/ml, range = 57–86,
F-Ratio = 1.30, p = 0.25]. However, when the assays used
pyridoxal phosphate as in the reference center, the mean
ALT was higher [78 (50) IU/ml] than assays not using py-
ridoxal phosphate [60 (42) IU/ml; p = 0.003]. For ALT ex-
pressed in ULN units [mean (sd) = 48 (37), range = 37–
71, F-Ratio = 1.65, p = 0.12], there was a significant differ-
ence between center 1 and all centers (p = 0.009 vs center
2, p = 0.008 vs center 3, p = 0.04 vs center 4, p = 0.04 vs
center 5, p = 0.02 vs center 6, p = 0.03 vs center 7, p = 0.01
vs center 10 and p = 0.001 vs center 11). There were no sig-
nificant differences between centers for GGT expressed in
international units [mean (sd) = 130 (158) IU/ml, range
= 57–86, F-Ratio = 1.30, p = 0.25] or in ULN units [mean
(sd) = 109 (121) IU/ml, range = 78–154, F-Ratio = 1.46,
p = 0.17]. However, and despite the use of the same Szasz
Comparative Hepatology 2002, 1 />Page 3 of 10
(page number not for citation purposes)
Figure 1
FibroTest and ActiTest variability according to laboratories (centers) and units of enzymatic expression: international units (IU)
and upper limit of normal (UNL).
&HQWHU
)LEUR7HVW,8
&HQWHU
)LEUR7HVW8/1
&HQWHU
$FWL7HVW,8
&HQWHU
$FWL7HVW8/1
Comparative Hepatology 2002, 1 />Page 4 of 10
(page number not for citation purposes)
method, one automate (Dade Behring RXL) gave higher
GGT mean values [165 (200) IU/ml] than the others [120
(143) IU/ml; p = 0.06].
Passing-Bablok linear regression analyses [13] of all sam-
ples between laboratories and the reference center are
summarized in Table 2. The intercept and slope between
the reference center and other laboratories were excellent
for the three proteins with only one decrease for apolipo-
protein A1 in a single center using the ADVIA analyzer.
For total bilirubin, there was only one center with a higher
slope. For the enzymes, there was more variability. For
ALT, mean values were lower in centers not using pyri-
doxal phosphate. For GGT, centers using the RXL analyzer
had a higher slope (greater than 1).
Concordance rates (kappa statistics) among laboratories
are given in Table 3; all were statistically significant. When
GGT and ALT were expressed in international units, Fibro-
Test and ActiTest kappa statistics were all greater than 0.50
with only 0.8% cases (3 out of the 384 comparisons) with
a discordance of more than one fibrosis stage. There was
no discordance greater than one grade for ActiTest. In con-
trast, when GGT and ALT were expressed in ULN units, Fi-
broTest and ActiTest kappa statistics were lower than 0.50
in 11 comparisons (out of the 16 comparisons versus the
reference laboratory) with 5% of cases (21 out of the 384
comparisons) with a discordance of more than one fibro-
sis stage or greater than one activity grade.
Table 1: Characteristics of included patients
Characteristics
Number of patients 24
Liver Disease
HCV 19 (79%)
HCV-HIV 2 (8%)
Alcohol 3 (13%)
Duration of liver disease (years) – mean (sd) 21 (4)
Age at biopsy (years) – mean (sd) 49 (11)
Age at serum sample (years) – mean (sd) 52 (11)
Duration between biopsy and serum sample (years) – mean (sd) 2.7 (1.4)
Male (%) 16 (67%)
Female (%) 8 (33%)
Mode of HCV infection
Transfusion (%) 6 (29%)
IV drug use 9 (42%)
Unknown 6 (29%)
HCV Genotype
31 (5%)
1 20 (95%)
Baseline viral load (median in million IU/ml) 5
Fibrosis stage (unknown in 2)
No fibrosis (F0) 1 (5%)
Portal fibrosis or (F1) 8 (36%)
Few septa (F2) 7 (32%)
Many septa (F3) 0 (0%)
Cirrhosis (F4) 6 (27%)
Activity grade (unknown in 2)
None (A0) 2 (10%)
Mild (A1) 15 (67%)
Moderate (A2) 5 (23%)
Severe (A3) 0 (0%)
Biopsy size (median in mm) 17
Status of patients (response to treatment)
Sustained responder 4 (19%)
Relapser 1 (5%)
Non responder 10 (48%)
Not treated 6 (28%)
HCV – hepatitis C virus; HIV – human immunodeficiency virus; sd – standard deviation.
Comparative Hepatology 2002, 1 />Page 5 of 10
(page number not for citation purposes)
Figure 2
Serum proteins and total bilirubin variability according to laboratory (center).
&HQWHU
Į
0DFURJOREXOLQ
&HQWHU
+DSWRJORELQ
&HQWHU
$
SROLSRSURWHLQ$
&HQWHU
7RWDO%LOLUXELQ
Comparative Hepatology 2002, 1 />Page 6 of 10
(page number not for citation purposes)
Figure 3
Alanine aminotransferase (ALT) and γ-glutamyl transpeptidase (GGT) variability according to laboratory and units of enzymatic
expression: international units (IU) and upper limit of normal (UNL).
&HQWHU
$/7,8
&HQWHU
$/78/1
&HQWHU
**7,8
&HQWHU
**78/1
Comparative Hepatology 2002, 1 />Page 7 of 10
(page number not for citation purposes)
Discussion
This study showed that the variability of FibroTest and Ac-
tiTest values, among nine different laboratories, was ac-
ceptable and without clinical consequences for the
prediction of the stage of liver fibrosis or grade of activity.
This finding is important since it confirms that those tests
can be routinely computed from the results of the six in-
dividual components obtained by non-centralized meas-
urements. Online assessment is available using the
website . To guarantee the
quality of this assessment, it was necessary to identify the
factors associated with the variability of the six compo-
nents.
This study confirms that the expression of ALT and GGT
in multiples of the upper limit of reference values should
be avoided. Despite efforts to standardize enzymatic assay
methods, homogeneity of ALT results has not been
achieved as attested by external quality controls [11], and
identical limits of reference values cannot be defined.
Many clinicians believe that expression of the results as
multiples of the upper limits of reference ranges can re-
duce inter-laboratory variability. Our study confirms pre-
viously observed results [10], that this method of
expression is, in fact, worse than that using international
units both for ALT and GGT. In our reference center, the
reference limit recorded was similar to the described mean
value from a recent study [9] and lower than in the other
laboratories. If ActiTest was expressed in a standardized
way, using the upper limit of each laboratory for GGT and
ALT, this induced lower concordance rate than ActiTest us-
ing international units.
To increase inter-laboratory coherence in the results of en-
zymatic activities, standardized assays against a reference
method should be employed, with calibration of the assay
using a commutable enzymatic material [14]. The values
of this calibrator must be assigned by a reference method.
For proteins and bilirubin assays, there was an excellent
homogeneity. This was anticipated for α2-macroglobulin
since the same analyzer was used in all laboratories. Al-
though the use of three different analyzers, haptoglobin
has the best homogeneity. In fact, the assays of these two
proteins are standardized against the CRM 470 reference
material. This reference product is now used in different
measurement procedures to attain results numerically the
same, whatever the clinical conditions. For apolipopro-
tein A1, only one analyzer was slightly different from the
others. This is due to the use of a different reference mate-
rial to standardize the assay. Overall, the data from the
laboratories were linearly related with the reference center
with a slope close to 1 and a non-significant analytical im-
precision; there were few pairs of assays outside the confi-
dence limits and the samples were adequately distributed
Table 2: Passing-Bablok analysis between laboratories and reference center (LAB 1) for each component
LAB 2 LAB 3 LAB 4 LAB 5 LAB 6 LAB 7 LAB 10 LAB 11
α2-macroglobulin
Intercept (alpha) -0.05 0.13 -0.10 0.22 0.07 0.19 0.13 0.00
Slope (beta) 0.99 1.04 1.08 0.97 1 0.98 0.94 1.24
Pair out of bounds (n)073815311
Haptoglobin
Intercept (alpha) 0.01 0.02 0.01 0.02 -0.05 0.01 0.02 0.02
Slope (beta) 1 0.98 1 0.94 0.99 1.04 1 0.94
Pair out of bounds (n)00221002
Apolipoprotein A1
Intercept (alpha) 0.25 0.02 0.11 -0.04 0.00 -0.04 -0.08 -0.04
Slope (beta) 0.85 0.99 0.87 0.81 1 0.90 1.12 1
Pair out of bounds (n)000170400
Total bilirubin
Intercept (alpha) -2.52 -0.50 -0.03 3.97 0.28 0.05 -5.23 0.30
Slope (beta) 0.95 1 0.58 0.92 0.99 1.18 2.34 0.92
Pair out of bounds (n)41601433
Transaminases – ALT
Intercept (alpha) 15.33 15.00 -0.83 -1.78 0.91 2.99 2.38 -3.33
Slope (beta) 0.98 1 1.04 0.85 0.86 0.79 0.75 1.06
Pair out of bounds (n) 18 19 1 19 12 16 19 1
γ-glutamyl transpeptidase
Intercept (alpha) 7.54 2.48 0.83 10.69 1.56 -0.84 4.72 7.40
Slope (beta) 1.26 1.25 1.01 0.74 1.06 0.90 0.73 1.04
Pair out of bounds (n) 18 20 1 10 4 4 16 12
Comparative Hepatology 2002, 1 />Page 8 of 10
(page number not for citation purposes)
over the investigated range. As previously observed, when
ordinary linear regression (in combination with correla-
tion analysis in the Passing Bablock method) gave poor
estimates, in particular for GGT and ALT assays, we found
several analytical reasons for the poor performance. Enzy-
matic measurement with the Szasz method (standardized
against the original for GGT), and with the standardized
method according to the International Federation of Clin-
ical Chemistry (using pyridoxal phosphate for ALT),
would probably reduce the variability.
Because of their predictive values and their reproducibility
in different populations, biochemical markers could be
used as surrogate markers for liver biopsy both for the in-
itial decision of liver biopsy and for the follow-up of
chronic hepatitis C patients. To date, liver biopsy has been
considered mandatory for the management of patients in-
fected by hepatitis C virus (HCV) [1]. For some patients
and general practitioners, it may be considered an aggres-
sive procedure [2]. Reviews of morbidity and mortality of
intercostal liver biopsy observed a mean occurrence of
pain in 30 % of patients, 3 out of 1,000 endured severe ad-
verse events, and 3 out of 10,000 died [2].
There is no ideal gold standard for the assessment of liver
histology. Even liver biopsy is dependant on the inter- and
intra-observer (pathologist) differences. There are also po-
tential problems with liver biopsy sampling variation. In
a study with three consecutive samples through a single
entry site, only 50 % of patients with cirrhosis were scored
as cirrhosis on the three samples [3]. It is therefore possi-
ble that biochemical markers such as those described may
provide a more accurate (quantitative and reproducible)
picture of fibrogenic events occurring within the liver. Fur-
thermore, and because treatment is now so effective in pa-
tients with genotype 2 or 3 infection, the utility of biopsy
in this setting could be challenged [15].
Conclusions
When GGT and ALT are expressed in international units,
FibroTest and ActiTest can be computed from different
laboratories with acceptable variability. To increase inter-
laboratory coherency, standardized methods and enzy-
matic calibration should be used particularly for GGT and
ALT assays. Expression of ALT and GGT in multiples of the
upper limit of reference values should be avoided.
Table 3: Concordance rates (kappa statistics) of laboratories with reference center (LAB 1), according to the expression of GGT and
ALT activities
Fibrosis stage predicted by FibroTest using IU Fibrosis stage predicted by FibroTest using UNL
Kappa vs reference center
± se
Discordance of more than
1 stage
Kappa vs reference center
± se
Discordance of more than
1 stage
LAB 2 0.72 ± 0.11 0 0.35 ± 0.11 1
LAB 3 0.78 ± 0.11 0 0.83 ± 0.11 0
LAB 4 0.56 ± 0.11 0 0.36 ± 0.10 0
LAB 5 0.32 ± 0.09 1 0.20 ± 0.10 8
LAB 6 0.94 ± 0.11 0 0.89 ± 0.11 0
LAB 7 0.52 ± 0.10 0 0.48 ± 0.10 1
LAB 10 0.52 ± 0.11 1 0.57 ± 0.10 3
LAB 11 0.44 ± 0.11 1 0.73 ± 0.11 1
Activity grade predicted by ActiTest using IU Activity grade predicted by ActiTest using UNL
Kappa vs reference center
± se
Discordance of more than
1 stage
Kappa vs reference center
± se
Discordance of more than
1 stage
LAB 2 0.72 ± 0.12 0 0.32 ± 0.12 2
LAB 3 0.54 ± 0.12 0 0.44 ± 0.12 1
LAB 4 0.88 ± 0.13 0 0.43 ± 0.13 1
LAB 5 0.94 ± 0.13 0 0.56 ± 0.13 0
LAB 6 0.82 ± 0.12 0 0.43 ± 0.13 1
LAB 7 0.82 ± 0.13 0 0.45 ± 0.12 0
LAB 10 0.76 ± 0.13 0 0.38 ± 0.12 0
LAB 11 0.94 ± 0.12 0 0.37 ± 0.12 2
se – standard error
Comparative Hepatology 2002, 1 />Page 9 of 10
(page number not for citation purposes)
Table 4: Laboratory analyzers and biochemical methods
LAB 1 (Reference center) LAB 2 LAB 3
α2-macroglobulin
Analyzer BN2 BN2 BN2
Method Nephelemetry Nephelemetry Nephelemetry
Haptoglobin
Analyzer BN2 BN2 BN2
Method Nephelemetry Nephelemetry Nephelemetry
Apolipoprotein A1
Analyzer BN2 RXL RXL
Method Nephelemetry Turbidimetry Turbidimetry
Total bilirubin
Analyzer Modular RXL RXL
Method Diazoreaction Diazoreaction Diazoreaction
Aminotransferase
Analyzer Modular RXL RXL
Method IFCC Pyridoxal IFCC Pyridoxal IFCC Pyridoxal
γ-glutamyl transpeptidase
Analyzer Modular RXL RXL
Method Szasz standardized Szasz Szasz
LAB 4LAB 5LAB 6
α2-macroglobulin
Analyzer BN2 BN2 BN2
Method Nephelemetry Nephelemetry Nephelemetry
Haptoglobin
Analyzer BN2 Advia1650 Integra 800
Method Nephelemetry Turbidimetry Turbidimetry
Apolipoprotein A1
Analyzer Hitachi 911 Advia 1650 Integra 800
Method Turbidimetry Turbidimetry Turbidimetry
Total bilirubin
Analyzer Hitachi 911 Advia 1650 Integra 800
Method Diazoreaction Diazoreaction Diazoreaction
Aminotransferase
Analyzer Hitachi 911 Advia1650 Integra 800
Method IFCC Pyridoxal IFCC IFCC
γ-glutamyl transpeptidase
Analyzer Hitachi 911 Advia1650 Integra 800
Method Szasz standardized Szasz Szasz standardized
LAB 7 LAB 10 LAB 11
α2-macroglobulin
Analyzer BN2 BN2 Immage
Method Nephelemetry Nephelemetry Nephelemetry
Haptoglobin
Analyzer BN2 BN2 Immage
Method Nephelemetry Nephelemetry Nephelemetry
Apolipoprotein A1
Analyzer Advia 1650 CX5 Immage
Method Turbidimetry Turbidimetry Nephelemetry
Total bilirubin
Analyzer Advia CX7 Vitros 250
Method Diazoreaction Diazoreaction Diazoreaction
Aminotransferase
Analyzer Advia CX7 Vitros 250
Method IFCC IFCC IFCC Pyrydoxal
γ-glutamyl transpeptidase
Analyzer Advia 1650 CX7 Vitros 250
Method Szasz Szasz Szasz
BN2, RXL, Vitros 250: Dade Behring, Marburg, Germany. Hitachi 911, Integra 800: Modular DP Roche Diagnostics, Mannheim, Germany. Immage,
CX5, CX7: Beckman Coulter, Brea, California, USA. Advia 1650: Bayer Diagnostics, Tarrytown, New Jersey, USA. IFCC: International Federation
of Clinical Chemistry.
Comparative Hepatology 2002, 1 />Page 10 of 10
(page number not for citation purposes)
Methods
The serum of 24 informed patients (21 with chronic hep-
atitis C and 3 with decompensated alcoholic cirrhosis)
were prospectively collected in the Department of Hepa-
to-Gastroenterology of the Pitié-Salpêtrière Hospital, in
Paris, France. The main characteristics of the included pa-
tients are outlined in Table 1. Sera were separated in the
above reference laboratory, conserved at + 4°C and dis-
tributed to ten different laboratories, in France, within 24
hours. For two laboratories, serum was missing for at least
one patient; therefore, these laboratories have been ex-
cluded from the core analysis. Sensitivity analyses includ-
ing these two excluded laboratories did not change the
results or conclusions (data not shown).
Characteristics of the analyzer, reagents and analytical
methods employed used in the nine included laboratories
are detailed in Table 4. Eleven different analyzers were
used. For the measurement of ALT activity, five laborato-
ries used a standardized method according to the IFCC,
with pyridoxal phosphate, and four without pyridoxal
phosphate. For the measurement of GGT activity, the nine
laboratories used the Szasz method; including in four a
recommended method of standardization [11].
Haptoglobin and apolipoprotein A1 were assayed by im-
munoturbidimetric or immunonephelemetric methods.
α2-macroglobulin was assayed by immunonephelemetry.
Analytical measurements of α2-macroglobulin and hap-
toglobin were standardized against the certified interna-
tional reference material 470 (CRM 470). Apolipoprotein
A1 assays adapted on the different analyzers were stand-
ardized against the reference material of World Health Or-
ganization-International Federation of Clinical Chemistry
SP1-01 (WHO-IFCC SP1-01), except on the Advia-Bayer-
analyzer (ADVIA). Total bilirubin was assayed by diazore-
actions methods.
Statistical analysis used multiple measure variance analy-
ses and Passing-Bablok linear regression analyses for the
comparison of inter-laboratory results, and kappa statis-
tics for the predicted histological features. Multiple com-
parisons used Bonferroni (versus control) and Tukey-
Kramer multiple-comparison tests. Number Cruncher Sta-
tistical Systems software was used [12]. The linear rela-
tionship between laboratories and reference center were
assessed with confidence limits for the slope and the inter-
cept and the number of pairs out of bounds; they were
used to determine whether there was only a chance differ-
ence between the slope and 1 and between the intercept
and 0 [13]. Means were expressed with standard deviation
(sd), except for kappa statistics.
Authors' contribution
PH, FIB, RPM and TP elaborated the protocol and wrote
the manuscript. PH, FIB, DM, GA, DB, PCL, GD, DD, TK,
MS, DT and ET performed the assays. TP performed the
statistical analysis.
Acknowledgements
Supported by grant from Association pour la Recherche sur les Maladies
Hépatiques Virales.
References
1. EASL International Consensus Conference on hepatitis C. Paris 26–
27 February 1999 Consensus statement. J Hepatol 1999, 31:3-8
2. Poynard T, Ratziu V and Bedossa P Appropriateness of liver biop-
sy. Can J Gastroenterol 2000, 14:543-548
3. Maharaj B, Maharaj RJ, Leary WP, Cooppan RM, Naran AD, Pirie D
and Pudifin DJ Sampling variability and its influence on the di-
agnostic yield of percutaneous needle biopsy of the liver. Lan-
cet 1986, 1 (8480):523-525
4. Imbert-Bismut F, Ratziu V, Pieroni L, Charlotte F, Benhamou Y, Poy-
nard T and for the MULTIVIRC group Biochemical markers of
liver fibrosis in patients with hepatitis C virus infection: a
prospective study. Lancet 2001, 357:1069-1075
5. Poynard T, Imbert-Bismut F, Ratziu V, Chevret S, Jardel C, Moussalli
J, Messous D and Degos F Biochemical markers of liver fibrosis
in patients infected by Hepatitis C Virus: Longitudinal valida-
tion in a randomized trial. J Viral Hepatitis 2002, 9:128-133
6. Myers RP, Benhamou Y, Imbert-Bismut F, Thibault V, Bochet M, Char-
lotte F, Ratziu V, Bricaire F, Katlama C and Poynard T Serum bio-
chemical markers accurately predict liver fibrosis in HIV and
hepatitis C virus-coinfected patients. AIDS
7. Adams L, Rossi E, DeBoer B, Speers D, Macquillan G, Garas G and
Jeffrey G Use of Fibrotest to predict liver fibrosis in hepatitis
C: a replacement for liver biopsy? [abstract] Gastroenterology
2002, 122:1615A
8. Piton A, Poynard T, Imbert-Bismut F, Khalil L, Delattre J, Pelissier E,
Sansonetti N and Opolon P Factors associated with serum
alanine transaminase activity in healthy subjects: conse-
quences for the definition of normal values, for selection of
blood donors, and for patients with chronic hepatitis C.
MULTIVIRC Group. Hepatology 1998, 27:1213-1219
9. Prati D, Taioli E, Zanella A, Della Torre E, Butelli S, Del Vecchio E,
Vianello L, Zanusco F, Mozzi F, Milani S, Conte D, Colombo M and
Sirchia G Updated definitions of healthy ranges for serum
alanine aminotransferase levels. Ann Intern Med 2002, 137:1-9
10. Myara A, Ferard G, Guechot J, Imbert-Bismut F, Lasnier E, Piton A,
Voitot H and Dhumeaux D Calibration to achieve standardiza-
tion in enzymology, example of ALT [abstract]. 14th European
Congress of Clinical Chemistry and Laboratory Medicine, Prague May 26–
31 2001
11. Persijn JP and van der Slik W A new method for the determina-
tion of gamma-glutamyltransferase in serum. J Clin Chem Clin
Biochem 1976, 14:421-427
12. Hintze JL NCSS 2001 User Guide. Number Cruncher Statistical Sys-
tems. Kaysville, Utah 2001,
13. Bablok W, Passing H, Bender R and Schneider B A general regres-
sion procedure for method transformation. Application of
linear regression procedures for method comparison studies
in clinical chemistry, Part III. J Clin Chem Clin Biochem 1988,
26:783-790
14. Ferard G, Edwards J, Kanno T, Lessinger JM, Moss DW, Schiele F, Ti-
etz NW and Vassauly A Interassay calibration as a major con-
tribution to the comparability of results in clinical
enzymology. Clin Biochem 1998, 31:489-494
15. Manns MP, McHutchison JG, Gordon SC, Rustgi VK, Shiffman M, Rein-
dollar R, Goodman ZD, Koury K, Ling M and Albrecht JK Peg-Inter-
feron alfa-2b in combination with ribavirin compared to
interferon alfa-2b plus ribavirin for initial treatment of
chronic hepatitis C. Lancet 2001, 358:958-965