Báo cáo y học: " The diagnostic value of biomarkers (SteatoTest) for the prediction of liver steatosis" pptx
Bạn đang xem bản rút gọn của tài liệu. Xem và tải ngay bản đầy đủ của tài liệu tại đây (398.35 KB, 14 trang )
BioMed Central
Page 1 of 14
(page number not for citation purposes)
Comparative Hepatology
Open Access
Research
The diagnostic value of biomarkers (SteatoTest) for the prediction
of liver steatosis
Thierry Poynard*
1
, Vlad Ratziu
1
, Sylvie Naveau
2
, Dominique Thabut
1
,
Frederic Charlotte
3
, Djamila Messous
4
, Dominique Capron
5
, Annie Abella
6
,
Julien Massard
1
, Yen Ngo
1
, Mona Munteanu
7
, Anne Mercadier
8
,
Michael Manns
9
and Janice Albrecht
10
Address:
1
Department of Hepato-Gastroenterology, Groupe Hospitalier Pitié-Salpêtrière, Paris, France,
2
Department of Hepato-Gastroenterology,
Hôpital Antoine Béclère, Clamart, France,
3
Department of Pathology, Groupe Hospitalier Pitié-Salpêtrière, Paris, France,
4
Department of
Biochemistry, Groupe Hospitalier Pitié-Salpêtrière, Paris, France,
5
Department of Pathology, Hôpital Antoine Béclère, Clamart, France,
6
Department of Biochemistry, Hôpital Antoine Béclère, Clamart, France,
7
Biopredictive, Paris, France,
8
Tranfusion Unit, Groupe Hospitalier Pitié-
Salpêtrière, Paris, France,
9
Division of Gastroenterology and Hepatology, Medical School of Hannover, Hannover, Germany and
10
Schering
Plough Research Institute, Kenilworth NJ, USA
Email: Thierry Poynard* - ; Vlad Ratziu - ; Sylvie Naveau - ;
Dominique Thabut - ; Frederic Charlotte - ;
Djamila Messous - ; Dominique Capron - ;
Annie Abella - ; Julien Massard - ; Yen Ngo - ;
Mona Munteanu - ; Anne Mercadier - ; Michael Manns - manns.michael@mh-
hannover.de; Janice Albrecht -
* Corresponding author
Abstract
Background: Biopsy is the usual gold standard for liver steatosis assessment. The aim of this study was to identify a
panel of biomarkers (SteatoTest), with sufficient predictive values, for the non-invasive diagnosis of steatosis in patients
with or without chronic liver disease. Biomarkers and panels were assessed in a training group of consecutive patients
with chronic hepatitis C and B, alcoholic liver disease, and non-alcoholic fatty liver disease, and were validated in two
independent groups including a prospective one. Steatosis was blindly assessed by using a previously validated scoring
system.
Results: 310 patients were included in the training group; 434 in three validation groups; and 140 in a control group.
SteatoTest was constructed using a combination of the 6 components of FibroTest-ActiTest plus body mass index, serum
cholesterol, triglycerides, and glucose adjusted for age and gender. SteatoTest area under the ROC curves was 0.79 (SE
= 0.03) in the training group; 0.80 (0.04) in validation group 1; 0.86 (0.03) in validation group 2; and 0.72 (0.05) in the
validation group 3 – all significantly higher than the standard markers: γ-glutamyl-transpeptidase or alanine
aminotransferase. The median SteatoTest value was 0.13 in fasting controls; 0.16 in non-fasting controls; 0.31 in patients
without steatosis; 0.39 in grade 1 steatosis (0–5%); 0.58 in grade 2 (6–32%); and 0.74 in grade 3–4 (33–100%). For the
diagnosis of grade 2–4 steatosis, the sensitivity of SteatoTest at the 0.30 cut-off was 0.91, 0.98, 1.00 and 0.85 and the
specificity at the 0.70 cut-off was 0.89, 0.83, 0.92, 1.00, for the training and three validation groups, respectively.
Conclusion: SteatoTest is a simple and non-invasive quantitative estimate of liver steatosis and may reduce the need
for liver biopsy, particularly in patients with metabolic risk factor.
Published: 23 December 2005
Comparative Hepatology 2005, 4:10 doi:10.1186/1476-5926-4-10
Received: 05 August 2005
Accepted: 23 December 2005
This article is available from: />© 2005 Poynard et al; licensee BioMed Central Ltd.
This is an Open Access article distributed under the terms of the Creative Commons Attribution License ( />),
which permits unrestricted use, distribution, and reproduction in any medium, provided the original work is properly cited.
Comparative Hepatology 2005, 4:10 />Page 2 of 14
(page number not for citation purposes)
Background
Fatty liver or hepatic steatosis is defined as an excessive
accumulation of fat in hepatocytes [1]. On worldwide
grounds, the prevalence of steatosis is very high, and is
associated with several factors such as alcohol, diabetes,
overweight, hyperlipidemia, insulin resistance, hepatitis C
genotype 3, abetalipoproteinemia and administration of
some drugs [1-4].
Fatty liver disease involves the accumulation of triglycer-
ides in hepatocytes, apoptosis, hepatocellular ballooning,
Mallory's hyaline, necrosis of hepatocytes, lobular inflam-
mation [5,6], small hepatic vein obliteration [7] and often
fibrosis with possible progression to cirrhosis, hepatocel-
lular cancer and liver-related death [1,4,8,9].
Non-alcoholic fatty liver disease (NAFLD) is an adaptive
response of the liver to insulin resistance. The natural pro-
gression of insulin resistance and endogenous noxious
insults (such as free radical production, mitochondrial
dysfunction, endotoxin) which are, at least in part, related
to the presence of excessive fat in the liver, can trigger the
development of non-alcoholic steatohepatitis (NASH).
NASH itself can induce a fibrogenic response that can
result in cirrhosis [5,6].
In patients with alcoholic liver disease (ALD) [10,11],
chronic hepatitis C [12], and possibly in those with hepa-
titis B [13], the presence of steatosis is also associated with
fibrosis progression, with or without associated necroin-
flammatory lesions (alcoholic or viral hepatitis).
Current guidelines recommend liver biopsy as part of the
management of chronic liver disease [14]. This procedure
provides important information regarding the degree of
liver damage, in particular the severity of necroinflamma-
tory activity, fibrosis and steatosis [14]. Unfortunately,
liver biopsy has a potential sampling error, is invasive,
costly and prone to complications as well [15-19]. Up to
30% of patients experience pain following the procedure;
0.3% have severe complications; and mortality
approaches 0.01% [20,21].
As a result of those limitations as well as patient reluc-
tance to undergo liver biopsy, the estimate of liver injury
using non-invasive biomarkers has gained a growing
importance [20-22]. For the diagnosis of fibrosis, Fibro-
Test (FT) (Biopredictive, Paris France) has been validated
as a surrogate marker in chronic hepatitis C [23] and B
[24] and, recently, in ALD [25,26]. A preliminary study
has also observed a similar diagnostic value in NAFLD
[27]. ActiTest (AT) (Biopredictive, Paris France) has been
validated as a surrogate marker for necrosis in chronic
hepatitis C [23] and B [24]. Nonetheless, and despite
those tests, biopsy was still useful for the diagnosis of stea-
tosis and steatohepatitis.
For the diagnosis of steatosis, there is no standard recom-
mendation. The usual recommendation is to measure γ-
glutamyl-transpeptidase (GGT) and alanine aminotrans-
ferase (ALT) and, in addition, to perform liver biopsy for
grading and staging [1,3,4,14]. The evaluation of liver
steatosis using ultrasonography is subjective as based on
echo intensity (echogenicity) and special patterns of ech-
oes (texture) and is inaccurate in patients with advanced
fibrosis [28]. Up to now, no study has demonstrated that
a single or a panel of biomarkers can be used as an alter-
native to liver biopsy for the diagnosis of steatosis,
whether induced by alcohol, viral hepatitis or NAFLD, the
most common causes of steatosis.
The objective of the current study was to create a new
panel of biomarkers known as SteatoTest (ST) with suffi-
cient predictive values for the diagnosis of steatosis due to
alcohol, NAFLD and hepatitis C and B. Serum GGT and
ALT were considered as the standard biochemical markers
[3].
Results
Patients
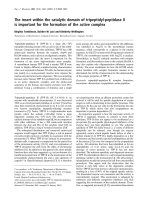
A total of 2,272 subjects were analyzed (Figure 1), being
884 subjects included in the biomarker validation study,
distributed as follows: 310 patients in the training group;
171 in the validation group 1; 201 in the validation group
2; 62 in the validation group 3; and 140 subjects in the
control group. The 1,388 non-included patients were not
significantly different from the 884 patients integrated in
the validation assay (data not shown).
Comparison between groups (Table 1)
Patients included in the 4 groups were similar in age with
a predominance of male subjects (range 61–76%). The
prevalence of steatosis greater than 5% (grades 2 to 4) var-
ied from 11% in hepatitis C virus (HCV) cured patients to
94% in patients with ALD. In all groups, at least one met-
abolic risk factor was observed in more than 50% of
included patients. Patients in group 3 with alcoholic liver
disease were more often male, older, had smaller liver
biopsies, more metabolic risk factors, more extensive
fibrosis and more grades 2–4 steatosis than the three other
groups. Validation group 2 with HCV cured patients had
quasi-normal characteristics with normal liver tests and
only 11% grade 2–4 steatosis.
Factors associated with steatosis (Table 2)
In the training group the most significant components
associated with the presence of grade 2–4 steatosis in uni-
variate analysis were body mass index (BMI), age, ALT,
aspartate aminotransferase (AST), GGT, glucose, and trig-
Comparative Hepatology 2005, 4:10 />Page 3 of 14
(page number not for citation purposes)
lycerides. The logistic regression defining the ST included
12 components – ALT, α
2
-macroglobulin (A2M), apolipo-
protein A-I (ApoA1), haptoglobin, total bilirubin, GGT,
cholesterol, triglycerides, glucose, age, gender and BMI. In
logistic regression analyses, the most significant compo-
nents were BMI (P = 0.0002), GGT (P = 0.002), ApoA1 (P
= 0.01), A2M (P = 0.02), ALT (P = 0.03) and triglycerides
(P = 0.04). In the validation group, similar differences
were observed, most significantly for BMI, GGT, ALT and
triglycerides (Table 2).
Distribution of SteatoTest according to steatosis grades
(Figure 2)
The median ST value was 0.13 in fasting controls; 0.18 in
non-fasting controls; 0.14 in blood donors; 0.26 in
patients without steatosis; 0.43 in grade 1 steatosis; 0.62
in grade 2; 0.70 in grade 3; and 0.75 in grade 4. Because
there were not a sufficient number of patients with grade
3 and 4, these two groups were combined (Figure 2).
Diagnostic value of SteatoTest (Tables 3 and 4)
The values {Area under the ROC curves (AUROCs)} of ST,
GGT and ALT for the diagnosis of grades 2–4 steatosis, in
the training and validation groups, are given in Table 3. ST
had higher AUROCs: {0.79 (SE = 0.03)} in training
group; 0.80 (0.04) in validation group 1; 0.86 (0.03) in
validation group 2; and 0.72 (0.05) in validation group 3.
These were always significantly higher than the AUROCs
of GGT and significantly higher than the AUROCs of ALT,
for the training group and validation group 1 (Table 3).
The distribution of ST, GGT and ALT, according to the
severity of steatosis, is illustrated in Figure 2 for the train-
ing and validation groups.
The diagnostic values of ST, GGT and ALT according to
cutoffs are shown in Table 4. For the diagnosis of grade 2–
4 steatosis, the sensitivity of ST at the 0.30 cut-off was
0.91, 0.98, 1.00 and 0.85 and the specificity at the 0.70
cut-off was 0.89, 0.83, 0.92, and 1.00, for the training and
validation groups, respectively.
In the training group, there were 56 cases (18%) of signif-
icant discordance between steatosis percentage as pre-
dicted by ST and that observed in biopsy samples. Failure
attributable to ST (false positive of ST) was suspected in
one case that had acute drug hepatitis associated with
chronic hepatitis B. Failure attributable to biopsy (false
negatives of biopsy) was suspected in 16 cases with poor
quality biopsy samples (median length 13 mm, 2 frag-
ments) and, at least, one metabolic risk factor. For the val-
Flow chart of patients analyzed and included in the training and validation groupsFigure 1
Flow chart of patients analyzed and included in the training and validation groups.
896 non-included
583 biopsy or biomarkers missing
313 duration biopsy-markers 4w+
327 non-included
46 biopsy or biomarkers missing
281 duration biopsy-markers12w+
171 included
Validation Group 1
HCV detectable
Baseline
498 patients
68 non-included
68 biopsy or biomarkers missing
0 duration biopsy-markers 4w+
201 included
Validation Group 2
HCV undetectable
24 weeks follow-up
269 patients
96 non-included
88 biopsy or biomarkers missing
8 duration biopsy-markers 4w+
62 included
Validation Group 3
ALD
Beclere
158 patients
1 non-included
1biomarkersmissing
140 included
29 fasting volunteers
29 non-fasting volunteers
82 non-fasting blood-donors
Control Group
Blood donors and volunteers
GHPS
141 controls
Validation Groups
SteatoTest Constructed
310 included
NAFLD
ALD
HCV HBV
Training Group
GHPS
1206 patients
Comparative Hepatology 2005, 4:10 />Page 4 of 14
(page number not for citation purposes)
Table 1: Characteristics of the patients.
Characteristics Training
group
Validation Group 1 –
HCV before treatment
Validation Group 2 –
HCV sustained
responders
Validation Group 3 –
Alcoholic liver
disease
Number of patients 310 171 201 62
Age at biopsy, years 48.9 (12.4) 44.1 (7.2) 43.6 (8.0) 46.6 (9.8)
Male 201 (65%) 111 (65%) 122 (61%) 47/62 (76%)
Female 109 (35%) 60 (35%) 79 (39%) 15 (24%)
BMI, kg/m
2
25.4 (5.1) 27.7 (5.0) 26.5 (4.8) 24.2 (4.1)
Biopsy quality
Length 17.0 (6.2) 16.6 (15.5) 17.0 (8.2) 13.5 (6.8)
Length ≥ 15 mm 205 (67%) 82 (48%) 96 (48%) 15 (24%)
Number of fragments 2.5 (2.3) - - 1.9 (1.6)
One fragment 128/278 (46%) - - 37 (60%)
Duration biopsy-serum, mean (days range) 1 (0–30) 40 (0–90) 11 (0–45) 7 (0–14)
Liver Risk factor
HCV 211 (68%) 171 (100%) 0 (0%) 0 (0%)
HBV 18 (6%) 0 (0%) 0 (0%) 0 (0%)
NAFLD 69 (22%) 0 (0%) 0 (0%) 0 (0%)
ALD 12 (4%) 0 (0%) 0 (0%) 0 (0%)
Daily alcohol = 50 g/day 34/236 (14%) 0 (0%) 0 (0%) 62 (100%)
Cured HCV infection 0 (0%) 0 (0%) 201 (100%) 0 (0%)
Metabolic factor
BMI ≥ 27.0 92 (30%) 88 (51%) 77 (38%) 14 (23%)
Glucose ≥ 6.0 mmol/L 63 (20%) 30 (18%) 27 (13%) 20 (32%)
Triglycerides ≥ 1.7 mmol/L 67 (22%) 36 (21%) 54 (27%) 20 (32%)
Cholesterol ≥ 6.0 mmol/L 61 (20%) 12 (7%) 26 (13%) 23 (37%)
Metabolic factor: number per patient
None 132 (43%) 60 (35%) 96 (48%) 17 (27%)
One 101 (33%) 64 (37%) 72 (36%) 20 (32%)
Two 52 (17%) 39 (23%) 31 (15%) 19 (31%)
Three 22 (7%) 8 (5%) 0 (0%) 5 (8%)
Four 3 (1%) 0 (0%) 2 (1%) 1 (2%)
Liver steatosis grade
None (0%) 130 (42%) 58 (34%) 116 (58%) 2 (3%)
Mild (Score 1–5%) 40 (13%) 68 (40%) 63 (31%) 2 (3%)
Moderate (Score 6–33%) 69 (22%) 35 (20%) 17 (8%) 42 (68%)
Marked (Score 34–66%) 36 (12%) 7 (4%) 4 (3%) 12 (19%)
Severe (Score 67–100%) 35 (11%) 3 (2%) 1 (0.5%) 4 (7%)
Liver fibrosis stage at biopsy
F0 – No fibrosis 62 (20%) 0 (0%) 16 (8%) 8 (13%)
F1 – Fibrosis without septa 127 (41%) 102 (60%) 136 (68%) 23 (37%)
F2 – Few septa 52 (17%) 39 (23%) 33 (16%) 11 (18%)
F3 – Many septa 36 (11%) 19 (11%) 9 (4%) 7 (11%)
F4 – Cirrhosis 33 (11%) 11 (6%) 7 (3%) 13 (21%)
Markers (normal range)
AST, IU/L (17–27 female; 20–32 male) 83 (159) 82 (57) 23 (9) 89 (83)
ALT, IU/L (11–26 female; 16–35 male) 109 (114) 118 (94) 19 (10) 72 (88)
Total bilirubin, mol/L (1–21) 14.8 (26.2) 11.1 (4.8) 8.8 (4.6) 21.5 (19.6)
GGT, U/L (7–32 female; 11–49 male) 112 (183) 84 (96) 21 (18) 323 (443)
A2M, g/L (female 1·6-4·0; male 1·4-3·3) 2.4 (1.0) 3.1 (1.2) 2.0 (0.8) 1.8 (0.5)
ApoA1 g/L (1·2-1·7) 1.4 (0.3) 1.3 (0.3) 1.2 (0.3) 1.5 (0.5)
Haptoglobin, g/L (0·35-2·00)* 0.95 (0.57) 0.78 (0.45) 0.86 (0.43) 1.39 (0.63)
Glucose, mmol/L 5.5 (3.2) 5.4 (1.2) 5.3 (1.0) 5.8 (1.6)
Cholesterol, mmol/L 4.9 (1.3) 4.5 (1.0) 5.0 (1.0) 5.4 (1.9)
Triglycerides, mmol/L 1.5 (1.4) 1.4 (0.8) 1.6 (1.0) 1.9 (3.1)
FibroTest 0.42 (0.28) 0.47 (0.26) 0.29 (0.20) 0.43 (0.28)
SteatoTest 0.49 (0.25) 0.53 (0.22) 0.36 (0.22) 0.58 (0.25)
Data are mean (SD) or proportion. BMI = body mass index; HCV = hepatitis C virus; HBV = hepatitis B virus; NAFLD = non-alcoholic fatty liver
disease; ALD = alcoholic liver disease; AST = aspartate aminotransferase; ALT = alanine aminotransferase; GGT = γ-glutamyl transpeptidase; A2M =
α
2
-macroglobulin; ApoA1 = apolipoprotein A1.
Comparative Hepatology 2005, 4:10 />Page 5 of 14
(page number not for citation purposes)
Table 2: Characteristics of the patients, according to the presence of steatosis.
Characteristic Steatosis Training Group Steatosis Validation Group 1 – HCV before
treatment
< 5%, n = 170 ≥ 5%, n = 140 P value No, n = 126 Yes, n = 45 P value
Demographics
Age at biopsy, years 46.7 (12.4) 51.8 (12.1) 0.0004 43.7 (7.3) 45.2 (7.0) 0.28
Male gender 110 (55%) 91 (45%) 0.96 81 (64%) 30 (67%) 0.77
BMI 24 (4) 27 (6) < 0.0001 27 (5) 31 (4) < 0.0001
Biochemical markers
α
2
-macroglobulin, g/L 2.47 (1.00) 2.30 (1.04) 0.07 3.10 (1.23) 3.20 (1.24) 0.50
ALT, IU/L 104 (119) 115 (108) 0.02 46 (45) 61 (48) 0.003
AST, IU/L 83 (204) 83 (78) 0.01 80 (61) 88 (43) 0.01
Apolipoprotein A1, g/L 1.46 (0.34) 1.42 (0.33) 0.30 1.27 (0.26) 1.20 (0.24) 0.18
Haptoglobin, g/L 0.93 (0.60) 0.96 (0.52) 0.19 0.77 (0.45) 0.78 (0.44) 0.84
GGT, IU/L 83 (132) 147 (226) < 0.0001 72 (85) 118 (116) 0.0007
Total bilirubin, µmol/L 14.8 (31.4) 14.7 (17.8) 0.47 11.0 (5.0) 11.3 (4.1) 0.38
Glucose mmol/L 5.1 (3.7) 5.9 (2.2) < 0.0001 5.2 (0.9) 6.0 (1.8) 0.0007
Triglycerides, mmol/L 1.24 (0.95) 1.88 (1.78) < 0.0001 1.26 (0.72) 1.72 (1.0) 0.0008
Total cholesterol, mmol/L 4.8 (1.2) 5.1 (1.4) 0.10 4.5 (1.0) 4.4 (1.0) 0.10
FibroTest 0.40 (0.29) 0.45 (0.28) 0.47 0.45 (0.26) 0.53 (0.24) 0.07
SteatoTest 0.38 (0.21) 0.62 (0.22) < 0.0001 0.47 (0.21) 0.70 (0.16) < 0.0001
Characteristic Steatosis Validation Group 2 – HCV sustained
responders
Steatosis Validation Group 3 – Alcoholic liver
disease
No n = 179 Yes n = 22 P value < 5%, n = 4 ≥ 5%, n = 58 P value
Demographics
Age at biopsy, years 43.7 (8.1) 43.1 (7.0) 0.7 38.0 (12.8) 47 (9.4) 0.16
Male gender 110 (62%) 12 (55%) 0.53 2 (50%) 45 (78%) 0.21
BMI 26 (4) 31 (6) <0.0001 22.9 (2.9) 24.3 (4.2) 0.49
Biochemical markers
α
2
-macroglobulin, g/L 2.08 (0.79) 1.73 (0.66) 0.06 2.12 (0.53) 1.81 (0.55) 0.26
ALT, IU/L 18 (9) 26 (9) <0.0001 35 (24) 74 (90) 0.10
AST, IU/L 23 (9) 25 (7) 0.06 74 (43) 58 (90) 1.00
Apolipoprotein A1, g/L 1.16 (0.28) 1.07 (0.25) 0.2 1.67 (0.43) 1.48 (0.49) 0.49
Haptoglobin, g/L 0.85 (0.41) 0.94 (0.56) 0.85 1.55 (0.92) 1.38 (0.62) 0.85
GGT, IU/L 20 (18) 28 (14) 0.0002 327 (184) 323 (323) 0.41
Total bilirubin, µmol/L 8.9 (4.6) 8.1 (4.3) 0.3 28.5 (23.4) 21.1 (19.5) 0.28
Glucose, mmol/L 5.3 (1.0) 5.5 (0.8) 0.16 6.5 (2.2) 5.7 (1.6) 0.46
Triglycerides, mmol/L 1.49 (0.98) 2.05 (1.22) 0.003 1.05 (0.51) 1.96 (3.15) 0.28
Total cholesterol, mmol/L 5.0 (1.0) 5.1 (0.9) 0.51 6.0 (1.38) 5.4 (2.0) 0.68
FibroTest 0.29 (0.20) 0.26 (0.19) 0.46 0.43 (0.32) 0.43 (0.28) 0.79
SteatoTest 0.32 (0.20) 0.62 (0.17) <0.0001 0.44 (0.03) 0.59 (0.26) 0.21
Data are mean (SD) or proportion.
idation' groups, significant discordance was observed in
17 cases (16%) in group 1; 20 cases (10%) in group 2; and
13 cases (21%) in group 3. Significant discordance was
observed more often in patients with extensive fibrosis
(stage F3 or F4): 38 cases out of 135 (28%) versus 91 cases
out of 609 (15%) – P = 0.001.
Repeated biopsies and repeated SteatoTest
A total of 75 patients were included with biopsy at base-
line and at follow-up. Among them, 23 had an improve-
ment of steatosis (one of 3 grades, two of 2 grades and
twenty of one grade); 43 had no change in steatosis grade;
and 9 had worsening of one grade. ST significantly
decreased in 23 patients with steatosis improvement at
biopsy from 0.60 (SE = 0.05) to 0.41 (0.05), a signifi-
cantly greater difference (P = 0.001) than that observed in
52 patients without biopsy improvement: from 0.44
(0.03) to 0.31 (0.03).
Integrated database
A total of 884 subjects were included in the integrated
database combining the training group, the three valida-
Comparative Hepatology 2005, 4:10 />Page 6 of 14
(page number not for citation purposes)
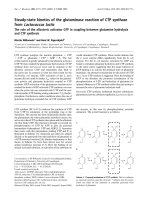
Relationship between ST, GGT and ALT and the grade of liver steatosisFigure 2
Relationship between ST, GGT and ALT and the grade of liver steatosis. A four grades scoring system was used to
assess steatosis: S0 – no steatosis; S1 – mild, 1 to 5%; S2 – moderate, 6 to 32%; S3-S4 – marked or severe, 33 to 100%.
Notched box plots showing the relationship (A) in the training group; (B) in validation group 1, HCV patients before treatment;
(C) group 2, HCV sustained responders; (D) group 3, alcoholic liver disease; and (E) in controls, healthy volunteers fasting and
non-fasting and non-fasting blood donors. The horizontal line inside each box represents the median and the width of each box
the median ± 1.57 interquartile range/vn for assessing the 95% level of significance between group medians. Failure of the
shaded boxes to overlap corresponds to statistical significance (P < 0.05). The horizontal lines above and below each box
encompass the interquartile range (from 25
th
to 75
th
percentile), and the vertical lines from the ends of the box encompass the
adjacent values (upper: 75
th
percentile plus 1.5 times interquartile range, lower 25
th
percentile minus 1.5 times interquartile
range). In validation group 3, almost all patients had steatosis and group S0 and S1 were combined.
A: Tr aining Group
0.00
0.10
0.20
0.30
0.40
0.50
0.60
0.70
0.80
0.90
1.00
S0 S1 S2 S3-S4
Steat osis Grade
SteatoTest
000
020
040
060
080
100
120
140
160
180
200
S0 S1 S2 S3- S4
Steatos is Grade
GGT
000
020
040
060
080
100
120
140
160
180
200
S0 S1 S2 S3- S4
Steatosis Grade
ALT
B: Validation Group 1
0.00
0.10
0.20
0.30
0.40
0.50
0.60
0.70
0.80
0.90
1.00
S0 S1 S 2 S3-S4
Steatosis Grade
SteatoTest
0
20
40
60
80
100
120
140
160
180
200
S0 S1 S2 S3
Steatosis Grade
GGT
0
20
40
60
80
100
120
140
160
180
200
S0 S1 S2 S3-S4
Steatosis Grade
ALT
C: Val idation Group 2
0.00
0.10
0.20
0.30
0.40
0.50
0.60
0.70
0.80
0.90
1.00
S0 S1 S2 S3-S4
Steatosis Grade
Steat oTest
0
20
40
60
80
100
120
140
160
180
200
S0 S1 S2 S3-S
4
Steatosis Grade
GGT
0
20
40
60
80
100
120
140
160
180
200
S0 S1 S2 S3-S4
Steatosis Grade
ALT
D: Val idation Group 3
0.00
0.10
0.20
0.30
0.40
0.50
0.60
0.70
0.80
0.90
1.00
S0- S1 S2 S3- S4
Steatosis Grade
SteatoTest
0
20
40
60
80
100
120
140
160
180
200
S0-S1 S2 S3
Steatosis Grade
GGT
0
20
40
60
80
100
120
140
160
180
200
S0-S1 S2 S3-S4
Steatosis Grade
ALT
E: SteatoTest in Control Groups
0.00
0.10
0.20
0.30
0.40
0.50
0.60
0.70
0.80
0.90
1.00
Blood don ors Volunteers-fa sting Volunteers-non- fasting
Control Groups
SteatoTest
Comparative Hepatology 2005, 4:10 />Page 7 of 14
(page number not for citation purposes)
tion groups and the control group. Of these, 75 patients
with HCV were investigated twice (once before and then
after treatment), and 29 volunteers were investigated
twice (while fasting and, then, non-fasting). There was a
very significant overall correlation between ST and the
steatosis grades from controls to S3 (Figure 3). For ST,
there was a significant difference between all histological
grades by Tukey-Kramer multiple comparison test for all
pairwise differences between means (P < 0.05). For GGT
and ALT, there was no significant difference between S0
and S1. For ALT, there was no significant difference
between S0 and S2, S1 and S2, and S2 and S3, either. ST
has higher AUROC, 0.80 (0.02) than all the isolated com-
ponents for the diagnosis of steatosis grade 2–4: ALT, GGT
Table 4: Diagnostic value of SteatoTest for predicting liver steatosis greater than 5%.
Cut-off Sensitivity Specificity Positive Predictive
Value
Negative Predictive
Value
Training Group N = 310 Prevalence = 45%
SteatoTest 0.30 0.91 (127/140) 0.45 (77/170) 0.58 (127/220) 0.86 (77/90)
SteatoTest 0.50 0.69 (97/140) 0.74 (126/170) 0.69 (97/141) 0.75 (126/169)
SteatoTest 0.70 0.45 (63/140) 0.89 (152/170) 0.78 (63/81) 0.66 (152/229)
GGT 50 IU/L 0.66 (92/140) 0.55 (94/170) 0.55 (92/168) 0.66 (94/142)
ALT 50 IU/L 0.77 (108/140) 0.35 (60/170) 0.50 (108/218) 0.65 (60/92)
Validation Group1 N =
171
Prevalence = 26%
SteatoTest 0.30 0.98 (44/45) 0.24 (30/126) 0.31 (44/140) 0.97 (30/31)
SteatoTest 0.50 0.89 (40/45) 0.58 (73/126) 0.43 (40/93) 0.94 (73/78)
SteatoTest 0.70 0.44 (20/45) 0.83 (105/126) 0.49 (20/41) 0.81 (105/130)
GGT 50 IU/L 0.62 (28/45) 0.61 (72/126) 0.34 (28/82) 0.81 (72/89)
ALT 50 IU/L 1.00 (45/45) 0.06 (8/126) 0.28 (45/163) 1.00 (8/8)
Validation Group 2 N =
201
Prevalence = 11%
SteatoTest 0.30 1.00 (22/22) 0.56 (100/179) 0.22 (22/101) 1.00 (100/100)
SteatoTest 0.50 0.68 (15/22) 0.79 (142/179) 0.29 (15/52) 0.95 (142/149)
SteatoTest 0.70 0.32 (7/22) 0.92 (165/179) 0.33 (7/21) 0.92 (165/180)
GGT 50 IU/L 0.09 (2/22) 0.97 (174/179) 0.29 (2/7) 0.90 (174/194)
ALT 50 IU/L 0.05 (1/22) 0.98 (176/179) 0.25 (1/3) 0.89 (176/197)
Validation Group 3 N =
62
Prevalence = 94%
SteatoTest 0.30 0.85 (49/58) 0.00 (0/4) 0.93 (49/53) 0.00 (0/9)
SteatoTest 0.50 0.62 (36/58) 1.00 (4/4) 1.00 (36/36) 0.15 (4/26)
SteatoTest 0.70 0.40 (23/58) 1.00 (4/4) 1.00 (23/23) 0.10 (4/39)
GGT 50 IU/L 0.90 (52/58) 0.00 (0/4) 0.93 (52/56) 0.00 (0/6)
ALT 50 IU/L 0.53 (31/58) 0.75 (3/4) 0.97 (31/32) 0.10 (3/30)
All Groups N = 884 Prevalence = 30%
SteatoTest 0.30 0.90 (238/265) 0.54 (336/619) 0.46 (238/521) 0.93 (336/363)
SteatoTest 0.50 0.72 (190/265) 0.75 (466/619) 0.55 (190/343) 0.86 (466/541)
SteatoTest 0.70 0.46 (122/265) 0.88 (546/619) 0.63 (122/195) 0.79 (546/689)
GGT 50 IU/L 0.66 (174/265) 0.76 (468/619) 0.54 (174/325) 0.84 (468/559)
ALT 50 IU/L 0.72 (185/265) 0.62 (382/619) 0.44 (185/422) 0.83 (382/462)
Table 3: Values {Area under the ROC curves (AUROCs)} of SteatoTest, GGT and ALT for the diagnosis of steatosis greater than 5%,
in both training and validation groups.
Diagnostic panel Training Group
AUROC (se)
Validation Group 1
– HCV before
treatment
Validation Group 2
– HCV sustained
responders
Validation Group 3
– Alcoholic liver
disease
All groups
N = 310 N = 171 N = 201 N = 62 N = 884
SteatoTest 0.79 (0.03)* 0.80 (0.04)£ 0.86 (0.03) $ 0.72 (0.05)** 0.80 (0.02) ££
GGT 0.66 (0.03) 0.67 (0.05) 0.74 (0.05) 0.50 (0.09) 0.66 (0.02)
ALT 0.58 (0.03) 0.62 (0.05) 0.79 (0.04) 0.66 (0.07) 0.61 (0.02)
* – Higher than GGT (P < 0.0001) and ALT (P < 0.0001); £ – Higher than GGT (P = 0.007) and ALT (P < 0.0001); $ – Higher than GGT (P = 0.02);
** – Higher than GGT (P = 0.002); ££ Higher than GGT (P < 0.0001) and ALT (P < 0.0001).
Comparative Hepatology 2005, 4:10 />Page 8 of 14
(page number not for citation purposes)
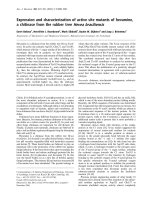
Relationship between ST, and the grade of liver steatosis in the integrated database combining controls, training group and val-idation groupsFigure 3
Relationship between ST, and the grade of liver steatosis in the integrated database combining controls, train-
ing group and validation groups. Failure of the shaded boxes to overlap indicates statistical significance between medians
(P < 0.05). There was a significant difference between all grades by the Tukey-Kramer multiple comparison test for all pairwise
differences between means (P < 0.05). For GGT and ALT, there was no significant difference between S0 and S1 and between
S2 and S3. For ALT, there was also no significant difference between S0 and S2, S1 and S2.
0.00
0.10
0.20
0.30
0.40
0.50
0.60
0.70
0.80
0.90
1.00
Controls No Steatosis < 5 % 6-32% 33-100%
SteatoTest
0
20
40
60
80
100
120
140
160
180
200
Controls No Steatosis <5% 6-32% 33-100%
GGT
0
20
40
60
80
100
120
140
160
180
200
Controls No Steatosis <5% 6-32% 33-100%
ALT
Comparative Hepatology 2005, 4:10 />Page 9 of 14
(page number not for citation purposes)
(Table 3), triglycerides 0.63 (0.02), BMI 0.61 (0.02), glu-
cose 0.61 (0.02), bilirubin 0.60 (0.02), ApoA1 0.56
(0.02), A2M 0.56 (0.02) and cholesterol 0.53 (0.02) – all
P values < 0.03.
A cut-off of 0.30 had 90% sensibility and a cut-off of 0.70
had 88% specificity permitting to achieve useful predic-
tive values for steatosis grade 2–4, 93% negative predictive
value (NPV) and 63% positive predictive value (PPV) for
a steatosis prevalence of 30% (Table 4). The 90% specifi-
city was obtained for a 0.72 cut-off with a corresponding
63% PPV. The overall percentage of patients classified
with at least 90% sensitivity or 90% specificity was 59%
(363+156/884).
Among the 744 patients with biopsy, for the diagnosis of
steatosis 3–4, the ST AUROC was 0.79 (0.02), signifi-
cantly higher than GGT 0.74 (0.02) (P = 0.03), and ALT
was 0.71 (0.02) (P = 0.007). The 90% sensitivity was
obtained for a 0.32 cut-off; the 90% specificity was
obtained for a 0.81 cut-off.
Conversion between SteatoTest results and the
corresponding steatosis grade
ST is a continuous linear biochemical assessment of stea-
tosis grade. It provides a numerical quantitative estimate
of liver steatosis ranging from 0.00 to 1.00, corresponding
to a steatosis scoring system of grades S0 to S4. Among the
140 controls, the median ST value (± SE) was 0.08 ± 0.004
(95th percentile, 0.23). Among the 744 patients with liver
biopsy, the ST conversion was 0.000 – 0.3000 for S0;
0.3001 – 0.3800 for S0-S1; 0.3801 – 0.4800 for S1; 0.4801
– 0.5700 for S1-S2; 0.5701 – 0.6700 for S2; 0.6701 –
0.6900 for S2-S3S4; and 0.6901 – 1.000 for S3-S4.
Steatosis at Ultrasonography and SteatoTest
Ultrasonography has been preformed together with ST
and biopsy in 304 patients. Concordance between steato-
sis diagnosed, at ultrasonography and at biopsy, was
lower (kappa coefficient = 0.32 ± 0.05) than the concord-
ance with ST (at 0.50 cut-off, kappa = 0.44 ± 0.06; P =
0.02), as well as lower AUROC 0.65 ± 0.03 for ultrasonog-
raphy versus 0.78 ± 0.03 for ST (P = 0.001). The ST values
according to the presence of histological and radiological
steatosis are given in Table 5.
Sensitivity analyses
A total of 635 (85%) patients had a time lapse between
biopsy and serum smaller than one month. The AUROC
of ST was similar in those patients (0.77, 95% CI 0.73–
0.80) than in the 109 (15%) patients with greater lapse
(0.82, 95% CI 0.72–0.89; P = 0.36). A total of 670 (78%)
patients had a biopsy sample length smaller than 20 mm.
The AUROC of ST was slightly smaller in those patients
(0.76, 95% CI 0.71–0.79) than in the 161 (15%) patients
with greater sample (0.82, 95% CI 0.74–0.88; P = 0.10).
Discussion
Our results highlight the utility of a new panel of bio-
chemical markers (ST) for the prediction of steatosis of
different origins. A cut-off of 0.30 had 90% sensibility and
a cut-off of 0.72 had 90% specificity permitting to achieve
useful predictive value, 93% NPV and 63% PPV for a stea-
tosis prevalence of 30%. These predictive values are far
from perfection, particularly for PPV; however, already
predictive and significantly higher than those of previous
usual markers GGT, ALT and ultrasonography, as demon-
strated by the increase of AUROCs. This benefit was
observed for the most frequent chronic liver diseases:
chronic viral hepatitis, and alcoholic and non-alcoholic
fatty liver diseases.
We have not identified any reports of a single or a combi-
nation of biomarkers with accurate value for the diagnosis
of steatosis in different chronic liver diseases. Marceau et
al observed in 551 severely obese patients with liver
biopsy that steatosis was associated with male gender, age,
BMI, waist/hip ratio, diabetes, systolic blood pressure,
fasting blood sugar, triglycerides, and non-HDL choles-
terol, but no diagnostic algorithm was provided [29].
Papadia et al. [30] observed in 1000 obese patients an
association between steatosis and AST, ALT, AST/ALT
ratio, body weight, waist/hip ratio, serum glucose, serum
triglycerides, BMI, GGT, age, and unconjugated bilirubin
using regression analysis [30]. No panel was constructed
and they concluded that no reliable biochemical marker
could identify patients with severe steatosis with sufficient
sensitivity for avoiding liver biopsy. Loguercio et al. [31]
observed that in 305 patients with abnormal GGT or ALT,
age, ferritin and tissue 4-hydroxynonenal were associated
with steatosis. On multivariate analysis, no single factor
was found to be an independent predictor [31].
Table 5: SteatoTest value according to presence of liver steatosis greater than 5% at liver biopsy, and according to presence at
ultrasonography.
No steatosis at biopsy Steatosis at biopsy Significance
No steatosis at
ultrasonography
N = 143, ST = 0.37± 0.02 N = 74, ST = 0.55± 0.02 < 0.0001
Steatosis at ultrasonography N = 25, ST = 0.47± 0.04 N = 62, ST = 0.70± 0.03 < 0.0001
Significance 0.01 < 0.0001
Comparative Hepatology 2005, 4:10 />Page 10 of 14
(page number not for citation purposes)
In the present study, the predictive value of ST was related
to the discriminant values of its different components.
The most striking observation was that the combination
of 12 parameters allowed a very significant increase in the
diagnostic values of isolated GGT or ALT. The diagnostic
value of ALT was better than that of GGT, as assessed by
AUROCs in all the different groups. This is surprising as
an elevated GGT is generally thought to be a serum marker
of steatosis and elevated transaminases to be a marker of
NASH. A better association between ALT and steatosis ver-
sus GGT and steatosis has also been observed using proton
magnetic resonance imaging [32].
The diagnostic values of GGT, ALT, triglycerides, choles-
terol, glucose and BMI were expected, because they had
been previously associated with steatosis of different ori-
gins [3,29,31]. Those biomarkers are also associated with
insulin resistance and triglyceride deposition in the liver
[6]. ApoA1 is highly associated with HDL-cholesterol and
a negative association was also expected with steatosis
[29]. The advantage of combining biomarkers of steatosis
and those more specific for fibrosis such as A2M, hap-
toglobin and bilirubin is to adjust the predictive values
according to the associated stage of fibrosis. In the present
study we observed that the grade of steatosis in patients
with extensive fibrosis was significantly lower than in
patients without extensive fibrosis (data not shown).
Our study has several limitations that must be acknowl-
edged. Firstly, despite the use of prospective cohorts of
patients, our study was not a classical prospective study.
The validation groups consisted of previously studied
groups of patients: groups 1 and 2 were from a prospective
randomized trial with a previous publication on steatosis
[33], and group 3 was a prospective cohort of patients
with alcoholic liver disease from a study which had been
published for validation of fibrosis biomarkers [26].
There were three different pathologists but very skilled in
these scoring systems and expert in variability studies. The
analyses of histological specimens and biochemical mark-
ers were performed blindly, and the recommended pre-
analytical and analytical procedures were respected for
most of the components. The analytical variability of cho-
lesterol, triglycerides and glucose should be assessed.
A second limitation was the relatively small number of
patients with grade 3 and 4 steatosis. We observed a non-
significant difference between ST medians, 0.70 for grade
3 versus 0.75 for grade 4. Due to the small sample size of
patients with grade 3–4 steatosis in the validation groups,
further studies should be performed in order to determine
whether ST could discriminate between patients with
marked steatosis (between 30 and 66%) and those with
severe steatosis (over 66%). Grade 3 and 4 steatosis is
more frequent in patients with NAFLD and further studies
must be performed in these patients.
In patients with NAFLD, a liver biopsy is more usually
obtained for identifying additional features of steatohep-
atitis (hepatocellular ballooning, lobular inflammation,
Mallory's hyaline) which may be associated with and/or
predictive for the development of pericellular and/or per-
iportal fibrosis. FT has been already validated for the diag-
nosis of fibrosis in NAFLD [27] and ALD [26]. Studies on
biomarkers of steatohepatitis (NashTest, AshTest) are also
in progress (personal communication of Thierry Poy-
nard). Combination of those non-invasive markers
should help the physician in the management of NAFLD
and ALD.
A third limitation was not having compared prospectively
the serum biomarkers with imaging techniques such as
ultrasonography [28,32,34] and proton magnetic reso-
nance imaging [35]. In the retrospective analysis of the
training population, we observed that ST had a higher
diagnostic value than the routine ultrasonography with
higher AUROCs. It has been already observed that the sen-
sitivity of ultrasonography is low in obese patients [36] for
the diagnosis of steatosis. Proton magnetic resonance
imaging is expensive; nevertheless, a validation of ST ver-
sus proton magnetic resonance imaging would be quite
interesting.
In contrast with the above mentioned limitations, one
advantage of the present design was the inclusion of het-
erogeneous patients in the training group with different
causes of chronic liver disease as well as the validation of
the diagnostic values in more homogeneous groups. Vali-
dation groups 1 and 3 included very homogeneous
patients, with chronic hepatitis C and ALD, respectively.
The advantage of validation group 2 was the inclusion of
a group of patients clinically and biologically close to a
"normal" population, as these patients are sustained viro-
logic responders and had quasi-normal liver function
tests. This population offered the unique opportunity of
having liver biopsies in subjects with normal profiles –
not possible, for example, in blood donors. The intra and
inter-laboratory variability has been studied for the 6 FT
components and those studies should also be performed
for cholesterol, triglycerides and glucose. We did not find
any significant differences in ST AUROCs according to
ethnicity (data not showed) [37].
As discussed for liver fibrosis, it is also possible that the
limitations of liver biopsy (sampling error and patholo-
gist concordance) did not allow a perfect area under the
curve to be reached [38]. In hepatitis C the ideal gold
standard would be at least a 40 mm length biopsy sample.
Bedossa et al. [18] recommend, at least, 25 mm; but the
Comparative Hepatology 2005, 4:10 />Page 11 of 14
(page number not for citation purposes)
coefficient of variation decreases up to 40 mm. In chronic
hepatitis C, 18 % of discordance in fibrosis staging has
been attributed to liver biopsy failures (mainly due to
small sample size) and 2% to FT (due to hemolysis,
inflammation and Gilbert's syndrome) [38]. For liver stea-
tosis, there is also a sampling variability with discordance
in 22% of patients [19]. In the present study, we observed
discordance between steatosis assessed by ST and that
assessed by biopsy, in 10% to 21% according to patient's
group. Several discordant cases seem to be attributable to
biopsy (false negatives of biopsy) as the quality was poor
and, at least, one metabolic risk factor was present. Signif-
icant discordance was more often observed in patients
with extensive fibrosis. We previously suspected a risk of
greater variability in assessing fibrosis when steatosis was
present but the inverse could be also true: a greater varia-
bility in assessing steatosis in case of cirrhotic or pre-cir-
rhotic stages [38].
ST is not a perfect diagnostic tool, but has several advan-
tages over other proposed strategies for steatosis manage-
ment. The 12 components of ST are readily available.
FibroTest-ActiTest is now available in several different
countries, including the USA (FibroSure™), with a quality
charter for laboratories for reducing inter-laboratory vari-
ability [23,30,38,39]. As demonstrated in the present
study, ST allowed the assessment of steatosis in patients
with paired biopsy. This could be very useful for the fol-
low-up of patients. This has been validated in HCV
patients before and after treatment and should be vali-
dated in patients with ALD and NAFLD with paired biop-
sies.
There is no specific approved treatment for steatosis. Rec-
ommendations depend on the cause. There is wide agree-
ment for the cessation of alcohol consumption in heavy
drinkers, weight reduction in obese patients, and the treat-
ment of diabetes and hyperlipidemia [1-4]. In patients
with chronic hepatitis C and genotype 3, 50% of the
patients treated and who have a sustained virologic
response have a disappearance of liver steatosis at the sec-
ond biopsy [33]. Bellentani et al. [3] recommended that
subjects with elevated ALT or GGT should be screened for
steatosis using hepatic ultrasonography. They suggested
that the demonstration of hepatic steatosis should
prompt a reduction of caloric and alcohol intake and fol-
low-up with both ultrasonography and biochemical tests.
When clinically indicated, a liver biopsy for assessing the
degree of fibrosis and inflammation could be performed.
Conclusion
According to the low predictive values of ALT, GGT and
ultrasonography, as well as the risk and the variability of
liver biopsy, the previous strategy could be improved by
using better biomarkers of steatosis, such as ST, combined
with biomarkers of fibrosis, such as FibroTest-Fibrosure,
and with biomarkers of steatohepatitis. The cost will be
probably similar to the price of FibroTest-Fibrosure (cur-
rently around 100 €) and cheaper than biopsy or proton
magnetic resonance imaging. This new strategy will likely
reduce the indications of liver biopsy. Prospective studies
are needed to confirm those results and to support the
general use of this new biomarker.
Methods
Study population
Consecutive patients who were included were those with
an available serum sample, a liver biopsy, and a time
interval between serum sampling and biopsy of less than
three months (Figure 1).
Training group (mixed liver diseases)
These patients were retrospectively included for this spe-
cific analysis, but had been analyzed in previous prospec-
tive validation studies of FT between September 2000 and
August 2004 [23,24,27,38]. All were patients hospitalized
in the of Hepato-Gastroenterology department of Groupe
Hospitalier Pitié-Salpêtrière for NAFLD, hepatitis C and B,
and ALD.
Validation group one (hepatitis C)
These patients were retrospectively analyzed from a study
of steatosis in patients with chronic hepatitis C [33]. For
this purpose, previously non-treated patients of a prospec-
tive multicentre randomized trial of pegylated-Interferon
and ribavirin were included. The biomarkers and the
biopsy results at baseline were used.
Validation group two (former hepatitis C, with
undetectable HCV)
These patients were those from the patients of the same
randomized trial [33] who had been "cured" – they had a
sustained virologic response, with undetectable HCV
RNA, at the end of treatment and 24 weeks after the end
of treatment. The biomarkers and the biopsy results per-
formed 24 weeks after the end of treatment were used.
This group can be considered to be a validation group of
non-viral steatosis because possible viral steatosis had
been cured by the treatment [33].
Validation group three (ALD)
These patients were retrospectively included for this spe-
cific analysis but had been prospectively included
between 1998 and 2000 in a cohort of alcoholic patients
for which one primary endpoint was the identification of
biochemical markers. The details of this cohort have been
recently published in a validation study of FT [26]. All
were patients hospitalized in the Hepato-Gastroenterol-
ogy Department of Hôpital Antoine Béclère, for complica-
tions of alcoholic liver disease.
Comparative Hepatology 2005, 4:10 />Page 12 of 14
(page number not for citation purposes)
Common criteria of non-inclusion
Non-inclusion criteria included non-available serum,
non-available biopsies and biopsy and serum samples
which had been collected more than 3 months apart (Fig-
ure 1). Patient characteristics are given in Table 1.
Control groups
This included a group of, apparently, healthy volunteers
who had been previously included in a validation study of
FT, in fasting and non-fasting conditions [39]. A group of
non-fasting blood donors were also prospectively
included.
Histologic analysis
Common rules were applied to the different groups. Liver
biopsy specimens were processed using standard tech-
niques. Patients with viral hepatitis were evaluated for
fibrosis and grade of activity according to the METAVIR
scoring system, for which reproducibility had previously
been established [40]. Patients with ALD and NAFLD were
evaluated with modified staging and grading scores [41-
44]. Fibrosis was staged on a scale of 0 to 4: F0 – no fibro-
sis; F1 – portal fibrosis or perivenular fibrosis without
septa; F2 – few septa; F3 – numerous septa without cirrho-
sis; and F4 – cirrhosis. Activity (the intensity of necroin-
flammatory activity mostly based on necrosis) was scored
as follows: A0 – no histologic activity; A1 – mild activity;
A2 – moderate activity; and A3 – severe activity. Steatosis
was scored from 0 to 4 with a four grades scoring system
from S0 to S4: S0 – no steatosis; S1 – mild 1 to 5% (% of
hepatocytes containing visible macrovesicular steatosis);
S2 – moderate 6 to 32%; S3 – marked 33 to 66%; and S4
– severe 67 to 100% [33]. The main histological criterion
was the presence of steatosis grade 2–4 (between 6 to
100%). A single pathologist per group, unaware of patient
characteristics, analyzed the histological features (Frederic
Charlotte for the training group, Zack Goodman for vali-
dation groups 1 and 2, and Dominique Capron for valida-
tion group 3).
Serum biochemical markers – New biomarker of steatosis
A new panel (ST, Biopredictive, Paris, France, patent pend-
ing) was constructed in the training group combining the
6 components of the FibroTest-ActiTest (patented artifi-
cial intelligence algorithm USPTO 6,631,330) adjusted
for age, gender and BMI, plus serum glucose, triglycerides
and cholesterol. ST scores of range from zero to 1.00, with
higher scores indicating a greater probability of significant
lesions. FT and AT (Biopredictive, Paris, France; Fibro-
SURE LabCorp, Burlington, NC, USA) were determined as
has been previously published [23,38,39]. The published
recommended pre-analytical and analytical procedures
were used [23,38,39,45,46]. In the training and control
groups, GGT, ALT, serum glucose, triglycerides, choles-
terol, and total bilirubin were measured by Hitachi 917
analyzer or Modular DP analyzers (both Roche Diagnos-
tics Mannheim, Germany) using the manufacturer's rea-
gents. A2M, ApoA1, and haptoglobin were measured
using an automatic nephelemeter BNII (Dade Behring;
Marburg, Germany). In validation groups 1 and 2, GGT,
ALT, serum glucose, triglycerides, cholesterol, and total
bilirubin were measured using Hitachi 747 or 911 (Roche
Diagnostics, Indianapolis, IN, USA) with the manufac-
turer's reagents. ApoA1, A2M and haptoglobin were deter-
mined in serum samples using an automatic
nephelometer BNII (Dade Behring, Marburg, Germany).
In validation group 3, ALT, GGT, serum glucose, triglycer-
ides, cholesterol, total bilirubin and haptoglobin were
measured by autoanalyzer (Olympus AU 640 Automate)
using manufacturer's reagents (Olympus, Rungis, France);
A2M and ApoA1 were measured using an automatic neph-
elometer (BNII, Dade Behring, Marburg, Germany). All
coefficients of variation assays were lower than 10%.
Imaging
Ultrasonography reports have been retrospectively ana-
lyzed for the presence or absence of radiological steatosis
in the validation group, blindly to histological and bio-
chemical data.
Statistical analyses
The primary outcome was grade 2, 3 or 4 of steatosis
(S2S3S4). The cause of discordance between the presence
of S2S3S4 steatosis, as predicted by biochemical markers
and biopsy was attributed according to respective risk fac-
tors of failure, as previously detailed [38]. Significant dis-
cordance was defined as discordance in predicting grades
S2S3S4 and a 30% or greater difference in steatosis per-
centage, as predicted by ST or as observed in the biopsy
sample. Risk factors of ST failure were hemolysis, Gilbert's
disease, acute inflammation and extra-hepatic cholestasis.
Risk factors of biopsy failure were biopsy size (less than 25
mm) and fragmentation (more than one fragment). Fail-
ure attributable to biopsy (false negative) was suspected
when the biopsy length was less than 15 mm and frag-
mented with the additional presence of, at least, one met-
abolic risk factor.
Statistical analysis used Fisher's exact test, the chi-square
test, Student's t-test and the Mann-Whitney test; variance
analysis used the Bonferroni all-pair wise and the Tukey-
Kramer multiple-comparison tests to take into account
the multiple comparisons, and multiple logistic regres-
sion the for multivariate analysis [47]. The diagnostic val-
ues of the markers were assessed using sensitivities,
specificities, PPVs and NPVs and AUROCs [47]. Corre-
sponding steatosis grades were calculated from median ST
scores and 95% confidence intervals observed in 744
patients and 140 controls. AUROCs were calculated using
the empirical non-parametric method according to
Comparative Hepatology 2005, 4:10 />Page 13 of 14
(page number not for citation purposes)
Delong et al. [48] and compared using the method of
Zhou et al. [49]. The binomial approach was used only
when the sample size population was less than 30 [50].
For all analyses, two-sided statistical tests were used; a P-
value of 0.05 or less was considered significant. Number
Cruncher Statistical Systems 2003 software (NCSS, Kay-
sville, Utah, USA) was used for all analyses [47].
A sensitivity analysis was also performed for determining
the accuracy of the markers for the primary outcomes
according to biopsy sample size (less than 20 mm or
more) and to time lapse between serum and biopsy (less
than 4 weeks or more).
Competing interests
Thierry is the inventor of both the FT and the ST, is a con-
sultant and has a capital interest in Biopredictive, the
company marketing FibroTest-SteatoTest. Mona Munte-
anu is employee of Biopredictive, the company marketing
FibroTest-SteatoTest.
Authors' contributions
TP conceived and wrote the manuscript. TP, VR, SN, DT,
JM, MM, MM and JA were responsible for the patient
drafting, and participated in the coordination of the
study. FIB, AA and DM carried out biochemical analysis
and drafted the paper. FC and DC were responsible of his-
tological analysis. TP performed the statistical analysis. All
authors read and approved the final manuscript.
Acknowledgements
Thierry Poynard has grants from the Association pour la Recherche sur le
Cancer (ARECA) and from the Association de Recherche sur les Maladies
Virales Hépatiques.
References
1. McCullough AJ: The clinical features, diagnosis and natural his-
tory of nonalcoholic fatty liver disease. Clin Liver Dis 2004,
8:521-33.
2. Clark JM, Brancati FL, Diehl AM: The prevalence and etiology of
elevated aminotransferase levels in the United States. Am J
Gastroenterol 2003, 98:960-967.
3. Bellentani S, Saccoccio G, Masutti F, Croce LS, Brandi G, Sasso F,
Cristanini G, Tiribelli C: Prevalence of and risk factors for
hepatic steatosis in Northern Italy. Ann Intern Med 2000,
132:112-7.
4. Levitsky J, Mailliard ME: Diagnosis and therapy of alcoholic liver
disease. Semin Liver Dis 2004, 24:233-47.
5. Day CP: Pathogenesis of steatohepatitis. Best Pract Res Clin Gas-
troenterol 2002, 16:663-678.
6. Browning JD, Horton JD: Molecular mediators of hepatic stea-
tosis and liver injury. J Clin Invest 2004, 114:147-152.
7. Wanless IR, Shiota K: The pathogenesis of nonalcoholic steato-
hepatitis and other fatty liver diseases: a four-step model
including the role of lipid release and hepatic venular
obstruction in the progression to cirrhosis. Semin Liver Dis
2004, 24:99-106.
8. El-Serag HB, Tran T, Everhart JE: Diabetes increases the risk of
chronic liver disease and hepatocellular carcinoma. Gastroen-
terology 2004, 126:460-468.
9. Dam-Larsen S, Franzmann M, Andersen IB, Christoffersen P, Jensen
LB, Sorensen TI, Becker U, Bendtsen F: Long term prognosis of
fatty liver: risk of chronic liver disease and death. Gut 2004,
53:750-755.
10. Sorensen TI, Orholm M, Bentsen KD, Hoybye G, Eghoje K, Christof-
fersen P: Prospective evaluation of alcohol abuse and alco-
holic liver injury in men as predictors of development of
cirrhosis. Lancet 1984, 2:241-244.
11. Teli MR, Day CP, Burt AD, Bennett MK, James OF: Determinants
of progression to cirrhosis or fibrosis in pure alcoholic fatty
liver. Lancet 1995, 346:987-990.
12. Fabris P, Floreani A, Carlotto A, Giordani MT, Baldo V, Stecca C, Mar-
chioro L, Tramarin A, Bertin T, Negro F, de Lalla F: Alcohol is an
important co-factor for both steatosis and fibrosis in North-
ern Italian patients with chronic hepatitis C. J Hepatol 2004,
41:644-651.
13. Phillips MJ, Cameron R, Flowers MA, Blendis LM, Greig PD, Wanless
I, Sherman M, Superina R, Langer B, Levy GA: Post-transplant
recurrent hepatitis B viral liver disease. Viral-burden, steato-
viral, and fibroviral hepatitis B. Am J Pathol 1992, 140:1295-308.
14. Bravo AA, Sheth SG, Chopra S: Liver biopsy. N Engl J Med 2001,
344:495-500.
15. Labayle D, Chaput JC, Albuisson F, Buffet C, Martin E, Etienne JP:
Comparison of the histological lesions in tissue specimens
taken from the right and left lobe of the liver in alcoholic
liver disease. Gastroenterol Clin Biol 1979, 3:235-240.
16. Maharaj B, Maharaj RJ, Leary WP, Cooppan RM, Naran AD, Pirie D,
Pudifin DJ: Sampling variability and its influence on the diag-
nostic yield of percutaneous needle biopsy of the liver. Lancet
1986, 1:523-525.
17. Regev A, Berho M, Jeffers LJ, Milikowski C, Molina EG, Pyrsopoulos
NT, Feng ZZ, Reddy KR, Schiff ER: Sampling error and intraob-
server variation in liver biopsy in patients with chronic HCV
infection. Am J Gastroenterol 2002, 97:2614-2618.
18. Bedossa P, Dargère D, Paradis V: Sampling variability of liver
fibrosis in chronic hepatitis C. Hepatology 2003, 38:1449-57.
19. Ratziu V, Charlotte F, Heurtier A, Gombert S, Giral P, Bruckert E,
Grimaldi A, Poynard T, for the LIDO Study Group: Sampling vari-
ability of liver biopsy in nonalcoholic fatty liver disease. Gas-
troenterology 2005, 128:1898-1906.
20. Poynard T, Ratziu V, Bedossa P: Appropriateness of liver biopsy.
Can J Gastroenterol 2000, 14:543-548.
21. Cadranel JF, Rufat P, Degos F: Practices of liver biopsy in France:
Results of a prospective nationwide survey. For the Group of
Epidemiology of the French Association for the Study of the
Liver (AFEF). Hepatology 2000, 32:477-481.
22. Afdhal NH: Biopsy or biomarkers: is there a gold standard for
diagnosis of liver fibrosis? Clin Chem 2004, 50:1299-1300.
23. Poynard T, Imbert-Bismut F, Munteanu M, Messous D, Myers RP,
Thabut D, Ratziu V, Mercadier A, Benhamou Y, Hainque B: Over-
view of the diagnostic value of biochemical markers of liver
fibrosis (FibroTest, HCV FibroSure) and necrosis (ActiTest)
in patients with chronic hepatitis C. Comp Hepatol 2004, 3:8.
24. Myers RP, Tainturier MH, Ratziu V, Piton A, Thibault V, Imbert-Bis-
mut F, Messous D, Charlotte F, Di Martino V, Benhamou Y, Poynard
T: Prediction of liver histological lesions with biochemical
markers in patients with chronic hepatitis B. J Hepatol 2003,
39:222-230.
25. Callewaert N, Van Vlierberghe H, Van Hecke A, Laroy W, Delanghe
J, Contreras R: Noninvasive diagnosis of liver cirrhosis using
DNA sequencer-based total serum protein glycomics. Nature
Med 2004, 10:1-6.
26. Naveau S, Raynard B, Ratziu V, Abella A, Françoise Imbert-Bismut F,
Messous D, Beuzen F, Capron F, Thabut D, Munteanu M, Chaput JC,
Poynard T: The diagnostic value of biomarkers for the predic-
tion of liver fibrosis in patients with chronic alcoholic liver
disease. Clin Gastroenterol Hepatol 2005, 3:167-174.
27. Ratziu V, Le Calvez S, Imbert-Bismut F, Messous D, Charlotte F,
Bonyhay L, Munteanu M, Poynard T: Diagnostic value of biochem-
ical markers (Fibrotest) for the prediction of liver fibrosis in
patients with non-alcoholic fatty liver disease. Hepatology
2003, 38:510A.
28. Yao W, Zhao B, Zhao Y, Wang W, Qian G: Ultrasonographic tex-
ture analysis of parenchymatous organs by the four-neigh-
borhood-pixels algorithm: clinical experiment. J Ultrasound
Med 2001, 20:465-471.
Publish with BioMed Central and every
scientist can read your work free of charge
"BioMed Central will be the most significant development for
disseminating the results of biomedical research in our lifetime."
Sir Paul Nurse, Cancer Research UK
Your research papers will be:
available free of charge to the entire biomedical community
peer reviewed and published immediately upon acceptance
cited in PubMed and archived on PubMed Central
yours — you keep the copyright
Submit your manuscript here:
/>BioMedcentral
Comparative Hepatology 2005, 4:10 />Page 14 of 14
(page number not for citation purposes)
29. Marceau P, Biron S, Hould FS, Marceau S, Simard S, Thung SN, Kral
JG: Liver pathology and the metabolic syndrome X in severe
obesity. J Clin Endocrinol Metab 1999, 84:1513-1517.
30. Papadia FS, Marinari GM, Camerini G, Murelli F, Carlini F, Stabilini C,
Scopinaro N: Liver damage in severely obese patients: a clini-
cal-biochemical-morphologic study on 1,000 liver biopsies.
Obes Surg 2004, 14:952-958.
31. Loguercio C, De Simone T, D'Auria MV, de Sio I, Federico A, Tuccillo
C, Abbatecola AM, Del Vecchio Blanco C: Italian AISF Clinical
Group. Non-alcoholic fatty liver disease: a multicentre clini-
cal study by the Italian Association for the Study of the Liver.
Dig Liver Dis 2004, 36:398-405.
32. Mathiesen UL, Franzen LE, Aselius H, Resjo M, Jacobsson L, Foberg U,
Fryden A, Bodemar G: Increased liver echogenicity at ultra-
sound examination reflects degree of steatosis but not of
fibrosis in asymptomatic patients with mild / moderate
abnormalities of liver transaminases. Dig Liver Dis 2002,
34:516-22.
33. Poynard T, Ratziu V, McHutchison J, Manns M, Goodman Z, Zeuzem
S, Younossi Z, Albrecht J: Effect of treatment with peginter-
feron or interferon alfa-2b and ribavirin on steatosis in
patients infected with hepatitis C. Hepatology 2003, 38:75-85.
34. Mottin CC, Moretto M, Padoin AV, Swarowsky AM, Toneto MG,
Glock L, Repetto G: The role of ultrasound in the diagnosis of
hepatic steatosis in morbidly obese patients. Obes Surg 2004,
14:635-7.
35. Thomas EL, Hamilton G, Patel N, O'dwyer R, Dore CJ, Goldin RD,
Bell JD, Taylor-Robinson SD: Hepatic triglyceride content and
its relation to body adiposity: a magnetic resonance imaging
and proton magnetic resonance spectroscopy study. Gut
2005, 54:122-7.
36. Shalhub S, Parsee A, Gallagher SF, Haines KL, Willkomm C, Brantley
SG, Pinkas H, Saff-Koche L, Murr MM: The importance of routine
liver biopsy in diagnosing nonalcoholic steatohepatitis in bar-
iatric patients. Obes Surg 2004, 14:54-59.
37. Browning JD, Szczepaniak LS, Dobbins R, Nuremberg P, Horton JD,
Cohen JC, Grundy SM, Hobbs HH: Prevalence of hepatic steato-
sis in an urban population in the United States: impact of
ethnicity. Hepatology 2004, 40:1387-1395.
38. Poynard T, Munteanu M, Imbert-Bismut F, Charlotte F, Messous D,
Dominique Thabut D, Thibaut V, Benhamou Y, Ratziu V: Prospec-
tive analysis of discordant results between biochemical
markers and biopsy in patients with chronic hepatitis C. Clin
Chem 2004, 50:1344-1355.
39. Munteanu M, Messous D, Thabut D, Imbert-Bismut F, Jouys M, Mas-
sard J, Piton A, Bonyhay L, Ratziu V, Hainque B, Poynard T: Intra-
individual fasting versus postprandial variation of biochemi-
cal markers of liver fibrosis (FibroTest) and activity (ActiT-
est). Comp Hepatol 2004, 3:3.
40. Intraobserver and interobserver variations in liver biopsy
interpretation in patients with chronic hepatitis C. The
French METAVIR Cooperative Study Group. Hepatology 1994,
20:15-20.
41. Bedossa P, Poynard T, Naveau S, Martin ED, Agostini H, Chaput JC:
Observer variation in assessment of liver biopsies of alco-
holic patients. Alcohol Clin Exp Res 1988, 12:173-178.
42. Poynard T, Mathurin P, Lai CL, Guyader D, Poupon R, Tainturier MH,
Myers RP, Muntenau M, Ratziu V, Manns M, Vogel A, Capron F,
Chedid A, Bedossa P: A comparison of fibrosis progression in
chronic liver diseases. J Hepatol 2003, 38:257-265.
43. Brunt EM, Janney CG, Di Bisceglie AM, Neuschwander-Tetri BA,
Bacon BR: Nonalcoholic steatohepatitis: a proposal for grad-
ing and staging the histological lesions. Am J Gastroenterol 1999,
94:2467-2474.
44. Kleiner DE, Brunt EM, Van Natta M, Behling C, Contos MJ, Cummings
OW, Ferrell LD, Liu YC, Torbenson MS, Unalp-Arida A, Yeh M,
McCullough AJ, Sanyal AJ: Nonalcoholic Steatohepatitis Clinical
Research Network. Design and validation of a histological
scoring system for nonalcoholic fatty liver disease. Hepatology
2005, 41:1313-1321.
45. Halfon P, Imbert-Bismut F, Messous D, Antoniotti G, Benchetrit D,
Cart-Lamy P, Delaporte G, Doutheau D, Klump T, Sala M, Thibaud D,
Trepo E, Thabut D, Myers RP, Poynard T: A prospective assess-
ment of the inter-laboratory variability of biochemical mark-
ers of fibrosis (FibroTest) and activity (ActiTest) in patients
with chronic liver disease. Comp Hepatol 2002, 1:3-7.
46. Imbert-Bismut F, Messous D, Thibaut V, Myers RB, Piton A, Thabut
D, Devers L, Hainque B, Mercadier A, Poynard T: Intralaboratory
analytical variability of biochemical markers of fibrosis
(Fibrotest) and activity (Actitest) and reference ranges in
healthy blood donors. Clin Chem Lab Med 2004, 42:323-333.
47. Hintze JL: NCSS 2003 User Guide. Number Cruncher Statistical Systems
2003 Software NCSS Kaysville, Utah: NCSS; 2003.
48. DeLong ER, DeLong DM, Clarke-Pearson DL: Comparing the
areas under two or more correlated receiver operating
characteristic curves: A nonparametric approach. Biometrics
1988, 44:837-845.
49. Zhou X-H, McClish DK, Obuchowski NA: Statistical Methods in
Diagnostic Medicine. New York: John Wiley & Sons; 2002.
50. McClish DK: Analyzing a Portion of the ROC Curve. Med Decis
Making 1989, 9:190-195.