Báo cáo y học: "Over-expression of glutamine synthase in focal nodular hyperplasia (part 1): Early stages in the formation support the hypothesis of a focal hyper-arterialisation with venous (portal and hepatic) and biliary damage" pps
Bạn đang xem bản rút gọn của tài liệu. Xem và tải ngay bản đầy đủ của tài liệu tại đây (13.23 MB, 28 trang )
BioMed Central
Page 1 of 28
(page number not for citation purposes)
Comparative Hepatology
Open Access
Case Report
Over-expression of glutamine synthase in focal nodular hyperplasia
(part 1): Early stages in the formation support the hypothesis of a
focal hyper-arterialisation with venous (portal and hepatic) and
biliary damage
Paulette Bioulac-Sage
1,2
, Hervé Laumonier
3
, Gaëlle Cubel
2
, Jean Saric
4
and
Charles Balabaud*
2,4
Address:
1
Service d'Anatomie Pathologique Hôpital Pellegrin, CHU Bordeaux, France,
2
GREF Inserm U889, Université Bordeaux 2, France,
3
Service
de Radiologie, Hôpital Saint André, CHU Bordeaux, France and
4
Pôle HGE, Hôpital Saint André, CHU Bordeaux, France
Email: Paulette Bioulac-Sage - ; Hervé Laumonier - ;
Gaëlle Cubel - ; Jean Saric - ; Charles Balabaud* -
* Corresponding author
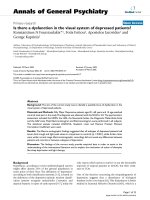
Abstract
Background: Most focal nodular hyperplasia (FNH) cases are diagnosed by chance. We studied a
case of pre-FNH. We used glutamine synthase as an immunohistochemical marker for perivenous
zones.
Results: Neither fibrotic scars nor hepatocytic nodules surrounded by fibrosis with a ductular
reaction were observed in the sections studied. Most sections generally displayed preserved
architecture. The glutamine synthase-positive hepatocyte areas were wider than those observed in
non-tumoural surrounding liver, and they tended to extend outwards. Portal tracts bordering the
nodule were more fibrotic, with an absence of portal veins and ducts and with arterial proliferation
often in proximity with large draining veins; isolated arteries were present and hepatic veins were
rare in the nodule. These features appeared prior to the identification of other major criteria
characteristics of FNH, thus supporting the "hypothesis of Wanless".
Conclusion: The findings confirm that in FNH there is a portal tract injury leading to local portal
vein injury. This leads to a cascade of events, including arterial venous shunts, ductular reaction,
and scar formation.
Background
The estimated prevalence of focal nodular hyperpla-
sia(FNH) is 0.4 to 3% in a non-selected autopsy series and
0.3% in a clinical series. Most FNH cases are diagnosed by
chance, but some are symptomatic. In contrast to hepato-
cellular adenomas, imaging techniques are sufficient for
diagnosis in 70% of FNH cases. Histopathological exami-
nation is required for diagnosis in the few cases that have
non-diagnostic imaging features [1,2]. In about two-
thirds of cases, the FNH lesion is solitary. The typical his-
topathological features of classic FNH include a firm,
well-delimited but not encapsulated lesion composed of
hepatocellular nodules, a central scar, and radiating
fibrous cords. The fibrous regions typically contain large
Published: 29 February 2008
Comparative Hepatology 2008, 7:2 doi:10.1186/1476-5926-7-2
Received: 19 October 2007
Accepted: 29 February 2008
This article is available from: />© 2008 Bioulac-Sage et al; licensee BioMed Central Ltd.
This is an Open Access article distributed under the terms of the Creative Commons Attribution License ( />),
which permits unrestricted use, distribution, and reproduction in any medium, provided the original work is properly cited.
Comparative Hepatology 2008, 7:2 />Page 2 of 28
(page number not for citation purposes)
dystrophic arteries and ductular reaction, usually associ-
ated with a lymphocytic infiltrate. FNH can be diagnosed
from a liver biopsy. However, in some cases of FNH, the
histopathological diagnosis may still be difficult, even in
a resected specimen; this is because the definitive his-
topathological features may be absent, inconspicuous, or
atypical. FNH can be associated with vascular abnormali-
ties, including hepatic hemangiomas, which support vas-
cular involvement in the pathogenesis of this lesion [3,4].
FNH has also been reported in patients with a variety of
non-hepatic tumours and tumour-like conditions [4].
Recently, Wanless et al. hypothesized that the primary
lesion of FNH is the result of a portal tract injury leading
to injury of the local portal vein (PV) with secondary large
arterial-PV shunts [5]. We studied the early stages of FNH
formation to help validate this hypothesis. Thus, we
reviewed a pre-FNH case previously published [6], taking
advantage of glutamine synthase (GS) staining; this stain-
ing technique recognises hepatic veins surrounded by GS-
positive hepatocytes or the distal part of zone 3 if the cen-
tral vein is not visible [7].
Case presentation
A white female patient born in 1950 was reported to have
vesicular polyps for several years. In 2000, she presented
with biliary colic, and a stone was detected in her gallblad-
der. A hypoechoic nodule was also identified in the left
lobe (Fig. 1). Isointense patterns relative to liver paren-
chyma on T1-weighted and T2-weighted images with
strong enhancement at arterial phase, and no wash-out at
portal venous phase favoured a benign liver nodule. How-
ever, the diagnosis of FNH could not be achieved with cer-
tainty, due to the absence of all the imaging criteria and,
above all, the absence of a central scar. The diagnosis of
adenoma could not be excluded even if homogeneous
and isointense patterns on both T1 and T2 weighted
images are considered rare for this kind of lesion. Further-
more, there was no evidence of fat deposits within this
lesion (Fig. 1). The patient had been taking oral contra-
ceptives for 10 years. Liver function tests for the patient
were normal. A left hepatectomy and a cholecystectomy
were performed at the same time. The resected nodule was
barely visible on an examination of gross anatomy, and
was slightly clearer than the surrounding liver paren-
chyma (Fig. 2). This nodule was the base of this study.
We sampled three representative sections of the nodule
whole surface and non-tumoural surrounding tissue. The
following stains and immunostains were performed on
serial sections from 2 blocks: H&E, Masson's trichrome,
cytokeratines (CK) 7 and 19, α-smooth muscle actin
(SMA), and GS. Additional immunostaining included
CD34 for characterising capillarised sinusoids, CRBP1
(cellular retinol binding protein-1) for hepatic stellate
cells, CD3 and CD20 for T- and B-lymphocytes, respec-
tively, and CD68 for histiocytes.
The non-tumoural liver was steatotic (30%), and the nod-
ule was less steatotic in comparison. Early stage FNH for-
mation was diagnosed due to frank ductular reaction,
observed around the arteries in two small areas (see Fig. 3,
[6]). We observed no fibrotic scars, or hepatocytic nodules
surrounded by fibrosis with ductular reaction in the sec-
tions studied.
Most sections generally displayed preserved architecture
(Fig. 3, 4, 5, 6, 7 and 8). Distinctions between nodular and
non-nodular tissues were made using GS immunostain-
ing (Fig. 3, 4). Inside the nodule, GS-positive hepatocyte
areas were wider around central veins if visible (Fig. 9),
and tended to extend outwards (Fig. 3, 4, 7, 10). Surpris-
ingly, hepatic veins (HV) in some GS-positive areas were
missing or had undergone fibrosis (Fig. 10, 11). GS stain-
ing was sometimes also present around thin vessels,
resembling dilated sinusoids (Fig. 12). Also in some GS-
positive areas, only arteries were visible (Fig. 13, 14). GS
staining was sometimes also present around thin vessels,
resembling dilated sinusoids (Fig. 12). However, isolated
arteries either along septa or in the parenchyma, often in
close proximity (Fig. 15, 16) or in contact with large drain-
ing vessels, were visible (Fig. 17). At the nodule periphery,
portal tracts were slightly fibrous, containing thicker arter-
ies and remnants of PV, and fewer ducts and ductules (Fig.
18, 19). No true portal tracts, and no bile ducts or ductules
were observed in the nodule (Fig. 20).
The nodule had fewer hepatic stellate cells than those
observed in non-tumour parenchyma, (Fig. 21); these
stellate cells were not activated (Fig. 15, 16, 17 and 18),
i.e., they were α-SMA negative. There was no major differ-
ence regarding capillarisation of sinusoids in periportal
and septal areas, between the tumoral liver and the non-
tumoral (Fig. 22). Portal tracts of the nodule also had
fewer macrophages (Fig. 23) and more B and T lym-
phocytes (Fig. 24, 25) than those of non-tumour paren-
chyma.
Discussion
FNH is frequently observed in tertiary referral centres. The
diagnosis is usually easy using imaging techniques, such
as ultrasound contrast agents, or MRI. If imaging tech-
niques or biopsies cannot exclude adenoma [1], a diagno-
sis can also be made using the resected specimen. We
found the use of various immunohistochemical methods,
including LFABP (cellular retinol binding protein), β-cat-
enin, SAA (serum amyloid A) and GS [8], very useful for
differentiating between FHN and adenoma in difficult
cases.
Comparative Hepatology 2008, 7:2 />Page 3 of 28
(page number not for citation purposes)
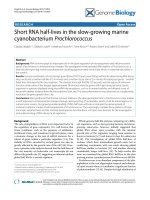
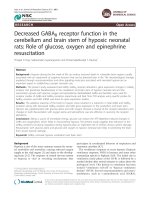
Contrast-enhanced T1-weighted imagesFigure 1
Contrast-enhanced T1-weighted images. They show strong enhancement of the lesion (white arrow) at arterial phase
(A) and isointense signals relative to liver parenchyma at portal venous phase (B).
A
B
Comparative Hepatology 2008, 7:2 />Page 4 of 28
(page number not for citation purposes)
Glutamine synthase, physiologically expressed in one or
two hepatocyte plates located immediately beside the cen-
tral veins in normal liver, is over-expressed in FNH with
over-stained hepatocytes generally forming large areas;
often anastomosed in a "map-like" pattern occasionally
centred by central veins, whereas GS positive areas remain
distant from fibrous bands. This zonal pattern of GS
expression in FNH strongly differs from the homogeneous
staining usually observed in adenomas and adenomas in
which β-catenin is mutated [8].
Surprisingly, there is not much data in relation to FNH
formation [6]. In this case, the lobular structure was gen-
erally preserved in each of the sections studied, and we
observed no ductular reaction and no fibrosis. Hepatic
veins were identified from portal tracts with certainty, as a
result of GS localization, and isolated arteries were visu-
ally detected well with α-SMA, thus providing a better
understanding of FNH.
From this study, it is clear that in early stages of FNH for-
mation there are various features: a) at the border, there
were abnormal portal tracts, which were more fibrotic,
and there was also an absence of portal veins and ducts
and arterial proliferation, often in proximity with large
draining veins; b) isolated arteries in the lesion; c) an
absence or rarefaction of hepatic veins. All these features
appeared prior the identification of other major character-
istics of FNH, i.e., nodules circled by fibrous bands, duc-
tular reaction, abnormal vessels and several arteries in
fibrotic bands.
These observations support suggestions by Wanless et al.
[5] and confirm that in FNH there is a portal tract injury
leading to local PV injury. Wanless' group has suggested
that the PV injury (from thrombosis or phlebitis) leads to
a cascade of events, such as secondary large arterio-PV
shunts. Arterio-PV shunts lead to the arterialisation of PV
with irregular intimal thickening resembling a dystrophic
Macroscopic view (A, B) of the nodule (formalin fixed tissue)Figure 2
Macroscopic view (A, B) of the nodule (formalin fixed tissue). Then nodule appears slightly clearer than the surround-
ing liver parenchyma (dotted line).
Comparative Hepatology 2008, 7:2 />Page 5 of 28
(page number not for citation purposes)
Two sections (A, B) of the noduleFigure 3
Two sections (A, B) of the nodule. The GS staining allows the distinction between non-nodular tissue and the nodule. The
broken line delineates the frontier. Figures 9, 20–25 are from section A. The upper figure is from non-nodular tissue and the
lower figure is from the nodular area. Figures 4-6 are from section B (blue rectangle). Figures 7, 8, 10-19 are from the same
section (yellow rectangle). The upper and lower microphotographs illustrate the same area (serial sections).
GS
A
B
Liver capsule
2000 μ
μμ
μm
GS
2000 μ
μμ
μm
Comparative Hepatology 2008, 7:2 />Page 6 of 28
(page number not for citation purposes)
Junction between non-nodular tissue (lower part) and nodule (upper part)Figure 4
Junction between non-nodular tissue (lower part) and nodule (upper part). The upper micrograph (A) displays GS
staining, and the lower micrograph (B) shows H&E staining. The GS stained area is wider in the nodular part than in the non-
nodular part. The lobular structure of the liver is not easily visible in the nodular part.
GS
H&E
50 μ
μμ
μm
50 μ
μμ
μm
A
B
Comparative Hepatology 2008, 7:2 />Page 7 of 28
(page number not for citation purposes)
Junction between non-nodular tissue (lower part) and nodule (upper part)Figure 5
Junction between non-nodular tissue (lower part) and nodule (upper part). The upper micrograph (A) shows α-SMA
staining, and the lower micrograph (B) exhibits trichrome staining. At the junction between the nodular and non-nodular part,
portal tracts are more fibrotic (trichrome). The nodular parts contain many isolated arteries.
α
αα
α-SMA
Trichrome
50 μ
μμ
μm
50 μ
μμ
μm
A
B
Comparative Hepatology 2008, 7:2 />Page 8 of 28
(page number not for citation purposes)
Junction between non-nodular tissue (lower part) and nodule (upper part)Figure 6
Junction between non-nodular tissue (lower part) and nodule (upper part). The upper micrograph (A) shows CK7
staining, and the lower micrograph (B) displays CK19 staining. There is no (CK19) or less (CK7) biliary cells in the nodular part
compared to the non-nodular part.
CK7
CK19
50 μ
μμ
μm
50 μ
μμ
μm
A
B
Comparative Hepatology 2008, 7:2 />Page 9 of 28
(page number not for citation purposes)
Another area of the previously described upper sectionFigure 7
Another area of the previously described upper section. The figure shows the upper section as previously described
(Fig. 4-5), but in another area. The upper micrograph (A) shows GS staining, and the lower micrograph (B) has CK7 staining. It
confirms the extension of GS staining and the decrease number of biliary cells in the nodule.
GS
CK7
100 μ
μμ
μm
100 μ
μμ
μm
A
B
Comparative Hepatology 2008, 7:2 />Page 10 of 28
(page number not for citation purposes)
Another area of the previously described upper sectionFigure 8
Another area of the previously described upper section. The figure shows the upper section as previously described
(Fig. 4-5), but in another area. The upper micrograph (A) was trichrome stained, and the lower micrograph (B) was α-SMA
stained. It confirms the proliferation of arteries in the nodules and the presence of fibrotic portal tracts at the periphery of the
nodule.
α
αα
α−SMA
100 μ
μμ
μm
100 μ
μμ
μm
Trichrome
A
B
Comparative Hepatology 2008, 7:2 />Page 11 of 28
(page number not for citation purposes)
Glutamine synthase immunostainingFigure 9
Glutamine synthase immunostaining. A: Normal expression of GS around the central vein (non-nodular tissue). B:
Extended staining around hepatic veins in the nodule.
GS
GS
B
A
25 μ
μμ
μm
5 μ
μμ
μm
Comparative Hepatology 2008, 7:2 />Page 12 of 28
(page number not for citation purposes)
Typical GS staining in the noduleFigure 10
Typical GS staining in the nodule. A – Higher magnification. B – Lower magnification. The nodule partly surrounds arterial
vessels – these were better seen using α-SMA staining. The blue arrow indicates an artery, whereas the black arrow indicates
a small hepatic vein (insert) with a thick wall and a narrow almost absent lumen.
α
αα
α−
−−
−SMA
GS
X 40
25 μ
μμ
μm
25 μ
μμ
μm
A
B
Comparative Hepatology 2008, 7:2 />Page 13 of 28
(page number not for citation purposes)
Small hepatic veinsFigure 11
Small hepatic veins. A – GS staining. B – α-SMA staining. In the rather faint GS-positive area, a small hepatic vein (black
arrow) was identified on the right. The vascular lumen was no longer observed on the left (blue arrow). No artery was seen in
the vicinity.
GS
α
αα
α−
−−
−SMA
10 μ
μμ
μm
10 μ
μμ
μm
A
B
Comparative Hepatology 2008, 7:2 />Page 14 of 28
(page number not for citation purposes)
GS-positive hepatocytesFigure 12
GS-positive hepatocytes. A – GS staining. B – H&E staining. A clump of GS-positive hepatocytes (see boxes on Fig. 8) was
observed around dilated sinusoids. Hepatic veins were not visible in this area.
GS
H&E
10 μ
μμ
μm
10 μ
μμ
μm
A
B
Comparative Hepatology 2008, 7:2 />Page 15 of 28
(page number not for citation purposes)
GS-positive stainingFigure 13
GS-positive staining. A – Lower magnification. B – Higher magnification The GS staining surrounds unstained hepatocytes
(asterisk). Hepatic veins were not visible; a small artery (arrow) was seen at the edge of the GS-positive area.
GS
GS
25 μ
μμ
μm
5 μ
μμ
μm
*
A
B
Comparative Hepatology 2008, 7:2 />Page 16 of 28
(page number not for citation purposes)
GS positive fociFigure 14
GS positive foci. GS foci (A – upper panel) contained a small artery (black arrow and insert) very close to arterial branches
(blue arrows), better seen in a α-SMA staining (B – lower panel).
GS
α
αα
α−
−−
−SMA
10 μ
μμ
μm
10 μ
μμ
μm
2.5 μ
μμ
μm
A
B
Comparative Hepatology 2008, 7:2 />Page 17 of 28
(page number not for citation purposes)
GS and α-SMA stainingFigure 15
GS and α-SMA staining. A closer view (see Fig. 8, box on the left): upper micrograph (A) shows GS staining, and lower
micrograph (B) shows α-SMA staining. Arteries (α-SMA staining) are close to large hepatic veins (GS staining).
GS
α
αα
α−
−−
−SMA
10 μ
μμ
μm
5 μ
μμ
μm
A
B
Comparative Hepatology 2008, 7:2 />Page 18 of 28
(page number not for citation purposes)
GS and α SMA stainingFigure 16
GS and α SMA staining. A closer view (see Fig. 8 box in the middle): upper micrograph (A) has GS staining, and lower
micrograph (B) displays α-SMA staining. It illustrates another example of the close vicinity between arteries (α-SMA staining)
and hepatic veins (GS staining).
GS
α
αα
α−
−−
−SMA
10 μ
μμ
μm
10 μ
μμ
μm
A
B
Comparative Hepatology 2008, 7:2 />Page 19 of 28
(page number not for citation purposes)
Arterial vesselsFigure 17
Arterial vessels. A – GS staining. B – α-SMA. Arterial vessels (arrow, insert) were in close contact with the large hepatic vein
partly surrounded by GS-positive hepatocytes.
GS
α
αα
α−
−−
−SMA
25 μ
μμ
μm
25 μ
μμ
μm
5 μ
μμ
μm
A
B
Comparative Hepatology 2008, 7:2 />Page 20 of 28
(page number not for citation purposes)
Fibrotic portal tractFigure 18
Fibrotic portal tract. A fibrotic portal tract (see Fig. 6, box on the left) is observed at higher magnification. There are several
arteries and a few ducts and ductules (A – α-SMA staining). A possible portal vein remnant can also be identified (B – tri-
chrome staining) (arrow).
α
αα
α−
−−
−SMA
5 μ
μμ
μm
5 μ
μμ
μm
Trichrome
A
B
Comparative Hepatology 2008, 7:2 />Page 21 of 28
(page number not for citation purposes)
Fibrotic portal tractFigure 19
Fibrotic portal tract. A fibrotic portal tract (see Fig. 6, box on the right) is observed at higher magnification. The wall of the
portal vein appears damaged (A – trichrome staining). Remnants of small bile ducts can also be identified (B – CK7 staining),
and an aberrant vessel is at the top of the figure.
CK7
10 μ
μμ
μm
10 μ
μμ
μm
Trichrome
A
B
Comparative Hepatology 2008, 7:2 />Page 22 of 28
(page number not for citation purposes)
Non-tumoral liver and noduleFigure 20
Non-tumoral liver and nodule. A – non-tumoral liver, and B – nodule. Ducts and ductules (CK7 and CK19) were more dif-
ficult to identify and less numerous in the tumoral liver than in the non-tumoral liver.
CK7
CK19
A
B
25 μ
μμ
μm
25 μ
μμ
μm
Comparative Hepatology 2008, 7:2 />Page 23 of 28
(page number not for citation purposes)
Non-tumoral liver and noduleFigure 21
Non-tumoral liver and nodule. A – non-tumoral liver, and B – nodule. Hepatic stellate cells identified by CRBP-1 are less
visible in the tumoral liver than in the non-tumoral liver.
CRBP
B
A
25 μ
μμ
μm
25 μ
μμ
μm
CRBP
Comparative Hepatology 2008, 7:2 />Page 24 of 28
(page number not for citation purposes)
Non-tumoral liver and noduleFigure 22
Non-tumoral liver and nodule. A – non-tumoral liver, and B – nodule. There is no major difference regarding capillarisation
of sinusoids in periportal and septal areas between the tumoral liver and the non-tumoral liver.
CD34
B
A
50 μ
μμ
μm
50 μ
μμ
μm
CD34
Comparative Hepatology 2008, 7:2 />Page 25 of 28
(page number not for citation purposes)
Non-tumoral liver and noduleFigure 23
Non-tumoral liver and nodule. A – non-tumoral liver, and B – nodule. There are less macrophages (CD68) in the tumoral
liver than in the non-tumoral liver.
CD68
B
A
25 μ
μμ
μm
25 μ
μμ
μm
CD68