Báo cáo y học: "Non invasive in vivo investigation of hepatobiliary structure and function in STII medaka (Oryzias latipes): methodology and applications" ppsx
Bạn đang xem bản rút gọn của tài liệu. Xem và tải ngay bản đầy đủ của tài liệu tại đây (4.39 MB, 26 trang )
BioMed Central
Page 1 of 26
(page number not for citation purposes)
Comparative Hepatology
Open Access
Research
Non invasive in vivo investigation of hepatobiliary structure and
function in STII medaka (Oryzias latipes): methodology and
applications
Ron C Hardman*, Seth W Kullman and David E Hinton
Address: Duke University, Environmental Sciences and Policy Division, Nicholas School of the Environment and Earth Sciences, LSRC A333,
Durham NC, USA
Email: Ron C Hardman* - ; Seth W Kullman - ; David E Hinton -
* Corresponding author
Abstract
Background: A novel transparent stock of medaka (Oryzias latipes; STII), recessive for all pigments
found in chromatophores, permits transcutaneous imaging of internal organs and tissues in living
individuals. Findings presented describe the development of methodologies for non invasive in vivo
investigation in STII medaka, and the successful application of these methodologies to in vivo study
of hepatobiliary structure, function, and xenobiotic response, in both 2 and 3 dimensions.
Results: Using brightfield, and widefield and confocal fluorescence microscopy, coupled with the
in vivo application of fluorescent probes, structural and functional features of the hepatobiliary
system, and xenobiotic induced toxicity, were imaged at the cellular level, with high resolution (<
1 μm), in living individuals. The findings presented demonstrate; (1) phenotypic response to
xenobiotic exposure can be investigated/imaged in vivo with high resolution (< 1 μm), (2)
hepatobiliary transport of solutes from blood to bile can be qualitatively and quantitatively studied/
imaged in vivo, (3) hepatobiliary architecture in this lower vertebrate liver can be studied in 3
dimensions, and (4) non invasive in vivo imaging/description of hepatobiliary development in this
model can be investigated.
Conclusion: The non-invasive in vivo methodologies described are a unique means by which to
investigate biological structure, function and xenobiotic response with high resolution in STII
medaka. In vivo methodologies also provide the future opportunity to integrate molecular
mechanisms (e.g., genomic, proteomic) of disease and toxicity with phenotypic changes at the
cellular and system levels of biological organization. While our focus has been the hepatobiliary
system, other organ systems are equally amenable to in vivo study, and we consider the potential
for discovery, within the context of in vivo investigation in STII medaka, as significant.
Background
The majority of our understanding of vertebrate hepato-
biliary disease and toxicity has been derived from mam-
malian liver studies [1-5]. We know comparatively less
about piscine biliary disease and toxicity, though we are
beginning to gain greater insight into piscine hepatobil-
iary structure/function relationships [6-17]. Because our
understanding of the piscine biliary system has lagged,
Published: 6 October 2008
Comparative Hepatology 2008, 7:7 doi:10.1186/1476-5926-7-7
Received: 20 March 2007
Accepted: 6 October 2008
This article is available from: />© 2008 Hardman et al; licensee BioMed Central Ltd.
This is an Open Access article distributed under the terms of the Creative Commons Attribution License ( />),
which permits unrestricted use, distribution, and reproduction in any medium, provided the original work is properly cited.
Comparative Hepatology 2008, 7:7 />Page 2 of 26
(page number not for citation purposes)
particularly in a comparative sense, our ability to interpret
and communicate biliary disease and toxicity in aquatic
species has remained limited. By example, cholestasis
(impaired and/or inhibited bile transport) has never been
described in fish, a fact more representative of our lack of
understanding/investigation, as opposed to the lack of
occurrence of this physiological response.
Because the vertebrate liver is a common target organ of
toxicity, largely due to the emergence and prevalence of
modern xenobiotics (e.g., environmental contaminants,
pharmaceuticals) in society over the last century [18-24],
and the fact that various vertebrate systems (fish, rodent,
avian, primate, human) are applied to understanding the
mechanisms and modes of actions involved in xenobiotic
induced injury, a betterment of our comparative under-
standing, and ability to investigate and interpret hepato-
toxicity in the piscine hepatobiliary system, is essential. By
example; the presence of personal care products and phar-
maceuticals (PCPPs) [25-32], persistent environmental
contaminants (POPs) [21,22,33-35], and the widespread
application of antibacterial agents, pesticides, and hor-
mones in aquaculture [36-39] present ecotoxicological
and, because of the human consumption of fish, human
health related concerns, that are likely to persist for dec-
ades. These and other environmental contaminants neces-
sitate enhancement of our ability to understand
hepatobiliary disease and toxicity in piscine species.
Advancement of our understanding of the piscine hepato-
biliary system is not relegated to environmental concerns
alone. Because of their many advantages (e.g., small size,
relative ease of care and use, potentially higher statistical
power due to large study cohorts), small fish animal mod-
els such as medaka, zebrafish, and fathead minnow have
seen increasing application in biomedical research (e.g.,
carcinogenesis, mutagenesis, functional genomics, toxi-
cogenomics) [40-45].
The see-through medaka (Oryzias latipes; STII), recessive
for all pigment genes of chromatophores (iridophores,
melanophores, xanthophores and leucophores) [46], is a
unique small fish animal model that enables high resolu-
tion (< 1 μm) in vivo imaging of biological structure and
function at virtually all levels of organization, from sub-
cellular to gross anatomical [12,47]. Exhibiting no expres-
sion of leucophores and melanophores, and minimal
expression of xanthophores and iridophores, STII medaka
are essentially transparent throughout their life cycle. In
embryo, larval and juvenile STII medaka (from 3 to 60
days post fertilization (dpf)) it is possible to image inter-
nal cells, tissues and organs, and generate three-dimen-
sional (3D) reconstructions from in vivo imaging. We
present here an overview of our findings from in vivo
investigations in STII medaka that demonstrate the utility
of this experimental in vivo system. Specifically, we show
that: phenotypic response to xenobiotic exposure can be
investigated/imaged in vivo with high resolution (< 1
μm); hepatobiliary transport of solutes from blood (sinu-
soid) to bile (intrahepatic biliary passageways) can be
qualitatively and quantitatively studied in vivo; hepato-
biliary development in this model can be described/inves-
tigated via non invasive in vivo observations; and
hepatobiliary structure/function in this lower vertebrate
liver can be studied in 3D.
Our purpose here is to share in vivo methodologies and
present examples of applications of these methodologies
to in vivo investigation. First we describe the in vivo meth-
odologies developed, and then give specific examples of
the successful application of these methodologies to the
evaluation of hepatobiliary structure, function, develop-
ment, and xenobiotic response, in both 2D and 3D.
Because much of our recent research has focused on the
piscine hepatobiliary system, namely biliary system toxic-
ity, this organ system will be emphasized in the examples
provided.
Methods
Medaka
For decades color mutant strains of medaka (Oryzias lat-
ipes), acquired from natural and commercially available
populations, have been maintained in the Laboratory of
Freshwater Fish Stocks at Nagoya University, Japan. Cross
breeding from these stocks was used to produce a stable
"transparent" strain of medaka [46], from which our STII
medaka colony, maintained at Duke University since
2002, was derived. Fish care and maintenance was pro-
vided daily in accordance with Duke University IACUC
approved animal protocols (A117-07-04; A141-06-04;
A173-03-05). Brood stock were housed in a charcoal fil-
trated and UV treated recirculating system (City of Dur-
ham, NC water) maintained at 25 +/- 5°C. Water
chemistries were maintained at; pH (7.0–7.4), dissolved
oxygen (6–7 ppm), ammonia (0–0.5 ppm), nitrite (0–0.5
ppm) and nitrate (0–10 ppm). Brood stock were main-
tained on a diel cycle of 16:8 hr light:dark. Unconsumed
diet, detritus and associated algal material were removed
from brood stock tanks daily. Eggs and egg clusters, col-
lected daily, were separated, cleaned in embryo rearing
medium (ERM), and individual fertilized eggs maintained
in ERM at 25°C for stock maintenance. Medaka larvae
were fed a commercial ration of ground (100 μm) Oto-
hime β daily (Ashby Aquatics, West Chester, PA). In addi-
tion, all brood stock fish diets were supplemented with
Artemia nauplia (hatched brine shrimp) at least once per
day, seven days per week.
Comparative Hepatology 2008, 7:7 />Page 3 of 26
(page number not for citation purposes)
Microscopy
Widefield microscopy was performed on a Zeiss Axi-
oskopp equipped with DAPI/TRITC/FITC fluorescence fil-
ter cube set (DAPI/UV: Ex 360–380 nm/Em All Vis > 400
nm, FITC: Ex 450–490 nm/Em 515–565 nm, TRITC: Ex
528–552 nm/Em 578–632 nm), Zeiss Plan Neofluar 5×/
0.15, 10×/0.3, 20×/0.5, 40×/0.85 pol, and 100×/1.3 oil
objectives, Photometrics CoolSnap digital imaging system
(2048 × 2048-element array) and IP Lab (V. 3.0) image
acquisition software (Scanalytics). A xenon lamp was used
for excitation. For confocal fluorescence microscopy a
Zeiss 510 Meta system with Zeiss LSM 5 Axiovision image
acquisition software, Argon and HeNe laser, and Carl
Zeiss C-apochromatic 40×/1.2 and C-apochromatic 10×/
0.45 objectives, was used. For brightfield microscopy a
Nikon Eclipse E600 with a Nikon DXM 1200 digital cap-
ture system, halogen light source, Nikon plan neo-fluor
10×/0.3 wd16, plan neo-fluor 20×/0.5 wd2.1, plan neo-
fluor 40×/0.75 wd0.72, and plan apo 60×/1.4 wd0.21
(oil) objectives, was used. A Nikon SZM 1500 with a
Nikon DXM 1200 digital capture system, Nikon HR plan
apo 1× WD54 and Nikon HR 0.5× WD136 objectives was
also employed for brightfield dissecting microscopy. All
transmission electron microscopy (TEM) was performed
at the Laboratory for Advanced Electron and Light Optical
Methods (LAELOM), College of Veterinary Medicine,
North Carolina State University, on an FEI/Philips EM
208S Transmission Electron Microscope.
Software
Image analysis and compilation was performed with
EclipseNet (Nikon, USA), Adobe Photoshop (Adobe,
Inc.), ImageJ (NIH, V1.32j), IP Lab software (Scanalytics,
Inc., version 3.55), and Zeiss Image Browser (Carl Zeiss).
All 3 dimensional reconstructions and analyses were per-
formed with Amira 3D (Mercury Computer Systems, Ber-
lin).
Chemicals and fluorescent probes
A list of fluorescent probes is provided in Table 1. The pri-
mary fluorescent probes employed were; 7-benzyloxyre-
sorufin, β-Bodipy C5-HPC, DAPI {4',6-diamidino-2-
phenylindole, dihydrochloride}, and fluorescein isothio-
cyanate (FITC). All fluorescent probes were administered
to STII medaka via aqueous bath in concentration ranges
listed in Table 1. Duration of exposure times (aqueous
bath exposures) varied for each fluorescent probe, and can
be derived from the values given in initial and peak fluo-
rescence column. Other chemicals employed: Diethylnit-
rosamine (N-nitrosodiethylamine, Sigma, N0756), α-
napthylisothiocyanate (Sigma, N4525), β-napthoflavone
(Sigma, N-3633), tricaine-methane sulfonate (Sigma,
E10521), dimethyl sulfoxide (DMSO, Sigma, 276855),
Pronase (streptococcal protease, Sigma), Hank's balanced
salt solution (Sigma, H5899), and phosphate buffered
saline (PBS, sigma).
Xenobiotic exposures
Reference hepatotoxicants α-napthylisothiocyanate
(ANIT) and diethylnitrosamine (DEN) were used for com-
parative study of responses of the hepatobiliary system.
ANIT is a well described biliary toxicant in rodent models
that induces hallmark responses in the mammalian liver,
namely: cytotoxicity in biliary epithelium of bile ductules
and ducts, cholestasis [48-51], and biliary tree arboriza-
tion (biliary epithelial cell hyperplasia) [52-54]. DEN, a
complete carcinogen, is a widely employed reference
hepatotoxicant that has been used in fish [55].
ANIT Exposures: Cohorts (10 to 30 fish) of STII medaka
were exposed to aqueous ANIT to target hepatocytes and
biliary epithelia for toxic response. Exposures were in
aqueous bath during various stages of development,
under acute and chronic exposure conditions. Controls
consisted of untreated medaka, and those that received
DMSO (ANIT solvent). Studies were designed to evaluate
hepatobiliary structure/function during the onset, pro-
gression, and recovery from ANIT induced changes. All
exposures were done in 750 ml wide-bottom glass rearing
beakers at 25°C, 16 hr light/8 hr dark cycle. Aqueous bath
exposure medium was 1:3, ERM:de-ionized water. Acute
exposures: medaka were subjected to single exposures of
ANIT at concentrations from 0.25 μM to 10 μM ANIT and
assessed at multiple time points (e.g., 5 minutes, 15 min-
utes 6, 12, 24, 48, 72 and 96 hrs, and at day 10, 30 and
60 post exposure). Chronic exposures: medaka were re-
exposed every 3 days, or once weekly (static renewal
baths), and examined at the same points given for acute
exposures. DEN exposure was for 48 hrs at 200 ppm in
aqueous bath, after which time medaka were reared for 10
months under normal conditions. At given time points
during ANIT and DEN exposure regimes, subpopulations
of medaka were removed from an exposure cohort for in
vivo investigations, histological, immunohistochemical,
and transmission electron microscopy (TEM) studies.
In vivo methodologies
As an overview, in vivo investigation in STII medaka can
be considered to be comprised of three primary compo-
nents, which describe a "system" of study; (1) sedation,
(2) microscopy/imaging technologies, and (3) fluorescent
probes.
To facilitate in vivo imaging of larval and older STII
medaka (> 8 dpf) non lethal sedation was necessary, par-
ticularly for cellular level investigations. Optimal sedation
was achieved with 10 μM tricaine methane sulfonate (MS-
222). STII medaka were placed in a solution of 10 μM MS-
222 (ERM as solvent), as soon as medaka were anaesthe-
Comparative Hepatology 2008, 7:7 />Page 4 of 26
(page number not for citation purposes)
Table 1: Fluorescent probe specifications
Fluorophore Soluble Ex Em Initial/Peak Assimilation Time
(min)
Exposure Concentration
7-benzyloxyresorufin DMSO 560 590 30/45 50 μM
In vivo CYP3A activity. Uptake via gill, in vivo metabolism in gill and gut, good for investigating blood to bile transport, IHBPs, EHBPs and intestinal
lumen.
7-Ethoxyresorufin DMSO 30/45 10–50 μM
In vivo imaging of CYP1A activity. Uptake via gill, in vivo metabolism in gill and liver. CYP 1A2, 2E Substrate
Acridine Orange H
2
O500526 1–5 μM
In vivo labeling of DNA, RNA. Good for apoptosis, interacts with DNA and RNA by intercalation or electrostatic attractions.
BODIPY 505/515: 4,4-difluoro-1,3,5,7-
tetramethyl-4-bora-3a,4a-diaza-s-
indacene
DMSO 502 510 15/20 5 μM-100 nM
Uptake via gill, active transport through hepatobiliary system, concentrative blood to bile transport, and secretion from gall bladder into gut lumen.
Good for elucidation of gill, IHBP, EHBP, intestinal lumen. Non-Polar, Lipophilic.
BODIPY FL C5-ceramide: N-(4,4-
difluoro-5,7-dimethyl-4-bora-3a,4a-diaza-
s-indacene-3-pentanoyl)sphingosine
DMSO 358 461 20/45 5 μM–100 nM
Putative passive transport in vivo. Uptake via gill, transport through cardiovascular and hepatobiliary systems and secretion from gall bladder into
gut lumen.
Bodipy Verapamil DMSO 504 511 20/60
In vivo Bodipy verapamil localized to hepatocytic cytosol in discrete vesicles. Transport to bile was not observed in the time frame assayed, which
was 90 minutes.
BODIPY
®
493/503: 4,4-difluoro-1,3,5,7,8-
pentamethyl-4-bora-3a,4a-diaza-s-
indacene (BODIPY
®
493/503)
DMSO 493 504 15/20 10 μM
Uptake via gill, active transport through hepatobiliary system, concentrative blood to bile transport, and secretion from gall bladder into gut lumen.
Good for elucidation of gill, IHBPs, EHBPs, intestinal lumen. Lipophilic, amphiphilic.
BODIPY
®
581/591 C5-HPC (Phospho-
choline) PC: 2-(4,4-difluoro-5,7-dimethyl-
4-bora-3a,4a-diaza-s-indacene-3-pen-
tanoyl)-1-hexadecanoyl-sn-glycero-3-
phosphocholine
DMSO 582 593 15/20 30 nM
OIn vivo labeling of intrahepatic and extrahepatic biliary system. Uptake via gill. Hepatobiliary transport to gut lumen. Diffuse fluorescence in
hepatocyte cytosol.
CellTrace™ Oregon Green
®
488 carboxy-
lic acid diacetate, succinimidyl ester (car-
boxy-DFFDA, SE) *cell permeant*
*mixed isomers
DMSO <300 none 15/20 10–100 μM
In vivo labeling of hepatic nuclei, potential for detection of apoptosis
DAPI: 4',6-diamidino-2-phenylindole,
dihydrochloride
H2O, DMF 358 461 15/60 0.3 – 3.0 μM
In vivo nuclear labeling of virtually all cell types associated with gill, gut, liver, and cardiovascular system.
DAPI Diacetate: 4',6-diamidino-2-
phenylindole, diacetate
H2O, MeOH 358 461 15/60 0.3 – 3.0 μM
DAPI diacetate is water-soluble form. In vivo nuclear labeling.
Fluorescein-5-isothiocyanate
(FITC 'Isomer I')
DMSO 494 519 10/30 1 μM – 50 nM
Excellent in vivo probe for elucidating biliary system. In vivo labeling of intrahepatic and extrahepatic biliary system. Hepatobiliary transport to
intestinal lumen. Uptake via gill.
MitoTracker
®
Green FM DMSO 490 516 20/30 25–200 nM
Comparative Hepatology 2008, 7:7 />Page 5 of 26
(page number not for citation purposes)
tized (immotile) they were removed from the sedative
bath and placed in fresh ERM:deionized water (1:3).
Sedated medaka were then placed on a glass depression
well slide with enough ERM:deionized water to fill the
depression well (~400 μl), oriented in a preferred anatom-
ical position, and the depression well slide was sealed
with a cover-slip. For optimal image clarity medaka were
positioned so the dermis was in contact with the coverslip,
which minimized optical distortion that may result from
image diffraction through the fluid space between dermis
and coverslip. Once mounted on a depression well glass
slide medaka were imaged live with brightfield, and wide-
field and laser scanning confocal fluorescence microscopy
(LSCM). Each was found to offer specific advantages,
which will be illustrated through the in vivo findings pre-
sented. A brief overview of considerations for each imag-
ing modality follows.
Gross anatomical investigation of internal organs and tis-
sues was, expectedly, best imaged with brightfield micros-
copy (e.g., Nikon LSM dissecting microscope), though to
some extent widefield microscopy was also successfully
applied (see Figures 1, 2, 3, 4 and 5). Both widefield and
confocal fluorescence microscopy proved excellent for
high resolution (< 1 μm) in vivo observation/imaging of
individual cells, tissues and organs in living individuals
(Figures 1, 2, 3, 4, 5, 6, 7, 8 and 9). While confocal micro-
scopy was superior to widefield in virtually all aspects, as
will be evidenced in the applications described through-
out, widefield microscopy was not without merit and
should be considered a practical means by which to
undertake in vivo investigations in STII medaka. For
instance, widefield microscopy was employed as a screen-
ing method, and for refinement of cellular level method-
ologies (e.g., screening fluorescent probe efficacy and
labeling properties). A fundamental limitation of wide-
field fluorescence microscopy was a greater depth of field,
as compared with confocal. Because of the lack of planar
resolution (depth of field permitted with Xenon laser and
standard Neo-Fluar objectives, see materials and meth-
ods), accurate quantitation of fluorescence was precluded,
and widefield fluorescence microscopy was found limited
to qualitative studies (vs. quantitative in vivo study/imag-
ing). By example, the depth of field with a 60× Plan Neo-
Fluar objective on our Zeiss Axioskopp (widefield) was
0.65 μm; technically, comparable to confocal. However,
this 0.65 μm depth of field represents only the field of fine
focus. Also resolved, due to illumination by Xenon laser
light source, were out of focus planes above and below the
plane of focus. Due to the widefield optics and illumina-
tion source, reflection and refraction from tissues above
and below the plane of imaging resulted in diminished
optical resolution, as compared to confocal microscopy.
Hence, the optical characteristics of widefield microscopy
precluded accurate study of in vivo transport.
LSCM, due to higher planar resolution, was optimal for
quantitative investigations into in vivo hepatobiliary
transport (see Figures 2, 3, 4, 5, 7 and 8 for comparison).
LSCM also offered the advantage of acquisition of confo-
cal stacks of up 100 μm in depth, at planes of section from
0.5 μm to 2 μm. Further, individual confocal stacks could
be joined, allowing for final in vivo confocal image stacks
of up 300 μm in depth (the maximal depth, we found, at
which high quality in vivo imaging could be performed
with the system used). In summary, while widefield was
In vivo labeling of hepatocytes.
SYTO
®
16 green fluorescent nucleic acid
stain
DMSO 488 518 15/30 10 nM-1 μM
In vivo nuclear labeling of epithelia and endothelia, putative in vivo probe for apoptosis.
SYTO
®
27 green fluorescent nucleic acid
stain
DMSO 495 537 15/50 10 nM-1 μM
Apoptosis.
SYTOX
®
Orange nucleic acid stain DMSO 547 570 15/50 0.1–5 μM
Apoptosis
YO-PRO
®
-1 iodide (491/509) DMSO 509 15/60 1 μM
Apoptosis
YOYO-1 Iodide (491/509) DMSO 491 509 15/50 2 – 5 nM
In vivo accumulated in interstitial spaces, some labeling of vasculature. Typically used for assays for cell enumeration, cell proliferation and cell cycle.
Eighteen fluorescent probes were selected for in vivo application based on their molecular weight, utility in elucidating desired structure/function,
biocompatibility, and in vivo transport properties. The fluorescent probe, a description of application(s), the molecular weight (M.W.), solvent used
for stock preparation (solubility), fluorescence excitation and emission wavelengths (Ex/Em), initial and peak fluorescence times (Initial/Peak
Fluorescence (min)), and effective aqueous exposure concentrations are given.
Table 1: Fluorescent probe specifications (Continued)
Comparative Hepatology 2008, 7:7 />Page 6 of 26
(page number not for citation purposes)
sufficient for qualitative study/imaging of hepatobiliary
structure, function and transport, accurate quantitative
study/imaging required the finer spatial resolution pro-
vided by confocal microscopy. Examples illustrating the
differences between widefield and confocal microscopy
are given throughout the findings presented.
Fluorescent probes and endogenous fluorophores
The use of fluorescent probes in living medaka greatly
enhanced our ability to investigate hepatobiliary struc-
ture/function and xenobiotic response in vivo. While flu-
orescent probes have been widely employed in vitro (e.g.,
cell culture based investigations), few commercially avail-
able fluorophores were, at the time these studies were
undertaken, characterized for in vivo use in fish. Fluoro-
phores were selected based on their biocompatibility and
utility in analysis of hepatobiliary morphology and trans-
port, and are given in Table 1. That a probe would exhibit
uptake via aqueous bath was a priority for selection (we
preferred to avoid use of intraperitoneal injection).
For brevity, a discussion of fluorescent probes most fre-
quently employed for elucidation of cell/tissue/organ
structure and function is given. Metabolic substrates 7-
benzyloxyresorufin (7-BR, CYP3A substrate) and 7-ethox-
yresorufin (7-ER, CYP1A substrate) were found valuable
in vivo probes for investigating CYP3A and CYP1A expres-
sion in organs and tissues, and for elucidating the intra-
and extrahepatic biliary system, as well as gut lumen. Both
probes, non-fluorescent in their native state, are metabol-
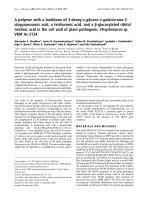
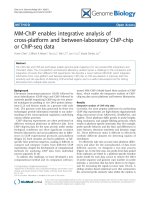
In vivo imaging of tumor formation in STII medaka: brightfield microscopyFigure 1
In vivo imaging of tumor formation in STII medaka: brightfield microscopy. Neoplastic response following early life
stage exposure of STII medaka to the reference hepatocarcinogen diethylnitrosamine (DEN). Medaka acutely exposed at early
life stages to DEN were followed serially, and at 10 months hepatic tumors were imaged through the abdominal wall. (A and C)
In vivo imaging (brightfield) of hepatic tumor formation (green arrowheads) in DEN exposed medaka, showing enlargement of
total liver mass and altered vasculature. Histopathological assessment of the tumor showed mixed hepatocellular (B) and
cholangiocellular carcinomas (D). Biliary hyperplasia (D) was characterized by a single layer of biliary epithelium lining large
cystic spaces in the liver. Opaque white tissue in brightfield images (A&C) is ovary, whereas the gut occupies caudal most
region of the abdominal cavity.
Comparative Hepatology 2008, 7:7 />Page 7 of 26
(page number not for citation purposes)
ically activated (de-alkylation of 7-BR, de-ethylation of 7-
ER) by their respective CYP enzymes to the anionic fluo-
rescent metabolite resorufin. Both probes have been
widely employed in vitro [56,57], and 7-ER has been
employed in vivo in Fundulus heteroclitus and medaka [58-
61]. An example of the in vivo application of 7-benzy-
loxyresorufin, elucidating in vivo CYP3A metabolism,
transport, and hepatic morphology, is given in Figure 2.
Sphingolipids are a structurally diverse class of com-
pounds composed of a polar head group and two nonpo-
lar tails (akin to phospholipids), and are naturally
occurring compounds found in all plants and animals. As
such, we considered the potential for fluorescently-
labeled sphingolipids to be incorporated into live cells,
and found two fluorescent sphingosines, β-Bodipy C5-
HPC and Bodipy FL C5 ceramide, to be useful for in vivo
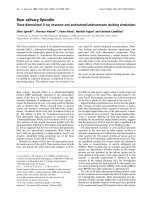
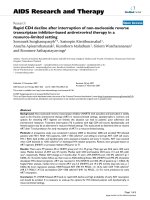
In vivo imaging of hepatobiliary metabolism, transport, and hepatic morphologyFigure 2
In vivo imaging of hepatobiliary metabolism, transport, and hepatic morphology. Utilizing endogenous tissue
autofluorescence in tandem with exogenous fluorescent probes allowed in vivo elucidation of biological structure and function.
Illustrated is the in vivo application of 7-benzyloxyresorufin (7BR) for detection of CYP3A metabolic activity. Dechorionated
embryos exposed (aqueous bath) to the CYP3A substrate 7BR exhibited 7-benzyloxyresorufin-O-dealkylation (BROD) activ-
ity, which resulted in the generation of the fluorescent metabolite resorufin (red). All in vivo images from an individual STII
medaka, 6 dpf. (A) Brightfield microscopy, showing liver (L) and gall bladder (GB). (B1) Same animal as in frame A, imaged with
widefield fluorescence microscopy (DAPI/UV excitation) illustrating tissue autofluorescence. (B2) Widefield fluorescence
(TRITC) image capture of resorufin (indicative of CYP3A metabolic activity) fluorescence in the intrahepatic biliary passage-
ways of the embryonic liver. Resorufin fluorescence is distinct and limited to the intrahepatic biliary passageways of the liver (L)
and gall bladder (GB). (B3) Color composite of B1 and B2, DAPI/TRITC image captures, illustrating resorufin fluorescence
(red) in the liver (L) and gall bladder (GB). (C1 and C2) In vivo imaging of region of interest in frame B3 (white square) showing
in vivo phenotype of hepatic parenchyma at 6 dpf. Six to 8 hepatocytes were observed (in transverse section) to surround a
central bile passageway (IHBP) at their apical membranes. C2 illustrates concentrative transport of resorufin from hepatocellu-
lar cytosol to intrahepatic biliary passageways (IHBPs), indicated by increased fluorescence in the tubule lumen, or intrahepatic
biliary passageway. Red blood cells were observed actively circulating through hepatic sinusoids (S/r). Hepatocyte nuclei (HN).
Comparative Hepatology 2008, 7:7 />Page 8 of 26
(page number not for citation purposes)
study in STII medaka. β-Bodipy C5-HPC, a fluorescently-
labeled phosphocholine, proved biocompatible and was
found optimal for elucidating epithelia, endothelia, and
hepatobiliary transport. β-Bodipy C5-HPC labeled virtu-
ally all epithelia throughout the body of STII medaka.
While in vivo kinetics for fluorescently-labeled sphin-
gosines like β-Bodipy C5-HPC and Bodipy FL C5 cera-
mide are currently unknown, and little information exists
on their in vivo metabolic properties, our observations
suggest β-Bodipy C5-HPC is recognized as an endogenous
sphingolipid, as β-Bodipy C5-HPC was readily incorpo-
rated into virtually all cell membranes under aqueous
exposure conditions. For instance, β-Bodipy C5-HPC was
not only taken up by virtually all epithelia, but also
observed to cross the blood brain barrier (the only fluor-
ophore observed to do so), labeling neural bundles in the
medulla of medaka (Figure 3). β-Bodipy C5-HPC
appeared to be taken up across gill epithelium, and trans-
ported through the cardiovascular system to the liver and
gut. A small organic cation, the in vivo characteristics of
this probe suggested concentrative transport of the fluor-
ophore from blood to bile (hepatic), with fairly rapid (15
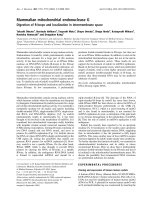
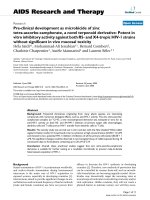
Differential uptake and transport of fluorescent probes β-Bodipy C5-HPC, Bodipy FL C5 Ceramide and Bodipy 505/515: Wide-field and confocal fluorescence microscopyFigure 3
Differential uptake and transport of fluorescent probes β-Bodipy C5-HPC, Bodipy FL C5 Ceramide and Bodipy
505/515: Widefield and confocal fluorescence microscopy. (A – C) β-Bodipy C5 ceramide uptake and distribution: the
ceramide fluorophore (green) exhibited properties consistent with passive diffusion across cell membranes, with distinct
uptake over the gill (GL) and transport through the cardiovascular system. The fluorophore was not observed to cross the
blood-brain barrier (C), though it persisted in vasculature, with a residence time of hours to days (depending on exposure
regime). (D) In contrast, β-Bodipy C5 phosphocholine (HPC) was observed to label neurons in the hind brain of STII medaka.
Frame D is a confocal fluorescence image (from 3D projection) of β-Bodipy C5 phosphocholine labeling neural bundles in the
corpus cerebelli, crista cerebellaris and medulla, 90 minutes post fluorophore exposure (aqueous bath) (STII medaka, 18 dpf).
Corpus cerebelli, crista cerebellaris and medulla are region of interest indicated by gray rectangle in frame (C). (E1 and E2)
Widefield fluorescence microscopy of Bodipy 505/515 secretion (red fluorescence) from gall bladder (GB) through the cystic
duct (CD) and common bile duct (CBD) into the gut lumen. Mucosol folds of the gut (Mf) are the result of β-Bodipy C5 cera-
mide fluorescence (co-administered with Bodipy 505/515). Ventral aorta (Va), Heart Ventricle (Hv), Heart Atrium (Ha), Liver
(L), Pineal Gland (P), Optic Tectum (Ot), Otic Vesicle (Ov), Vasculature (V).
Comparative Hepatology 2008, 7:7 />Page 9 of 26
(page number not for citation purposes)
Figure 4 (see legend on next page)
Comparative Hepatology 2008, 7:7 />Page 10 of 26
(page number not for citation purposes)
minutes post aqueous exposure) accumulation of the
fluorophore in bile. While empirical and quantitative
studies suggest concentrative vectorial transport of this
fluorophore, in vivo kinetics will need further study and
confirmation.
The in vivo kinetics of Bodipy FL C5 ceramide appeared
more consistent with passive diffusion across cell mem-
branes. Uptake and distribution of the fluorophore was
observed to be substantially slower (30 – 45 minutes
slower) than β-Bodipy C5-HPC. Where the fluorescent
phosphocholine saw uptake and concentration in intra-
hepatic biliary passageways as early as 15 minutes post
administration (aqueous bath), the fluorescent ceramide
was not observed to accumulate (peak fluorescence) in
the hepatobiliary system until ~45 minutes post exposure.
Cardiovascular transport of Bodipy FL C5 ceramide was
much more distinct than that of β-Bodipy C5-HPC, with
marked and prolonged residence time in blood plasma,
and distinct labeling of endothelium and red blood cells.
Bodipy FL C5 ceramide, because of its apparently slower
(passive?) uptake, and accumulation in the cytosol of vir-
tually all cell types, was found optimal for investigating
epithelial cell morphology in vivo. This fluorophore also
exhibited a more even distribution (concentration) across
blood plasma, cytosol, and intrahepatic bile passageways.
Hence, Bodipy FL C5 ceramide proved highly effective for
elucidating cell morphology in vivo, allowing imaging of
sinusoids, hepatocytes, and intrahepatic biliary passage-
ways, simultaneously.
The highly lipophilic Bodipy 505/515 and 493, like β-
Bodipy C5-HPC, were also found to be effective fluoro-
phores for investigating hepatobiliary transport and bile
secretion in vivo (Figure 3). Both probes allowed elucida-
tion of the intrahepatic biliary passageways, extrahepatic
biliary passageways, gut lumen, and intestinal lumen (e.g.,
mucosal folds of the gut).
Fluorescein isothiocyanate (FITC) was also utilized for
elucidating the biliary architecture. This small organic cat-
ion showed rapid uptake, with marked differential distri-
bution between blood and bile, and transport into biliary
passageways. Because of the difference in concentration of
FITC (as well as other fluorophores) in blood and bile on
a temporal scale, this allowed for high resolution in vivo
investigation into biliary morphology, bile transport, and
xenobiotic response. (Note: the temporal variation in
blood and bile concentrations is the result of fluorophore
uptake and transport kinetics, determined by the physical
and chemical properties of the fluorophore, and passive
and active transmembrane transport kinetics in gill epi-
thelia and hepatocytes.)
Several probes were found to be useful for in vivo nuclear
labeling, these were: DAPI 4',6-diamidino-2-phenylin-
dole, dihydrochloride; DAPI Diacetate 4',6-diamidino-2-
phenylindole, diacetate; and the SYTO
®
and YO-PRO
®
series of fluorescent probes from Invitrogen (Figure 8).
The ability to label and visualize nuclei of individual cells
in organs and tissues proved valuable not only for struc-
tural elucidation (particularly in 3D), but for differentia-
tion between nuclei and cellular organelles (described
later in the xenobiotic response section).
In addition to the utilization of exogenous fluorophores,
utilization of auto-fluorescence (an innate property of live
cells) of cells was highly useful in delineation of cellular
and tissue morphology in vivo (Figures 2, 4, 5, 8, 9). A
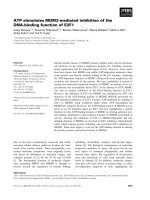
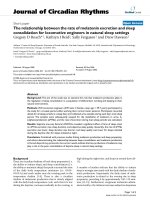
In vivo investigations of hepatobiliary developmentFigure 4 (see previous page)
In vivo investigations of hepatobiliary development. (A1 – 1
st
row) Brightfield microscopy. (A2-2
nd
row) Composites of
DAPI and TRITC image captures, revealing gall bladder (GB) position (red). (A3 – 3
rd
row) DAPI autofluorescence elucidating
vasculature. At day of hatching, 8 dpf, the liver was found as the left lateral longitudinal liver leaflet (L5) phenotype, left lateral
and ventral to the 3rd somite (A1 – A3, 1
st
column). From 8 to 11 dpf the L5 liver and gall bladder descended to the ventral
abdomen, with marked restructuring of the visceral and hepatic vasculature. Translocation of the L5 liver and gall bladder to
the ventral abdomen (A4, A5) was characterized by: descent of the liver and GB, which remained in a longitudinal position, yolk
resorption, the disappearance of the stomatodeal and proctodeal membranes (not shown), the onset of peristalsis, and the
beginning of respiration. (A4) Brightfield microscopy, 11 dpf, ventral view, showing liver, gall bladder and lipid droplet. (A5)
Widefield fluorescence microscopy, DAPI/TRITC composite, ventral view, elucidating liver, gall bladder and vasculature. The
onset of metamorphosis of the hepatobiliary system to a transverse position in the rostral abdominal cavity (adult phenotype)
began at 11 dpf. (B) Widefield fluorescence microscopy, DAPI image capture, ventral view. By 20 dpf the liver and gall bladder
were transverse in the ventro-rostral abdominal cavity, marking the attainment of the adult phenotype. As can be discerned
from the images shown, marked restructuring of the vasculature accompanied metamorphosis of the liver and gall bladder
from an embryonic to adult phenotype. While such observations are purely descriptive, they permitted characterization of hall-
mark events in hepatobiliary development and helped establish normalcy in vivo. Liver (L), Gall Bladder (GB), Heart Atrium
(Ha), Heart Ventricle (Hv), Sinus Venosus (Sv), Hepatic Vein (Hv), Left Duct of Cuvier (Ldc), Median Yolk Vein (Myv), Lipid
Droplet (LD).
Comparative Hepatology 2008, 7:7 />Page 11 of 26
(page number not for citation purposes)
Figure 5 (see legend on next page)
Comparative Hepatology 2008, 7:7 />Page 12 of 26
(page number not for citation purposes)
variety of endogenous compounds are known to fluores-
cence, and the excitation/emission spectra of some of
these are given in Table 2. Among them, endogenous flu-
orescence of nicotinamide adenine dinucleotide phos-
phate (NADPH), riboflavin, flavin co-enzymes and
flavoproteins, as well as porphyrins, has been used as an
indicator of enzyme activity and physiological state in liv-
ing cells [62]. For instance, NADPH fluoresces in its
reduced state, but not in its oxidized state (e.g., NADP). In
contrast flavin adenine dinucleotide fluoresces in its oxi-
dized state (FAD), while fluorescence is undetectable
when reduced to FADH
2
. Because each of these endog-
enous fluorophores are widely employed in a variety of
cellular processes, they, by their fluorescence, can be good
indicators of cell viability and function. For instance,
Ramanujam et al (1994) reported that dysplastic cells
exhibited greater fluorescence, likely due to increased
metabolic rate of altered cell types [63]. These studies
revealed UV light excitation was effective for differentia-
tion of neoplastic and normal cervical tissue, in vivo [63].
Similarly, differential fluorescence has been employed to
distinguish normal, hyperplastic, and adenomatous
human colonic epithelia cells of the mucosa (primary cell
cultures) [64]. Our own in vivo observations noted that
the autofluorescence of non viable cells and tissues was
diminished relative to their viable counterparts.
Our studies found UV/DAPI excitation to be highly useful
in elucidation of morphological features, otherwise diffi-
cult to visualize. For instance, UV/DAPI excitation was
highly effective for visualizing vasculature (blood plasma
was relatively non fluorescent compared to individual epi-
thelial, endothelial and red blood cells). UV/DAPI excita-
tion was also useful for visualizing individual epithelial
cells in vivo (e.g., hepatocyte morphology). Hence, the
innate autofluorescence properties of cells/tissues can be
utilized for investigation of a variety of structural and
functional, as well as diagnostic purposes. Further, savings
in time and materials may be realized, negating the need
to administer exogenous fluorophores to elucidate cellu-
lar and tissue morphology. Note however that UV excita-
tion wavelengths (< 400 nm) are known to be cytotoxic
and special care must be taken when employing these
methods.
At other excitation/emission wavelengths (TRITC/FITC)
general tissue autofluorescence was less distinct than that
observed with DAPI/UV. However, autofluorescence of
bile fluid was marked under both TRITC and FITC illumi-
nation. Because of this TRITC/FITC excitation/emission
could be employed to detect the onset of bile synthesis
(endogenous bile fluorescence), and to observe bile trans-
port in vivo. Of interest, we observed bile autofluores-
cence to vary on a temporal scale, a fact which merits
further detailed study. While TRITC/FITC excitation
resulted in distinct autofluorescence of intra- and extrahe-
patic bile passageways, as well as gall bladder, it was not
consistently observed, suggesting variations in bile com-
position, perhaps due to varying concentrations of endog-
enous fluorophores (in bile) previously discussed (e.g.,
NADP, FADH, porphyrin compounds). For this reason, it
was not possible to fully utilize bile autofluorescence as
an indicator of hepatobiliary transport of specific bile
constituents, though significant potential exists in apply-
ing fluorescence studies to the examination of bile trans-
port.
In vivo imaging of hepatobiliary transportFigure 5 (see previous page)
In vivo imaging of hepatobiliary transport. Fluorophores such as β-Bodipy C5 phosphocholine, shown here, enabled in
vivo elucidation of the biliary system and quantitation of blood to bile transport. (A) Brightfield microscopy of STII medaka at
30 dpf. Green algae can be seen in transport through lumen of the gut. (A1) Widefield fluorescence microscopy of region of
interest indicated by gray square in A, showing β-Bodipy C5 phosphocholine fluorescence in intrahepatic biliary passageways
(IHBPs) of the liver (L) and gall bladder (GB). (B) Confocal DIC microscopy, STII medaka, 9 dpf: Clearly resolved were hepato-
cytes and their nuclei/nucleoli. In longitudinal section 2 rows of hepatocytes characterize parenchymal architecture. Stacked
ovate structures are red blood cells in circulation through the sinusoids (S/r). Red cells appear flattened due to active circula-
tion of cells through sinusoids, and resulting distortion during imaging. (B1) Same as B: Single frame from in vivo confocal image
stack capturing β-Bodipy C5 phosphocholine (green fluorescence) in transport from blood to bile, through intrahepatic biliary
passageways (IHBPs) of the liver (imaged in vivo 30 minutes post fluorophore administration). (B2) Composite of frames B and
B1 localizing fluorophore transport to area between apical membranes of adjacent hepatocytes, suggesting concentrative trans-
port of the fluorophore into IHBPs. (C and D) Frame C is a surface map of region of interest (white square) in frame B1, illus-
trating concentrative transport of the fluorophore from sinusoidal space (S) to bile space (IHBP). (D) Quantitative evaluation of
the white rectangular region of interest in frame B1, spanning an 18.3 μm area from blood to bile (sinusoid to canaliculus), sug-
gested β-Bodipy C5 phosphocholine concentration (fluorescence intensity) to be ~20 times greater in the canalicular (IHBP)
vs. sinusoidal spaces (S). Also evident is an increase in cytosolic concentration of the fluorophore, while no fluorescence was
detected in the nucleus. These types of studies demonstrated concentrative transport of fluorescent probes from blood to bile
can be imaged and quantitatively assessed in vivo. Confocal images captured with C-apochromatic objective, 1.2 NA w/correc-
tion, 488 nm excitation, Zeiss LSM 510. Field size: 76.8 × 76.8 μm.
Comparative Hepatology 2008, 7:7 />Page 13 of 26
(page number not for citation purposes)
Quantitative analysis of blood to bile transport in vivo (STII medaka, 12 dpf): β-Bodipy C5 Phosphocholine (HPC), Fluorescein Isothiocyanate (FTIC) and Bodipy C5 ceramideFigure 6
Quantitative analysis of blood to bile transport in vivo (STII medaka, 12 dpf): β-Bodipy C5 Phosphocholine
(HPC), Fluorescein Isothiocyanate (FTIC) and Bodipy C5 ceramide. Box plots (area averages) and statistical indices:
Quantitative analysis of differential blood to bile transport between β-Bodipy C5 phosphocholine (HPC), fluorescein isothiocy-
anate (FTIC) and Bodipy C5 ceramide. Fluorophores were imaged in vivo at peak uptake times (60 minutes for C5 ceramide,
45 minutes for both FITC and HPC). Differences in blood to bile transport between all three fluorophores were suggested
when measured values (means) of fluorescence intensity across sinusoid, cytosol and canalicular spaces were evaluated. The
most marked differences were between β-Bodipy C5 phosphocholine and fluorescein isothiocyanate, and Bodipy C5 ceramide.
For instance: Where ceramide and FITC showed no statistical difference in concentration in the canaliculus, there were
marked differences in concentration, and temporal variation, in cytosol and sinusoid, suggesting differences in transport kinet-
ics.
Comparative Hepatology 2008, 7:7 />Page 14 of 26
(page number not for citation purposes)
Quantitation of hepatobiliary transport in vivo
For accurate quantitation of transport several key ele-
ments were necessary, and merit a brief discussion. One of
the primary issues was standardization of microscopy
techniques [65-67]. Exposure times while imaging (e.g.,
fluorophore quenching), laser intensity (excitation),
fluorophore concentration in the exposure bath, and
imaging depth in vivo (e.g., how deep into the tissues you
are imaging), were each found to influence and define the
digital image information captured in vivo, and this, is
In vivo imaging of hepatobiliary toxicity: canalicular attenuation/dilation and bile preductular lesionsFigure 7
In vivo imaging of hepatobiliary toxicity: canalicular attenuation/dilation and bile preductular lesions. (A) In vivo
confocal image of untreated medaka liver (30 dpf), illustrating normal appearance of IHBPs, characterized by uniform diameter.
(B – B1) In vivo confocal image, single optical section, of ANIT treated medaka liver (24 dpf) illustrating appearance of dilated
and attenuated bile canaliculi (red arrowhead points to attenuation, white to dilation), 48 hrs post exposure to 2.5 μM ANIT.
Canaliculi were elucidated with fluorescein isothiocyanate. Only the intrahepatic biliary passageways are fluorescent (green).
Parenchyma is largely non fluorescent, aside from weak and diffuse fluorescence of hepatocellular cytosol. Canalicular dilation/
attenuation appeared to be a canalicular constriction/dilation regulatory problem, as no clear alteration to hepatocyte mor-
phology was observed in association with this change. (B1) Dilated canaliculi (gray arrowhead) were found to be up to approx-
imately 3 times normal diameter (e.g., 3.9 μm diameter in dilated vs. 1.3 μm average diameter in normal canaliculi). Attenuated
canaliculi were distinct, appearing as fine sinuous passageways measuring 0.4 μm to 0.8 μm in diameter. (C) Non invasive in
vivo confocal image 10 days post exposure to 2.5 μM ANIT (chronic exposure) showing bile preductular lesions (red arrow-
head), characterized by loss of preductule membrane integrity and loss of uniformity in preductule lumen diameter. Intrahe-
patic biliary passageways elucidated here with Bodipy C5 Ceramide. Black arrowhead illustrates normal appearance of bile
preductule. (C1) Transmission electron micrograph illustrating changes to bile preductular epithelium (BPDEC) associated with
preductular lesions, which showed increased cytosolic area and vacuolation (red arrowhead). In vivo observations helped lead
to the hypothesis that ANIT induced BPDEC toxicity is responsible for bile preductular lesions observed, and that these cells
are early targets of ANIT. (D) Example of a 3D reconstruction of damaged preductule that revealed the damaged bile passage-
way (green) was blind ending, not interconnected with other segments of the intrahepatic biliary network (atypical). Also
shown are bile preductular epithelial cells (purple), illustrating the foci of alteration was a canaliculo-preductular junction. In
(A), (B), and (B1), IHBPs elucidated with FITC, in (C) with Bodipy C5 ceramide.
Comparative Hepatology 2008, 7:7 />Page 15 of 26
(page number not for citation purposes)
Figure 8 (see legend on next page)
Comparative Hepatology 2008, 7:7 />Page 16 of 26
(page number not for citation purposes)
turn, affected quantitation of digital information. Perhaps
one of the most important factors was the time of image
acquisition. Most fluorophores used for investigation of
blood to bile transport were observed to be assimilated by
medaka fairly rapidly (10–20 minutes for initial uptake
from aqueous bath). Peak/maximal fluorescence (a proxy
for fluorophore saturation) occurred some 15 to 90 min-
utes later, depending on the fluorophore used. Hence, in
developing in vivo methodology for quantifying hepato-
biliary transport, several key elements were/are required.
First, uptake, distribution and transport of individual
fluorophores should be fully characterized for standardi-
zation of protocols. This would entail characterizing tem-
poral changes, as well as the effect of fluorophore
concentration (aqueous bath), on uptake and transport
kinetics. In our investigations rigorous study and thor-
ough determination of fluorophore kinetics in vivo was
not possible due to the lack of a dedicated confocal instru-
ment, and time. In lieu of this type of characterization,
observed peak fluorescence times, and a time frame sub-
sequent to peak fluorescence that allowed for in vivo
imaging and quantitation of transport, was determined
for each fluorophore employed.
We provide in Table 1 times at which fluorescence was
first observed in the biliary passageways of the liver (ini-
tial fluorophore uptake), and the time when fluorescence
peaked (maximal saturation). After peak fluorescence was
achieved, fluorophore concentration in vivo (fluores-
cence) was assumed to be at a steady state as long as
medaka remained under constant exposure to the fluoro-
phore in aqueous medium. At this point, transport kinet-
ics were assumed to have reached equilibrium (at the
exposure concentrations given, under chronic exposure
conditions). For our studies it was decided image acquisi-
tion would occur from the onset of peak fluorescence (sat-
uration), or the time when fluorescence intensity peaks at
a given exposure concentration (unique for each fluoro-
phore), and for a predefined period of time following the
onset of peak fluorescence; for our studies, 60 minutes.
Hence, imaging was done at the onset peak fluorescence
and for, on average, no more than 60 minutes post peak
fluorescence. With the above factors accounted for, we
found in vivo quantitation of hepatobiliary transport pos-
sible and a potentially valuable diagnostic tool.
For quantitation, digital images from in vivo investiga-
tions were converted to both RGB 32 bit color, and 8 bit
grayscale. These were then analyzed in ImageJ using the
following techniques. Regions of interest (ROIs) were
defined for sinusoid lumen, hepatocyte cytosol, and
canalicular/bile preductular lumens. ROIs were measured
for fluorescence intensity (brightness value for RGB and
grayscale value for grayscale) in both RGB 32 bit color,
and 8 bit grayscale images. In the image under study mul-
tiple ROIs were randomly selected for; sinusoidal space,
cytosol space and bile space. For instance, in a confocal
stack, acquired from in vivo imaging, multiple ROIs were
measured in each of the three compartments, resulting in
repeated measures. Fluorescence intensity values, as well
as the total area measured for sinusoid, cytosol and bile
space, were imported to Excel and Statview for statistical
analyses. Means were taken for each set of measures (sinu-
soid, cytosol, bile space) and used for plots/graphs.
Descriptive statistics as well as bivariate analyses were
used for quantitation.
In vivo imaging of hepatobiliary toxicity: hydropic vacuolationFigure 8 (see previous page)
In vivo imaging of hepatobiliary toxicity: hydropic vacuolation. Acute exposures to 2 to 6 μM ANIT resulted in a
marked "pebbling" phenotype. This terminology was adopted due to the morphological appearance of the liver (L), first
observed in vivo with widefield fluorescence microscopy. (A) STII medaka control, 20 dpf, showing the normal smooth appear-
ance of the hepatic parenchyma in vivo, as viewed with widefield fluorescence microscopy. (B) Widefield fluorescence micros-
copy, FITC image capture, STII medaka, 20 dpf. Shown is the "pebbled" appearance (black arrowhead) of the liver (L) in vivo;
distinct at 2 μM to 6 μM aqueous ANIT. This phenotypic response was characterized (in vivo) by ovate structures within the
cytosol of hepatocytes, which resulted in a pebbled appearance in the plane of focus in the liver. This phenotype was observed
with the aid of autofluorescence alone, no fluorophores were necessary for visualizing this cellular response. (B1) ANIT
exposed medaka exhibiting the pebbling phenotype were treated with the nuclear stain DAPI (aqueous bath) to label hepato-
cyte and biliary epithelial cell nuclei. After 1 hr of DAPI exposure the hepatobiliary systems of medaka were imaged in vivo via
widefield fluorescence microscopy. These investigations found that intracellular ovate structures (black arrowhead) did not
label with DAPI, and were distinguishable from hepatic and biliary epithelial nuclei (blue). (B2) Transmission electron micro-
graph showing cellular changes consistent with hydropic vacuolation, which was observed in both hepatocytes (black arrow-
head) and bile preductular epithelia (not shown). Vacuoles ranged from 2 μm to 10 μm in diameter, and were found to be
partially to completely filled with electron dense infiltrate. (B3) In vivo confocal image of YO-PRO-1, DIC and TRITC compos-
ite: nuclear labeling experiments performed with YO-PRO-1 revealed uptake of YO-PRO-1 into cells with putatively compro-
mised cell membranes. In grayscale DIC image hydropic vacuoles (black arrowhead) are distinct. Associated with hydropic
vacuolation was a slight increase in apoptosis (ovate green fluorescence, cell type not known). Of interest is the almost literal
appearance of hydropic vacuoles in the confocal DIC fluorescence image (grayscale), where vacuoles appear as liquid droplets.
Gill (Gl), Ventral Aorta (Va), Heart Atrium (Ha), Heart Ventricle (Hv), Liver (L), Gall Bladder (GB), Gut (Gt).
Comparative Hepatology 2008, 7:7 />Page 17 of 26
(page number not for citation purposes)
Three-dimensional reconstructions from in vivo imaging
The fluorescent probes 7-benzyloxyresorufin (7-BR), β-
Bodipy C5-HPC, Bodipy FL C5-ceramide, DAPI, and fluo-
rescein isothiocyanate (FITC) were administered to living
STII medaka in aqueous bath (see Table 1) to elucidate
specific components of the hepatobiliary system (e.g.,
hepatocytes, endothelial cells, biliary epithelia, bile pas-
sageways). Individual medaka were exposed to fluoro-
phores (aqueous bath) at the following concentrations
and durations: 7-BR (10–50 μM, 10 to 30 minutes), β-
Bodipy C5-HPC (30 nM–10 μM, 10 to 30 minutes), Bod-
ipy FL C5-ceramide (500 nM–5 μM, 10 to 44 minutes),
FITC (1 nM – 50 μM, 10 to 30 minutes). After 15 – 60
minutes of fluorophore exposure STII medaka were
sedated, mounted on depression well glass slides with
cover slip and imaged live using LSCM, at various stages
In vivo imaging of hepatobiliary toxicity: passive hepatic congestionFigure 9
In vivo imaging of hepatobiliary toxicity: passive hepatic congestion. (A) Widefield fluorescence DAPI/UV, control
liver, 20 dpf, showing the normal in vivo appearance of hepatic vasculature (black arrowhead). Vasculature appears dark (non
fluorescent). Epithelium of parenchyma appears light gray. (B and C) At 4 μM ANIT, 24 hrs post exposure, modest dilation of
hepatic vasculature was observed throughout the liver (black arrowhead). Image B is DAPI/UV (autofluorescence), image C is
TRITC (autofluorescence). (D) At 8 μM ANIT, 24 hrs, marked dilation of the intrahepatic vasculature was observed (DAPI/
UV). (E) In vivo confocal imaging, acquired at 48 hrs post ANIT exposure, confirmed dilation of intrahepatic vasculature (black
arrowhead) was a pan-hepatic response, occurring uniformly throughout the liver. Vasculature is dark gray, hepatocytes (H)
appear green. (F) Transmission electron micrograph (8 μM, 20 dpf, 48 hrs post exposure) of an intrahepatic vessel in ANIT
treated medaka, revealing abnormal sinusoid/endothelial cell morphology (S). A single red blood cell can be seen in the sinusoid
lumen. Endothelium is highly attenuated. In tandem with morphological changes were changes to cardiovascular function;
decreasing heart rate and motility along with increase in vasodilation, in medaka exposed to 0.5 μM to 8 μM ANIT. Control
heart rates averaged 129 bpm to 140 bpm (n = 12). Heart rate decreased with increasing ANIT concentrations. At 8 μM ANIT
heart rate (means) was observed to be 118 bpm at 6 hrs post exposure, 73 bpm at 24 hrs post exposure, and 61 bpm at 48 hrs
post exposure. At dosage regimes above 4 μM (acute and chronic), vasodilation of the hepatic vasculature was evident. Dila-
tion of sinusoids, hepatic vein, and hepatic portal vein, were all observed. Sinusoid diameters: control sinusoids averaged 7.4
μm. At 8 μM ANIT, 48 hrs post exposure, sinusoid diameter averaged 15.3 μm.
Comparative Hepatology 2008, 7:7 />Page 18 of 26
(page number not for citation purposes)
of development (4–60 dpf). Confocal stacks from in vivo
imaging of the hepatobiliary system were then imported
into the 3D rendering and analytical software, Amira 3D.
Confocal stacks were comprised of 0.5 μm to 2 μm slices
(space between individual images/scans), though 0.7 μm
was most commonly employed. Stacks were typically 90
to 120 μm thick (depth of scan), though in some
instances these were combined to create stacks of up to
200 μm in thickness. The 3D reconstructions, manually
created in Amira 3D, were then used for architectural,
morphometric and volumetric analyses.
Results and discussion
In vivo description of hepatobiliary development
In vivo investigations permitted detailed study and
description of normal development of the medaka hepa-
tobiliary system, which included observation/description
of hallmark events such as organogenesis, the onset of bile
synthesis and transport, and metamorphosis of the liver
from an embryonic to adult phenotype (Figure 4). In vivo
investigations also permitted direct observation of hepatic
architecture at the cellular level at various developmental
stages, observations which, coupled with 3D reconstruc-
tions of the liver, led to important insights. For instance,
characterization of variations in parenchymal architecture
between embryonic and larval stages, and the compara-
tive similarities and differences in vertebrate liver concep-
tual models [12]. Figures 2, 4 [and Additional files 1, 2, 3,
4, 5, 6, 7, 8 and 9] provide examples of results from in vivo
investigations into hepatobiliary development (unpub-
lished studies), investigations that were fundamental to
characterizing normalcy (in vivo) and to subsequent
investigations into adaptive vs. toxic responses of the liver
to xenobiotic exposure (see In vivo investigation of xenobi-
otic response).
Quantitation of hepatobiliary transport in vivo
To put these studies into context a brief overview of hepa-
tobiliary transport is provided. Transport of solutes from
blood to bile is a vital liver function. It is through bile syn-
thesis and transport that xenobiotics of environmental
origin and endogenous metabolic by-products are either
safely removed from the system, or, with systemic accu-
mulation, result in morbidity and mortality [4,68-74].
Inhibition/impairment of bile transport (cholestasis)
commonly results in morbidity and mortality in mam-
mals. Little is known about bile transport in piscine spe-
cies, and the relationship of impaired transport function
to disease and toxicity in these organisms. While it is
becoming increasingly apparent that many piscine species
share bile synthetic and transport mechanisms with their
mammalian counterparts [14,75,76], no studies on
impaired/inhibited bile transport (cholestasis) in fish
exist. Here we show methods that can be used to perform
in vivo assessment of bile transport, and present initial
findings employing these methodologies.
Our investigations show in vivo quantitation of hepato-
biliary transport in STII medaka is possible, and a poten-
tially valuable diagnostic tool for evaluation of normalcy
and toxic response (e.g., cholestasis) in this animal model.
Using fluorescent probes success was achieved in evaluat-
ing blood to bile transport in vivo under both conditions
of normalcy and toxicity in STII medaka. Examples are
given in Figures 5 and 6 and Table 3. While differences
between Bodipy C5 ceramide, and β-Bodipy C5-HPC and
Table 2: Endogenous fluorophores.
Ex (nm) Em (nm)
Flavoproteins: flavin adenine dinucleotide (FAD), flavin mononucleotide (FMN) 450 550
Pyridine Nucleotides: nicotinamide dinucleotide (NAD), nicotinamide dinucleotide phosphate (NADP), the
reduced states fluoresce – NADPH, NADH
336 450
Tryptophan 295 329
Hydroxykynurenine glucoside (3-HGK) 520 550
Serotonin (5-HT) 290/366 340-440/510
5 HIAA 300 350
α-napthol 340 460
Bilirubin 435 500
Protoporphyrin 424/408 594/630
Collagen I 340/500 410/520
Elastin 330 405
Lipofuscin 300 420
Vitamin A 345 490
Vitamin E 295 335
Thiamin (B1) 366 430
Riboflavin (B2) 440 514
Salicylic Acid 319 408
Given are some of the known endogenous fluorophores and their excitation (Ex) and emission (Em) wavelength(s).
Comparative Hepatology 2008, 7:7 />Page 19 of 26
(page number not for citation purposes)
fluorescein isothiocyanate transport were expected, the
more subtle, statistically significant differences between β-
Bodipy C5-HPC and fluorescein isothiocyanate (Figure 6,
Table 3) were especially interesting. For instance, in con-
trast to C5 ceramide, which exhibits kinetics more consist-
ent with passive diffusion across cell membranes, the
latter two fluorophores exhibited kinetics more consistent
with active transport. That these differences are putatively
indicated here in quantitative results is promising for
future investigations into quantifying transport of solutes
from blood to bile in vivo.
Three-dimensional in vivo investigations: hepatobiliary
architecture
Non invasive in vivo imaging in STII medaka allowed the
generation of 3D models of the hepatobiliary system
(Movies 1 – 9), under conditions of normalcy and toxic-
ity. Using LSCM, in tandem with exogenous fluorophores,
we were able to elucidate hepatocellular, biliary and vas-
cular components of the liver in 3D. Three-dimensional
investigations yielded important insights into medaka
hepatobiliary structure/function, which may not have
been possible using standard 2D methodologies alone
(e.g., histological, ultrastructural). For instance, 3D analy-
ses revealed that: the hepatic parenchyma in medaka is
organized through a hexagonal structural motif (polyhe-
dral tessellation), evident in the fine structure of the bil-
iary system; the biliary system is an interconnected
network of canaliculi and bile preductules; the canaliculo-
preductular network perfuses the majority of the liver cor-
pus (~95%) uniformly, with equidiameter intrahepatic
biliary passageways (IHBPs) (1–2 μm) observed through-
out the liver; larger bile ductules and ducts were observed
only at the liver hilus, and consequently an arborizing bil-
iary tree was absent, seen only in the rudimentary branch-
ing of intrahepatic ducts from the hepatic duct;
parenchymal architecture is a predominantly 2 cell thick
muralium, though tubule-like formations may also com-
prise the muralium; the livers of these small fish are
replete with BPDECs, the putative mammalian correlary
of bipotential progenitor/stem cells; BPDECs and hepato-
cytes form unique junctional complexes that create bile
passageways (bile pre-ductules). BPDECs occupy the
center of these junctional complexes, surrounded by bile
pre-ductules. Collectively, these findings characterized the
3D architecture of the medaka hepatobiliary system and
improve our comparative understanding of vertebrate
liver structure and function. These findings also raised
interesting questions regarding the "functional unit" of
the vertebrate liver, suggesting the hepatobiliary system in
medaka can be, as a conceptual model, considered a sin-
gle functional unit of the vertebrate liver, akin to an indi-
vidual unit of the mammalian lobule [12].
Analyses of 3D reconstructions also provided highly accu-
rate volumetric and ratiometric information on biliary,
parenchymal, vasculature and liver volumes, under both
conditions of normalcy and toxicity (Tables 4, 5, 6 and 7).
In vivo morphometric and volumetric findings were
found to correlate well with prior ex vivo studies in verte-
brate livers (Table 6), though in vivo findings see margin-
ally higher hepatocellular and lower vascular volumes.
Hence, it is possible that ex vivo findings may underesti-
mate the volumetric indices of these compartments to
some degree, given in vivo studies, which capture fully
perfused organs (e.g., cytosol, vasculature), likely generate
more realistic indices. While our focus was the hepatobil-
iary system, it should be evident from the examples pre-
sented here, and previously [12], that these types of 3D
investigations in STII medaka, using the same or similar
methodologies, are possible in other organ systems as
well.
In vivo investigation of xenobiotic response
With normalcy characterized (in vivo phenotypes of cells/
tissues, hepatobiliary development, 3D parenchymal
architecture, evaluations of blood to bile transport), it was
then possible to apply this experimental system to the
investigation of toxic response in vivo (see also [77]). To
do so we used two reference hepatotoxicants; α-napthyl
isothiocyanate (ANIT) and diethylnitrosamine (DEN). In
vivo investigations (responses to xenobiotic exposure)
Table 3: Quantitative analysis of blood to bile transport in vivo (STII medaka, 12 dpf): β-bodipy C5 phosphocholine (HPC), fluorescein
Isothiocyanate (FTIC) and bodipy C5 ceramide.
F-test: Hypothesized Ratio = 1
Canaliculus Cytosol Sinusoid
F-value P-value F-value P-value F-value P-value
C5 Ceramide: FITC 1.026 0.9665 38.508 < .0001 18.672 0.0001
C5 Ceramide: HPC 0.117 0.0019 17.109 0.0002 28.413 < .0001
FITC:HPC 0.114 < .0001 0.444 0.0686 1.522 0.3412
Equality of variance F-test comparing measured values (repeated measures, which varied from 30 to 70 depending on number of stacks and available
fields) among cytosol, sinusoid and canalicular spaces are given with P-values. See also Figure 6.
Comparative Hepatology 2008, 7:7 />Page 20 of 26
(page number not for citation purposes)
Table 4: Hepatobiliary morphometrics from in vivo based 3D investigations.
Biliary Mean Mode SD Min Max n =
8 dpf IHBP Segment Length (μm) 11.8 11.6 1.2 10.0 17.0 68.0
12 dpf 11.9 11.6 1.4 9.2 15.8 39.0
30 dpf 12.8 11.3 1.6 9.8 16.5 34.0
40 dpf 11.6 11.1 1.3 8.5 14.6 42.0
8 dpf Degree 120 119.8 118.0 6.7 100.0 137.0 81.0
12 dpf 119.8 127.0 7.2 103.0 136.0 61.0
30 dpf 117.2 123.0 20.8 11.5 134.0 33.0
40 dpf 124.4 123.0 8.5 103.0 146.0 73.0
8 dpf Degree 90 91.4 91.0 4.2 83.0 99.1 15.0
12 dpf 89.9 89.5 5.1 80.6 98.8 16.0
30 dpf 91.0 - 8.0 78.0 101.0 6.0
40 dpf 98.5 103.0 7.9 84.4 109.0 12.0
8 dpf Degrees Other
12 dpf 56.6 50.0 14.7 44.0 88.0 15.0
30 dpf 68.7 40.0 37.6 40.0 163.0 10.0
40 dpf 66.4 49.0 32.6 41.0 154.0 9.0
8 dpf IHBP Diameter (μm) 1.3 1.3 0.3 0.9 1.8 30.0
12 dpf 1.4 1.4 0.2 1.0 2.0 37.0
30 dpf 1.3 1.2 0.3 0.9 2.2 22.0
40 dpf 1.3 1.3 0.5 0.5 2.6 23.0
8 dpf BPD Segment Length (μm)
12 dpf 6.2 6.3 1.5 3.8 9.4 15.0
30 dpf 7.4 6.2 2.6 3.9 13.5 15.0
40 dpf 8.3 - 2.5 4.3 15.6 21.0
Cellular
8 – 40 dpf Hepatocyte Diameter (μm) 11.3 11.8 1.0 8.4 13.5 48.0
8 – 40 dpf BPDEC (μm) 5.5 4.3 1.3 3.3 10.2 48.0
8 dpf Muralium/Tubule Diameter
(height variance of 20 μm to > 100 μm)
21.2 22.7 3.6 13.5 32.7 36.0
20 dpf 29.6 34.5 8.6 19.8 63.4 38.0
30 dpf 26.0 26.9 5.7 17.3 43.8 32.0
40 dpf 24.8 24.5 6.3 16.9 48.7 36.0
Vasculature
8 dpf Sinusoid Diameter (height variance of 8 μm to 31 μm) 6.9 6.7 0.9 5.2 8.8 26.0
20 dpf 7.5 6.9 1.3 5.4 11.3 32.0
30 dpf 7.6 7.6 1.6 4.9 12.1 32.0
40 dpf 7.9 7.1 1.9 3.3 12.6 34.0
20 dpf Hepatic Vein Diameter (μm) 18.9
30 dpf 18.3
20 dpf Portal Vein Diameter (μm) 13.9
30 dpf 14.7
Metrics obtained from 3D reconstructions of the hepatobiliary system at 8, 12, 20, 30 and 40 dpf provided highly accurate morphological
assessment of components of the hepatobiliary system. IHBP segment length corresponds to average length of the canaliculus, which was found to
be approximately the same as hepatocyte diameter. Bile preductule (BPD) segment length is length of bile passageway surrounding BPDECs, a
length that approximates BPDEC diameter. In vivo indices from 3D analyses correlated will with ex vivo ultrastructural (TEM) indices, and in vivo
2D metrics.
Comparative Hepatology 2008, 7:7 />Page 21 of 26
(page number not for citation purposes)
were correlated with histopathology, ultrastructure and
immunohistochemistry for validation/characterization of
xenobiotic response/toxicity.
An example of non invasive in vivo serial analysis of the
adult consequence of early life stage exposure to DEN is
given in Figure 1. Shown is an in vivo assessment of neo-
plastic response 10 months post exposure to DEN. His-
topathology revealed the tumor to be comprised of mixed
neoplasms of hepatocellular and biliary origin, and with
foci of biliary hyperplasia.
In vivo evaluation of responses of the liver to ANIT expo-
sure revealed distinct dose dependent phenotypic
changes, these included: (1) canalicular attenuation and
dilation in response to 1 – 3 μM acute aqueous ANIT
exposure; (2) bile preductular lesions in response to 2 – 5
μM chronic ANIT exposure; (3) hydropic vacuolation, at
ANIT concentrations of 2 – 8 μM ANIT, which resulted in
a distinct "pebbling" of the liver when evaluated in vivo;
and (4) chronic passive hepatic congestion, an end stage
response of the liver associated with high mortality, at 6 –
8 μM ANIT (see Figures 7, 8 and 9). In vivo observations
were correlated with ex vivo histological and electron
microscopic studies to aid in interpretation of in vivo
findings and to verify affected cell types. Lastly, volumetric
analyses of 3D reconstructions from ANIT treated medaka
suggested a possible reduction in bile flow, as well as chol-
eresis, with no changes to other volumetric liver indices
(Tables 4, 5 and 7). In vivo 3D morphometric and volu-
metric indices were consistent with both in vivo (2D) and
ex vivo findings (ultrastructural studies), revealing accu-
racy and standardization of quantitative assessments
across in vivo and ex vivo techniques. These findings,
while largely descriptive, suggest ANIT induced changes in
the medaka hepatobiliary system are: (1) similar to ANIT
induced changes described in rat liver, and (2) consistent
Table 5: Hepatobiliary volumetrics from in vivo based 3D investigations.
8 dpf Volume μm
3
% Volume SA μm
2
Intrahepatic Biliary Passageways 3653 1.03% 12259
Vasculature 22416 6.33% 23586
Parenchyma 331569 93.67%
Hepatocellular 327916 92.64%
Liver Corpus 353985 - 47310
Stack size: 115 × 115 × 50 μm, sections: 1 μm, scaling/voxel size: 0.2 × 0.2 × 1 μm, 3D volume analysis: ~50% total liver volume
12 dpf Volume μm
3
% Volume SA μm
2
Intrahepatic Biliary Passageways 19877 0.86% 47808
Vasculature 199157 8.60% 127215
Parenchyma 2117236 91.40%
Hepatocellular 2097359 90.54%
Liver Corpus 2316393 - 318879
Stack size: 230 × 230 × 90 μm, sections: 1 μm, scaling/voxel size: 0.45 × 0.45 × 1 μm, 3D volume analysis: ~50% total liver volume
30 dpf Volume μm
3
% Volume SA μm
2
Intrahepatic Biliary Passageways 11435 1.01% 24871
Vasculature 85837 7.60% 38682
Parenchyma 1043352 92.40%
Hepatocellular 1031917 91.39%
Liver Corpus 1129189 - 272427
Stack size: 325 × 325 × 178 μm, sections: 1 μm, scaling/voxel size: 0.64 × 0.64 × 2 μm, 3D volume analysis: ~15% total liver volume
Hepatobiliary metrics obtained from 3D reconstructions of the hepatobiliary system at 8, 12 and 30 dpf. A consistent relationship among the
volume of intrahepatic biliary passageways, vasculature, hepatocellular volume, and parenchymal volume, in relation to total liver volume analyzed
(liver corpus), was found across each stage of development. Given are the dimensions of in vivo confocal stacks from which 3D reconstructions
were made, as well as voxel size (a proxy for resolution). Also given are estimates for the total volume of liver analyzed; for instance, at 8 dpf, it is
estimated that the stack size was ~50% of total liver volume, and at 30 dpf, the stack dimensions are estimated to comprise ~15% of total liver
volume. Total volume of each 3D reconstruction corresponds to volume of liver corpus. Parenchymal volume is comprised of hepatocellular space,
BPDECs and intrahepatic biliary passageways. SA = Surface Area; Vol = Volume
Comparative Hepatology 2008, 7:7 />Page 22 of 26
(page number not for citation purposes)
with responses commonly observed in cholestasis in
mammalian livers.
Conclusion
We have described the development and application of
non invasive in vivo methodologies to the study of bio-
logical structure, function and xenobiotic response in STII
medaka. The development of this in vivo investigatory
"system" encompassed the validation and application of
exogenous fluorescent probes, and endogenous fluores-
cence, for the in vivo study of biological structure, func-
tion, and xenobiotic response, in STII medaka, in both 2D
and 3D contexts. With confocal microscopy, high resolu-
tion (< 1 μm) in vivo imaging was achieved (e.g., subcel-
lular).
Of particular interest is the ability to investigate biological
structure/function relationships, and xenobiotic response,
in 3D, and to potentially integrate molecular mechanisms
of toxicity with system level phenotypic changes, in a 3D
Table 7: Volumetric assessment of α-napthylisothiocyanate (ANIT) exposed livers
30 dpf 2.5 μM ANIT, 48 hpd Volume μm
3
% Volume SA μm
2
Intrahepatic Biliary Passageways 11743 0.5% 37818
Vasculature 159187 7.3% 92092
Parenchyma 2023674 92.7% 0
Hepatocellular 2011931 92.2% 0
Liver Corpus 2182861 - 156422
Stack size: 230 × 230 × 89 μm, 1 μm sections, scaling/voxel size 0.45 × 045 × 1 μm, 3D volume analysis ~30% total liver volume
30 dpf 1 μm ANIT, 48 hpd Volume μm
3
% Volume SA μm
2
Intrahepatic Biliary Passageways 100354 1.18% 164119
Vasculature 421852 7.92% 207939
Parenchyma 8083460 92.08%
Hepatocellular 7983106.00 100.00%
Liver Corpus 8505312 546491
Stack size: 325 × 325 × 89 μm, 1 μm section, scaling/voxel size 0.64 × 0.64 × 1 μm. ~30% total liver volume
Mean: 8 – 30 dpf 2.5 μM ANIT 30 dpf 1 μM ANIT 30 dpf
CTRL vs. Treated % Volume % Volume % Volume
Intrahepatic Biliary Passageways 0.97% 0.5% 1.18%
Vasculature 7.51% 7.3% 7.92%
Parenchyma 92.49% 92.7% 92.08%
Hepatocellular 91.52% 92.2% 92.15%
Liver Corpus
Volumetric comparisons between normal and ANIT exposed livers. Indices are summarized in the lower part of Table 7 (see also Table 5). Medaka
treated with 1 μM ANIT and analyzed (3D reconstructions, volumetrics) at 30 days exhibited an increase in volume of intrahepatic biliary
passageways. Medaka treated with 2.5 μM ANIT and analyzed at 30 days exhibited a decrease in intrahepatic biliary volume. Where biliary volumes
were changed in ANIT exposed animals, other indices of vasculature, parenchymal and hepatocellular volume remained relatively well conserved
across normal and treated medaka. These results, while from only 2 treated animals, may suggest a choleretic response at low ANIT exposure
concentrations, and cholestatic like response at higher aqueous ANIT concentrations. Due to the time consuming nature of 3D reconstructions,
only 2 livers of treated animals were reconstructed in full.
Table 6: Comparative hepatobiliary volumetric studies.
Component (% Volume) Rat [78] Dog [79] Rainbow trout [80] Golden Ide [81] Brown trout [16] Medaka
Hepatocytes 77.8 84.4 84.5 88.9 87.3 91.5
Biliary Epithelia 22.2 15.6 15.5 11.1 15.18 -
Sinusoid Lumen 10.6 4.3 9.4 6.6 6.23 7.51
Bile Canaliculi 0.4 0.5 1.1 0.7 0.45 0.96
Given are comparative metrics for components of the hepatobiliary system from mammalian and piscine studies. When comparing metrics note
that values for medaka are from 3D in vivo investigations, metrics from other studies were derived from ex vivo histological and ultrastructural
studies. No total volume was obtained for biliary epithelia in medaka, however, these cell types were found predominantly in the hilar region of the
liver, and it is estimated they comprise a similar volume as those reported in other studies above.
Comparative Hepatology 2008, 7:7 />Page 23 of 26
(page number not for citation purposes)
context. Significant advances have been achieved over the
last decade in 3D elucidation of structure/function rela-
tionships at the molecular/protein levels of biological
organization. However, similar information on organ sys-
tem structure and function at the cellular level has lagged.
Elucidation of biological structure/function relationships
in a real world 3D context is vital to advance our interpre-
tive and diagnostic capabilities (e.g., normalcy and dis-
ease/toxicity), further our comparative understanding of
organ system ontogeny, and integrate genetic and molec-
ular information with system levels of biological organi-
zation. The latter is of particular importance. One of the
main challenges facing life sciences is the integration and
interpretation of genomic, proteomic, and metabolomic
information in relation to the complex physiological sys-
tem in which "omic" mechanisms operate. As these find-
ings suggest, STII medaka provide a unique means by
which to potentially integrate mechanisms of toxicity
(e.g., genomic, proteomic function) with system level
responses and phenotypic changes, in vivo (the overarch-
ing goal of our laboratory).
The findings presented also demonstrate in vivo quantita-
tion of hepatobiliary transport is possible, suggesting STII
medaka provide a novel means by which to investigate
piscine hepatobiliary transport, and the effects of toxins/
toxicants, as well as genetic disorders, on biliary transport
mechanisms. Because hepatobiliary transport may be
impaired by a variety of pharmaceuticals and environ-
mental contaminants, the ability to investigate altered
organ system function in vivo is a valuable tool that
should prove valuable to the future study of piscine biliary
transport.
Collectively these findings demonstrate the ability to
study, with high resolution, normalcy and disease/toxicity
in vivo in the hepatobiliary system of living medaka, a
capability that provides a valuable diagnostic and investi-
gatory tool. The reviewed findings presented here, in con-
junction with earlier studies [11,16,77-85], have, we feel,
significantly advanced our comparative understanding of
the piscine liver, and we consider the potential for discov-
ery, within the context of in vivo investigation in STII
medaka, as significant.
Competing interests
The authors declare that they have no competing interests.
Authors' contributions
RCH carried out the majority of research: in vivo method-
ology development, application of in vivo methodologies
to investigation of normalcy and toxicity in STII medaka,
and 3 dimensional reconstructions and analyses. SWK
provided much appreciated assistance with fluorescent
cytochrome P450 substrates. DEH provided invaluable
expertise on interpretation of toxicity, histology and
ultrastructural work. All authors have read and approved
the content of the manuscript.
Additional material
Additional file 1
STII medaka, 12 dpf, left lateral view. Lacking dermal and visceral pig-
mentation, internal organs are readily visible through the body wall, and
amenable to in vivo observation/imaging. Note peristalsis in the gut on a
temporal scale. Liver (L), Gut (Gt), Otic Vesicle (Ov), Spleen (Sp), Air/
Swim Bladder (AB), Heart (H).
Click here for file
[ />5926-7-7-S1.mp4]
Additional file 2
In vivo confocal imaging of hepatobiliary system, STII medaka, 9 dpf.
Example of a confocal stack acquired in vivo. Parenchyma elucidated here
with
β
-Bodipy C5 ceramide. Hepatocyte nuclei (HN) appear dark (non
fluorescent), cytosol is distinct. Red blood cells can be seen in circulation
through sinusoids (S/r). Note differential fluorescence between sinusoid
lumen vs. cytosol. Endothelial cells lining sinusoids are also distinct. Stack
size [x : y : z = 192 × 192 × 62
μ
m], Scaling [0.37 × 0.37 × 0.7
μ
m].
Click here for file
[ />5926-7-7-S2.mov]
Additional file 3
Three-dimensional reconstruction of canaliculi and sinusoids from in
vivo confocal image stack: relationship of sinusoids to intrahepatic bil-
iary passageways, STII medaka, 30 dpf. Shown is an isolated section of
the parenchyma from a 3D reconstruction. Canaliculi (C, green), which
average 1.3
μ
m in diameter, are green, sinusoids (S, red). Examples of
metrics acquired from 3D reconstructions are given for illustrative pur-
poses. The example movie shown here, extracted from an Amira 3D recon-
struction, is limited to rotation in a single plane. Actual 3D
reconstructions can be rotated in any plane, at virtually any magnifica-
tion, allowing detailed study of hepatobiliary structure/function relation-
ships.
Click here for file
[ />5926-7-7-S3.mov]
Comparative Hepatology 2008, 7:7 />Page 24 of 26
(page number not for citation purposes)
Acknowledgements
Thanks to Dr. David Miller, Laboratory of Pharmacology and Chemistry,
National Institute of Environmental Health Sciences, Research Triangle
Park, for providing access to their laser scanning confocal microscopy facil-
ity, and special thanks to the Duke University Integrated Toxicology Pro-
gram. This publication was made possible by Grant Number 1 RO1
RR018583-02 from the National Center for Research Resources (NCRR),
a component of the National Institutes of Health (NIH). Its contents are
solely the responsibility of the authors and do not necessarily represent the
official views of NCRR or NIH.
References
1. Alpini G, Glaser S, Alvaro D, Ueno Y, Marzioni M, Francis H, Baiocchi
L, Stati T, Barbaro B, Phinizy JL, Mauldin J, Lesage G: Bile acid deple-
tion and repletion regulate cholangiocyte growth and secre-
tion by a phosphatidylinositol 3-kinase-dependent pathway
in rats. Gastroenterology 2002, 123(4):1226-1237.
2. Bove KE, Daugherty CC, Tyson W, Mierau G, Heubi JE, Balistreri WF,
Setchell KD: Bile acid synthetic defects and liver disease. Pedi-
atr Dev Pathol 2000, 3(1):1-16.
3. Boyer JL: Bile duct epithelium: frontiers in transport physiol-
ogy. Am J Physiol 1996, 270(1 Pt 1):G1-5.
Additional file 4
Example of 3D reconstruction of hepatic parenchyma from in vivo con-
focal image stack: bile preductules and preductular epithelial cells,
STII medaka, 24 dpf. Shown is an isolated section of the parenchyma
showing the 3D characteristics of bile preductular epithelia (BPDEC) and
bile preductules (BPD), the latter a unique morphological feature created
by junctional complexes between hepatocytes and BPDECs. Hepatocytes,
which occupy the negative/empty space, are not rendered for visual clarity.
A canaliculus (C, green) is shown joining a bile preductule (BPD, green).
The background grayscale image is a single optical section from a confocal
image stack. Red blood cells can be seen in circulation through sinusoids
of the liver (S/r) in confocal image. To our knowledge this was the first
rendering of this bile preductule junctional complex in 3D, the evaluation
of which provided novel insights into parenchymal organization. The
movie given here, extracted from an Amira 3D reconstruction, is limited
to rotation in a single plane. Actual 3D reconstructions can be rotated in
any plane, at virtually any magnification, allowing detailed study of hepa-
tobiliary structure/function relationships.
Click here for file
[ />5926-7-7-S4.mov]
Additional file 5
Example of 3D reconstruction of parenchyma from in vivo confocal
image stacks: relationship of sinusoids to intrahepatic biliary passage-
ways, STII medaka, 30 dpf. Sinusoids (S) are red, canaliculi (C) in
green. All space between sinusoids and surrounding canaliculi (empty) is
hepatocellular space, not rendered for visual clarity. Morphometric and
volumetric analyses of 3D reconstructions assisted elucidation of paren-
chymal architecture, and relationship of canaliculi to sinusoids. These
types of investigations revealed medaka hepatic parenchyma to be more
akin to a muralium like structure (as opposed to tubular architecture).
Grayscale confocal image can be seen in the background. The movie given
here, extracted from an Amira 3D reconstruction, is limited to rotation in
a single plane. Actual 3D reconstructions can be rotated in any plane, at
virtually any magnification, allowing detailed study of hepatobiliary struc-
ture/function relationships.
Click here for file
[ />5926-7-7-S5.mov]
Additional file 6
Example of 3D reconstruction of hepatobiliary architecture from in
vivo confocal image stack: sinusoids and parenchymal architecture,
STII medaka, 30 dpf. Sinusoids (S) are red. All space between sinusoids
(empty) is hepatocellular space, not rendered for visual clarity. Morpho-
metric and volumetric analyses of 3D reconstructions allowed elucidation
of parenchymal architecture, and revealed medaka parenchyma more akin
to a muralium like structure (as opposed to tubular architecture). Back-
ground grayscale image is a single frame from a confocal image stack from
which the 3D model was generated. The movie given here, extracted from
an Amira 3D reconstruction, is limited to rotation in a single plane.
Actual 3D reconstructions can be rotated in any plane, at virtually any
magnification, allowing detailed study of hepatobiliary structure/function
relationships. STII medaka, 30 dpf.
Click here for file
[ />5926-7-7-S6.mov]
Additional file 7
Example of 3D reconstruction of the hepatobiliary system from in vivo
confocal image stacks: relationship of sinusoids to intrahepatic biliary
passageways, STII medaka, 12 dpf. Sinusoids (S) are denoted in red,
intrahepatic biliary passageways (IHBPs) in green/gold. All space between
sinusoids and surrounding IHBPs is hepatocellular space, not rendered for
visual clarity. These types of reconstructions permitted 3D morphometric
and volumetric analyses, which assisted in elucidation of hepatobiliary
architecture. Grayscale confocal image can be seen in the background. The
movie given here, an image capture from an Amira 3D reconstruction, is
limited to rotation in a single plane. Actual 3D reconstructions can be
rotated in any plane, at virtually any magnification, allowing detailed
study of hepatobiliary structure/function relationships.
Click here for file
[ />5926-7-7-S7.mov]
Additional file 8
Example of 3D projection of liver and gall bladder from in vivo con-
focal image stacks: STII medaka, 12 dpf. 3D projections of confocal
image stacks, in conjunction with 3D reconstructions, aided in evaluation
of 3D architecture of the hepatobiliary system. Intrahepatic biliary pas-
sageways (IHBPs) of the liver (L), and gall bladder (GB) were elucidated
with fluorescein isothiocyanate.
Click here for file
[ />5926-7-7-S8.mov]
Additional file 9
Example of 3D projection of parenchyma from in vivo confocal image
stacks: STII medaka, 12 dpf. 3D projections of confocal image stacks, in
conjunction with 3D reconstructions, aided in evaluation of 3D hepato-
biliary architecture. Intrahepatic biliary passageways (IHBPs) of the liver,
denoted by increased fluorescence, elucidated with
β
-Bodipy C5 Phospho-
choline (HPC).
Click here for file
[ />5926-7-7-S9.mov]
Comparative Hepatology 2008, 7:7 />Page 25 of 26
(page number not for citation purposes)
4. Boyer JL: Bile secretion – models, mechanisms, and malfunc-
tions. A perspective on the development of modern cellular
and molecular concepts of bile secretion and cholestasis. J
Gastroenterol 1996, 31(3):475-481.
5. Chignard N, Mergey M, Veissiere D, Parc R, Capeau J, Poupon R, Paul
A, Housset C: Bile acid transport and regulating functions in
the human biliary epithelium. Hepatology 2001, 33(3):496-503.
6. Ballatori N, Hager DN, Nundy S, Miller DS, Boyer JL: Carrier-medi-
ated uptake of lucifer yellow in skate and rat hepatocytes: a
fluid-phase marker revisited. Am J Physiol 1999, 277(4 Pt
1):G896-904.
7. Ballatori N, Rebbeor JF, Connolly GC, Seward DJ, Lenth BE, Henson
JH, Sundaram P, Boyer JL: Bile salt excretion in skate liver is
mediated by a functional analog of Bsep/Spgp, the bile salt
export pump. Am J Physiol Gastrointest Liver Physiol 2000,
278(1):G57-63.
8. Boyer JL, Schwarz J, Smith N: Biliary secretion in elasmobranchs.
I. Bile collection and composition. Am J Physiol 1976,
230(4):970-973.
9. Boyer JL, Schwarz J, Smith N: Biliary secretion in elasmobranchs.
II. Hepatic uptake and biliary excretion of organic anions. Am
J Physiol 1976, 230(4):974-981.
10. Hampton J, Lantz R, Goldblatt P, Lauren D, Hinton D: Functional
units in rainbow trout (Salmo gairdneri, Richardson) liver: II.
The biliary system. Anat Rec 1988, 221(2):619-634.
11. Hampton JA, Lantz RC, Hinton DE: Functional units in rainbow
trout (Salmo gairdneri, Richardson) liver: III. Morphometric
analysis of parenchyma, stroma, and component cell types.
Am J Anat 1989, 185(1):58-73.
12. Hardman R, Volz DC, Kullman S, Hinton DE: An in vivo look at
vertebrate liver architecture: 3 dimensional reconstructions
from Medaka (Oryzias latipes). Anat Rec 2007, 290(7):770-782.
13. Hinton D, Couch J: Architectural pattern, tissue and cellular
morphology in livers of fishes: relationship to experimen-
tally-induced neoplastic responses. EXS 1998, 86:141-164.
14. Hinton D, Segner H, Braunbeck T, Kullman S, Hardman R: Chapter
7: Liver Toxicity. In The Toxicology of Fishes: Unit 2, Key Target Sys-
tems Edited by: DiGiulo R, Hinton DE. Boca Raton, Fl: Taylor & Fran-
cis; 2008.
15. Hinton DE: The liver of fishes as a target organ of toxic chem-
icals: a new look at unique structure and function in one of
the 'other' vertebrates. Mar Environ Res 2000, 50(1–5):307.
16. Rocha E, Monteiro RA, Pereira CA: Liver of the brown trout,
Salmo trutta (Teleostei, Salmonidae): a stereological study at
light and electron microscopic levels. Anat Rec 1997,
247(3):317-328.
17. Rocha E, Monteiro RA, Pereira CA: The liver of the brown trout,
Salmo trutta fario: a light and electron microscope study. J
Anat 1994, 185(2):241-249.
18. Kaplowitz N: Drug-induced liver disorders: implications for
drug development and regulation. Drug Saf 2001,
24(7):483-490.
19. Lee WM: Acute liver failure in the United States. Semin Liver
Dis 2003, 23(3):217-226.
20. Meadows M: Serious liver injury. Leading reason for drug
removals, restrictions. FDA Consum 2001, 35(3):8-9.
21. Moore M, Lefkovitz L, Hall M, Hillman R, Mitchell D, Burnett J:
Reduction in organic contaminant exposure and resultant
hepatic hydropic vacuolation in winter flounder (Pseudopleu-
ronectes americanus) following improved effluent quality and
relocation of the Boston sewage outfall into Massachusetts
Bay, USA: 1987–2003. Mar Pollut Bull 2005, 50(2):156.
22. Stehr CM, Johnson LL, Myers MS: Hydropic vacuolation in the
liver of three species of fish from the U.S. West Coast: lesion
description and risk assessment associated with contami-
nant exposure. Dis Aquat Organ 1998, 32(2):119-135.
23. Watkins PB: Idiosyncratic liver injury: challenges and
approaches.
Toxicol Pathol 2005, 33(1):1-5.
24. Weinhold B: Body of Evidence. Environ Health Perspec 2003,
111(7):.
25. Bound JP, Voulvoulis N: Pharmaceuticals in the aquatic environ-
ment – a comparison of risk assessment strategies. Chemos-
phere 2004, 56(11):1143-1155.
26. Daughton CG: Cradle-to-cradle stewardship of drugs for min-
imizing their environmental disposition while promoting
human health. II. Drug disposal, waste reduction, and future
directions. Environ Health Perspect 2003, 111(5):775-785.
27. Daughton CG: Environmental stewardship and drugs as pol-
lutants. Lancet 2002, 360(9339):1035-1036.
28. Jones OA, Voulvoulis N, Lester JN: Human pharmaceuticals in
the aquatic environment a review. Environ Technol 2001,
22(12):1383-1394.
29. Kolpin D: Pharmaceuticals, Hormones, and Other Organic
Wastewater Contaminants in U.S. Streams, 1999–2000: A
National Reconnaissance. Environ Sci Technol 2002,
36(6):1202-1211.
30. Moldovan Z: Occurrences of pharmaceutical and personal
care products as micropollutants in rivers from Romania.
Chemosphere 2006, 64(11):1808-1817.
31. Richardson BJ, Lam PKS, Martin M: Emerging chemicals of con-
cern: Pharmaceuticals and personal care products (PPCPs)
in Asia, with particular reference to Southern China. Mar Pol-
lut Bull 2005, 50(9):913.
32. Weigel S, Kuhlmann J, Huhnerfuss H: Drugs and personal care
products as ubiquitous pollutants: occurrence and distribu-
tion of clofibric acid, caffeine and DEET in the North Sea. Sci
Total Environ 2002, 295(1–3):131-141.
33. Bodammer JE, Murchelano RA: Cytological study of vacuolated
cells and other aberrant hepatocytes in winter flounder from
Boston Harbor. Cancer Res 1990, 50(20):6744-6756.
34. Gardner GR, Pruell RJ:
A histopathological and chemical assess-
ment of winter flounder, lobster and soft-shelled clam indig-
enous to Quincy Bay, Boston Harbor and an in-situ
evaluation of oysters including sediment (surface and cores)
chemistry. Narragansett RI: U.S. Environmental Protection Agency,
Environmental Research Laboratory; 1988.
35. Harshbarger JC, Clark JB: Epizootiology of neoplasms in bony
fish of North America. Sci Total Environ 1990, 94(1–2):1-32.
36. Alderman DJ, Hastings TS: Antibiotic use in aquaculture: devel-
opment of antibiotic resistance – potential for consumer
health risks. IJFST 1998, 33(2):139-155.
37. Cabello FC: Heavy use of prophylactic antibiotics in aquacul-
ture: a growing problem for human and animal health and
for the environment. Environ Microbiol 2006, 8(7):1137-1144.
38. Goldburg R, Naylor R: Future seascapes, fishing, and fish farm-
ing. Frontiers Ecol Environ 2005, 3(1):21-28.
39. Rhodes G, Huys G, Swings J, McGann P, Hiney M, Smith P, Pickup
RW: Distribution of oxytetracycline resistance plasmids
between Aeromonads in hospital and aquaculture environ-
ments: Implication of Tn1721 in dissemination of the tetra-
cycline resistance determinant Tet A. Appl Environ Microbiol
2000, 66(9):3883-3890.
40. Alestrom P, Holter JL, Nourizadeh-Lillabadi R: Zebrafish in func-
tional genomics and aquatic biomedicine. Trends Biotechnol
2006, 24(1):15.
41. Alvarado AS, Tsonis PA: Bridging the regeneration gap: genetic
insights from diverse animal models. Nat Rev Genet 2006,
7(11):873.
42. Amsterdam A, Hopkins N: Mutagenesis strategies in zebrafish
for identifying genes involved in development and disease.
Trends Genet 2006, 22(9):473.
43. Cossins A, Fraser J, Hughes M, Gracey A: Post-genomic
approaches to understanding the mechanisms of environ-
mentally induced phenotypic plasticity. J Exp Biol 2006,
209(12):2328-2336.
44. Cossins AR, Crawford DL: Fish as models for environmental
genomics. Nat Rev Genet 2005, 6(4):324-333.
45. Hinton DE, Kullman SW, Hardman RC, Volz DC, Chen PJ, Carney M,
Bencic DC: Resolving mechanisms of toxicity while pursuing
ecotoxicological relevance? Mar Pollut Bull 2005.
46. Wakamatsu Y, Pristyazhnyuk S, Kinoshita M, Tanaka M, Ozato K: The
see-through medaka: a fish model that is transparent
throughout life. Proc Natl Acad Sci USA 2001, 98(18):10046-10050.
47. Hinton DE, Wakamatsu Y, Ozato K, Kashiwada S: Imaging liver
development/remodeling in the see-through medaka fish.
Comp Hepatol 2004, 3(Suppl 1):S30.
48. Woolley J, Mullock B, Hinton R: Reflux of billiary components
into blood in experimental intrahepatic cholestasis induced
in rats by treatment with alpha-naphthylisothiocyanate. Clin
Chim Acta 1979, 92(3):381-386.