Báo cáo y học: "Daytime food restriction alters liver glycogen, triacylglycerols, and cell size. A histochemical, morphometric, and ultrastructural study" ppt
Bạn đang xem bản rút gọn của tài liệu. Xem và tải ngay bản đầy đủ của tài liệu tại đây (2.55 MB, 10 trang )
RESEARC H Open Access
Daytime food restriction alters liver glycogen,
triacylglycerols, and cell size. A histochemical,
morphometric, and ultrastructural study
Mauricio Díaz-Muñoz
1*
, Olivia Vázquez-Martínez
1
, Adrián Báez-Ruiz
1
, Gema Martínez-Cabrera
1
,
María V Soto-Abraham
2
, María C Ávila-Casado
2
, Jorge Larriva-Sahd
Abstract
Background: Temporal restriction of food availability entrains circadian behavioral and physiological rhythms in
mammals by resetting peripheral oscillators. This entrainment underlies the activity of a timing system, different
from the suprachiasmatic nuclei (SCN), known as the food entrainable oscillator (FEO). So far, the precise
anatomical location of the FEO is unknown. The expression of this oscillator is associated with an enhanced arousal
prior to the food presentation that is called food anticipatory activity (FAA). We have focused on the study of the
role played by the liver as a probable component of the FEO. The aim of this work was to identify metabolic and
structural adaptations in the liver during the expression of the FEO, as revealed by histochemical assessment of
hepatic glycogen and triacylglycerol contents, morphometry, and ultrastructure in rats under restricted feeding
schedules (RFS).
Results: RFS promoted a decrease in the liver/body weight ratio prior to food access, a reduction of hepatic water
content, an increase in cross-sectional area of the hepatocytes, a moderate reduction in glycogen content, and a
striking decrease in triacylglyceride levels. Although these adaptation effects were also observed when the animal
displayed FAA, they were reversed upon feeding. Mitochondria observed by electron microscopy showed a
notorious opacity in the hepatocytes from rats during FAA (11:00 h). Twenty four hour fasting rats did not show
any of the modifications observed in the animals expressing the FEO.
Conclusions: Our results demonstrate that FEO expression is associated with modified liver handling of glycogen
and triacylglycerides acco mpanied by morphometric and ultrastructural adaptations in the hepatocytes. Because
the cellular changes detected in the liver cannot be attributed to a simple alternation between feeding and fasting
conditions, they also strengthen the notion that RFS promotes a rheostatic adjustment in liver physiology during
FEO expression.
Background
From an evolutionary perspective, circadian systems
have conferred a survival advantag e by optimizing beha-
vioral and physiological adaptations to periodic events
that occur approximately each 24 h. An ultimate goal of
this adaptation is to enhance the reproductive success
and life span by allowing more effective access to nu tri-
tional resources [1,2]. The vertebrate circadian system
results f rom the coordinated action of a light-entrained
master pacemaker located in the suprachiasmatic
nucleus (SCN) of the hypothalamus, and a set of subor-
dinated c locks in peripheral organs [3] . The 24-h pro-
grams of the central and peripheral oscillators are based
on similar, but not identical, molecular transcription-
translation feedback loops [4]. The normal timing
between the principal and the peripheral clocks can be
disrupted when activity, sleep, or feeding patterns are
altered [5]. An example of this situatio n happens when
feeding is restricted to short periods of time, particularly
in experimental protocols in which food is offered dur-
ing the daytime to nocturnal rodents. In this condition,
the peripheral clocks become independent of SCN
* Correspondence:
1
Instituto de Neurobiología, Campus UNAM-UAQ, Juriquilla, Querétaro, 76001
QRO, México
Díaz-Muñoz et al. Comparative Hepatology 2010, 9:5
/>© 2010 Díaz-Muñoz et al; licensee BioMed Centra l Ltd. This is an Open Access article d istributed unde r the terms of the Creative
Commons Attribution License ( which permits unrestricted use, dist ribu tion, and
reproduction in any medium, provided the original work is properly c ited.
rhythmicity, and the circadian system is no longer
entrained by light but primarily by the effects of the
sche duling of meal-feeding [6,7]. Central to this a dapta-
tion is the expression of a food-entrainable oscillator
(FEO) that controls, next to the SCN, the 24-h rhythms
of behavioral, physiological, and metabolic activities [8].
The FEO is expressed when animals have access to
food on restricted schedules (2 to 4 h of mealtime per
day over a period of 2 or 3 weeks). The restricted feed-
ing schedule (RFS) increases locomotive activity and
arousal during the hours immediately before food
access, generating a condition known as food anticipa-
tory activity (FAA) [9]. FAA is characterized by a variety
of physiological and behavioral changes in the organism
such as: increases in wheel running activity, water con-
sumption, and body temperature, as well as a peak of
serum corticosterone [9-11]. So far, the anatomical loca-
tion of the FEO is unknown, but the physiology of this
oscillator is thought to involve the bidirectional commu-
nication between specific, energy-sensitive brain areas
and nutrien t-handling, peripheral organs, especia lly the
liver [8,9,11].
The live r is primarily composed of parenchym al cells
or hepatocytes (80% by volume) and four types of non-
parenchymal cells: endothelial, Kupffer, Ito, and pit cells.
Hepatic tissue is highly specialized and functions as a
major effector organ, ac ting as: 1) principal center of
nutrient metabolism, 2) major component of the organ -
ism defensive response, 3) control station of the endo-
crine system, and 4) blood reservoir [12]. The hepatic
gland performs a strategic role in the digestive process
by receiving the nutrients from the diet and orchestrat-
ing their transformation into useful biomolecules to be
delivered to other organs and tissues. Hence, the liver is
fundament al in the metabolism of carbo hydrates, lipids,
and all other biomolecules. Hypothalamic and midbrain
nuclei are connected via vagal and splanchnic nerves to
the liver, allowing the hepatic organ to participate in the
control of food intake by sensing and regulating the
energy status of the body [13].
FEO expression promotes dramatic changes in the
physiology and metaboli c performance of the liver
[11,14,15]: During the FAA (before food access), there is
a prevalence of oxidized cytoplasmic and mitochondrial
redox states, an increase in adenine nucleotides levels,
an enhanced mi tochondrial capacity to generate ATP,
and a hypothyroidal-like condition that is not systemic
but exclusively hepatic. In contrast, after feeding the
hepatic redox state becomes reduced in both cytoplas-
mic and mitochondrial compartments, the levels of ATP
decline, and the level of T
3
within the liver increases.
However, not all the adaptati ons in the liver during RFS
occur before and after food intake. A constant reduction
in pro-oxidant reactions (conjugated dienes and lipid
peroxides) in most hepatocyte subcellular fractions and
a persistent increase in the mitochondrial membrane
potential (ΔΨ) are observed along FEO expression
[14,16]. I n addition, the liver is the organ that displays
the fastest shift in the phase of clock-control genes a nd
molecular outputs in response to food access being
restricted to daytime in nocturnal rodents [17].
The aim of the present report was to gain further under-
standing on the structural and histochemical adaptations
underlying glycogen and triacylglycerols metabolism in the
liver during the FEO expression. Hence, we evaluated
these parameters in rats under RFS at three time points
and under two feeding conditions: 1) before, 2) during,
and 3) after the FAA. Experimental results were also com-
pared with a control group subjected to a simple 24-h per-
iod of fasting. We found that during the FAA: 1) A partial
reduction of hepatic glycogen and almost a complete dis-
appearance of triacylglycerols in comparison to the 24-h
fasted rats; 2) The water content was decreased, but at the
same time the cross-sectional area of the hepatocytes aug-
mented; 3) The hepatocyte cytoplasm displayed rounded
mitochondria bearing very electron-dense matrices and a
hypertrophy of the smooth endoplasmic reticulum.
Results
Somatometry
Table 1 shows the values of body weight reached by the
control and experimental animals. After 3 weeks, con-
trol groups fed ad libitum reached corporal weights
between 320 and 340 g, which represented an increase
of ≈ 120% over their weight at the beginning of the
experiment (≈ 150 g). No significant differences were
detected among the three times tested (08:00, 11:00, and
14:00 h). The other contro l group, the 24-h fasting rats,
Table 1 Change of body weight (BW) of rats after 3
weeks under restricted feeding schedules.
Treatment Initial BW (g) Final BW (g) Δ BW (%)
Food ad libitum
08:00 h 151 ± 3 320 ± 21 169 (112%)
11:00 h 150 ± 2 329 ± 26 179 (119%)
14:00 h 153 ± 2 337 ± 31 184 (120%)
Food restricted schedule
08:00 h 150 ± 2 182 ± 17* 32 (21%)*
11:00 h 151 ± 3 192 ± 20* 41 (27%)*
14:00 h 149 ± 1 246 ± 23*
+
97 (65%)*
+
24 h Fasting
11:00 h 321 ± 4 298 ± 3 -23 (-7%)
Values are means ± SE for 6 independent observations. Male Wistar rats were
under food restriction for three weeks. Food access from 12:00 to 14:00 h.
Control groups included rats fed ad libitum and rats fasted for 24 h. Results
are expressed as mean ± SEM of 6 independent determinations. Significant
difference between RFS and ad-libitum groups (*), within the same
experimental group (+), and different from 24-h fasting group (x). Differences
derived from to Tukey’s post hoc test (a = 0.05).
Díaz-Muñoz et al. Comparative Hepatology 2010, 9:5
/>Page 2 of 10
showed a moderate diminution in body weight of 10%.
In contrast, rats under RFS showed significantly l ower
body weights, 180-195 g before feeding (08:00 and 11:00
h) and 242-251 g after feeding (14:00 h). Considering
the initial weight of ≈ 150 g, the values corresponded to
an increase in corporal weight of ≈ 25% before feeding
and ≈ 64% after feeding. These data indicate that the
rats under RFS show a daily oscillation of approximately
one third of their weight due to the marked hyperphagia
displayed and the water drunk in the 2-h period when
they have access to food. The results of body weights
clearly show that the animals under RFS were smaller
than control rats fed ad libitu m, but at the same time,
they also indicate that our experimental protocol did
allow a slight growth in the RFS rats.
Table 2 shows the change s in the liver weight and the
ratio liver/body weight reached by the control and
experimental animals. The liver weight showed no sig-
nificant variation among the 3 control groups of rats fed
ad libit um, and the value of the ratio liver/body weight
(4.2 ± 0 .1) was in the range reported previously [18].
Fasting for 24 h decreased the liver weight by ≈ 30%,
making the ratio liver/body weight (3.2 ± 0.1) smaller
than those obtained in rats fed ad libitum. This effect
had been already reported [19]. The liver weights in the
RFS groups were significantly lower at the 3 times stu-
died: Before feeding (08:00 and 11:00 h) the value corre-
sponded to a decrease of ≈ 55%incomparisonwiththe
ad-libitum fed group; after feeding (14:00 h) the reduc-
tion in the liver weight was ≈ 41%. At the 3 times stu-
died, and independently of the food intake, the ratio
liver/body weight in the rats under RFS was lower than
in the groups fed ad libitum,andsimilartothe24-h
fasted group (3.1 ± 0.1). These data imply that RFS pro-
motes a sharper drop in liver weight than in body
weight, similar to the effect on 24-h fasted rats. Interest-
ingly, after 2 h feeding, rats under RFS showed an
increase of ≈ 30% in the weight of liver and body (com-
paring groups at 11:00 and 14:00 h).
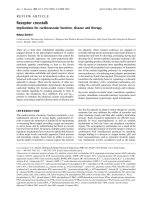
Liver water content (LWC)
The percentage of water in hepatic tissue varies according
to circadian patterns and as a function of food availability
[20,21]. LWC was quantified by weighting the dried out
tissue (Figure 1). The values obtained for the control and
most of the experimental groups varied in a narrow
range ( 68-72%), which matches the LWC reported pre-
viously[21].Theonlygroupthatshowedasignificant
change was the RFS rats prior to food presentation
(11:00 h), and hence, displaying the FAA. The livers of
these rats had a water content of only 56%, a 20%
decrease compared to the a d-libitum fed control, the
24-h fasted rats, and the other two groups of rats under
RFS (08:00 and 14:00 h). As reported previously for other
parameters, this result suggests that the liver response
during fasting associated with RFS is qualitatively differ-
ent from that during a single fasting period of 24 h.
Table 2 Liver weigth (LW) and ratio LW/body weight of
rats under food restricted schedules.
Treatment LW (g) LW/BW × 100
Food ad libitum
08:00 h 13.5 ± 0.8 4.2 ± 0.2
11:00 h 13.8 ± 0.6
×
4.1 ± 0.3
×
14:00 h 14.7 ± 0.9 4.3 ± 0.1
Food restricted schedule
08:00 h 6.5 ± 0.2* 3.6 ± 0.3*
11:00 h 6.1 ± 0.3* 3.2 ± 0.2*
14:00 h 8.2 ± 0.4* 3.3 ± 0.2*
24 h Fasting
11:00 h 9.7 ± 0.3 3.2 ± 0.3
Values are means ± SE for 6 independent observations. Male Wistar rats were
under food restriction for three weeks. Food access from 12:00 to 14:00 h.
Control groups included rats fed ad-libitum and rats fasted for 24 h. Results
are expressed as mean ± SEM of 6 independent determinations. Significant
difference between RFS and ad-libitum groups (*), and different from 24-h
fasting group (x). Differences derived from Tukey’s post hoc test (a = 0.05).
BW = body weight.
Figure 1 Water content in the liver of rats exposed to a
restricted feeding schedule for 3 weeks (food intake from
12:00 to 14:00 h). Experimental group, black box; ad-libitum fed
control group, white box; 24-h fasting control group, hatched and
gray box. Data were collected before (08:00 h), during (11:00 h), and
after food anticipatory activity (14:00 h). Control group with 24-h
fasting was processed at 11:00 h. Results are expressed as mean ±
SEM of 6 independent determinations. Significant difference
between food-restricted and ad-libitum fed groups [*], within the
same experimental group at different times [+], and different from
24-h fasting group [×]. Differences derived from Tukey’s post hoc
test (a = 0.05).
Díaz-Muñoz et al. Comparative Hepatology 2010, 9:5
/>Page 3 of 10
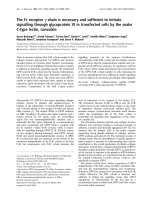
Hepatocyte morphometry
It has been shown that dietary state influences the hepa-
tocyte dimensions [22]. Histological preparation and
morphometric examination of hepatic tissue demon-
strated striking chang es in the c ross-sectional area (as a
proxy of cell 3D size) of liver cells between control rats
fed ad libitum and rats under RFS (Figures 2 and 3).
Only hepatocytes displaying a distinct nucleus and at
least one nucleolus were included in the morphometric
analysis. Rats fed ad libitum showed a significant
enhancement in hepatocyte size at 08:00 h (at the end
of the feeding perio d): the increases in surface area was
≈ 100% in comparison to the groups fed ad libitum at
11:00 and 14:00 h (Figure 2, panels A, C, and E). The
group with 24-h of fasting showed no variation in the
size of their liver cells compared to the ad-libitum fed
counterpart (at 11:00 h) (Figure 2, pan els C a nd G).
Food restriction also promoted obvious modification s in
hepatocyte morphometry: Coincident with the FAA, at
11:00 h, hepatocytes cross-sectional area increased ≈
53% in relation to the RFS groups before (08:00 h) and
after the FAA (14:00 h) (Figure 2, panels B, D, and F).
The increased size of the hepatocyte during F AA was
also statistically significant when compared to the 24-h
fasted rats at 11:00 h (Figure 2, panels D and G). In
contrast to the group fed ad libitum that showed larger
hepatocytes after mealtime (at 08:00 h), the liver cells of
the rats expressing the FEO were larger b efore food
intake (at 11:00 h).
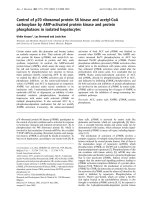
Liver glycogen
The presence of glycogen in the cytoplasm of hepato-
cytes was detected and quantified using the periodic
acid-Schiff (PAS) staining (Figures 4 and 5). Glycogen
staining intensity remained mostly constant in the
groups of rats fed ad libitum (Figure 4, panels A, C, and
E, and Figure 5), with a slight tendency for glycogen
levels to decline in the rats at 14:00 h (Figure 5). The
group with 24-h fasting showed a dramatic reduction (≈
82%) in the glycogen content (Figure 4 , panel G, and
Figure 5). Rats under RFS showed a significant but
Figure 2 Toluidine blue-stained histological sections of livers of
rats exposed to a restricted feeding schedule for 3 weeks (food
intake from 12:00 to 14:00 h). Tissue samples from food-restricted
and ad-libitum fed rats were collected before (08:00 h), during (11:00
h), and after food anticipatory activity (14:00 h). The control group
with 24-h fasting was processed at 11:00 h. Panels A, C, and E,
control ad-libitum fed groups; panels B, D, and F, food-restricted
groups; panel G, 24-h fasted group. Images in panels A and B were
taken at 08:00 h, in panels C, D and G at 11:00 h, and E and F at
14:00 h.
Figure 3 Quantification of the hepatocytes’ cross-sectional area
of rats exposed to a restricted feeding schedule for 3 weeks
(food intake from 12:00 to 14:00 h). Data are derived from
evaluation of the hepatocyte morphology (Figure 2). RFS group,
black box; ad-libitum-fed control group, white box; 24-h-fasting
control group, hatched and gray box. Results are expressed as mean
± SEM of 6 independent determinations. Significant difference
between food restricted and ad-libitum fed groups [*], within the
same experimental group [+], and different from 24-h fasting group
[×]. Differences derived from Tukey’s post hoc test (a = 0.05).
Díaz-Muñoz et al. Comparative Hepatology 2010, 9:5
/>Page 4 of 10
smaller decrease in liver glycogen (≈ 30%) during the
FAA ( at 11:00 h). I ndeed, the reduction in glycogen in
the rats expressing the FEO was less than that shown by
the 24-h fasted rats, even though both groups had a
similar period of fasting (Figure 4, panels D and G, and
Figure 5). After food ingestion (at 14:00 h), hepatic gly-
cogen in RFS rats reverted to normal levels.
Liver triacylglycerols
Neutral hepatic lipids, mainly triacyl glycerols, were
detected and quantified in frozen liver sections using
the oil red O (ORO) stain (Figures 6 and 7). Similar to
the results of hepatic glycogen, triacylglycerols did not
change in the livers of the group s fed ad libitum
(Figure 6, panels A, C, and E, and Figure 7). Only an
increasing trend was observed in the staining signal in
the group at 14:00 h (Figure 7). In contrast to the glyco-
gen r esults, 24 h of fasting did not modify the hepatic
triacylglycerol levels (Figure 6, panel G). Remarkably,
the rats under RFS presented much lower triacylglycerol
values before food access (08:00 and 11:0 0 h, Figure 6,
panels B and D, and F igure 7). At both times the
diminution was very significant (≈ 70%) in relation to
their ad- libitum fed controls and to the rats with 24-h
fasting. After feeding (at 14:00 h), the triacylglycerol
content in the food-restricted rats returned to the con-
trol levels (Figure 6, panel F and Figure 7). Thi s result
supports the notion that an altered processing of lipids
in liver, adipose tissue, and transport in blood ( high
levels of circulating free fatty acid and ketone bodies
during the FAA) is established during t he FEO expres-
sion [10].
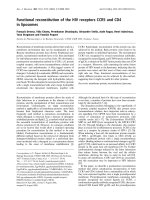
Hepatocyte ultrastructure
Electron microscopic analysis was performed in samples
from rats sacrificed at 11:00 h, including: 1) control rats
fed ad libitum, 2) rats under RSF and displaying the
FAA, and 3) control rats with a simple 24-h period of
fasting. Figure 8 shows ultrastructural features of hepa-
tocytes from rats subjected to these treatments at low
Figure 4 Periodic-acid Schiff (PAS) stained histological sections
of livers of rats exposed to a restricted feeding schedule for 3
weeks (food intake from 12:00 to 14:00 h). Pink color indicates
the presence of hepatic glycogen. Tissue samples from food-
restricted and ad-libitum fed rats were collected before (08:00 h),
during (11:00 h), and after food anticipatory activity (14:00 h). The
control group with 24-h fasting was processed at 11:00 h. Panels A,
C, and E, control ad-libitum fed groups; panels B, D, and F, food-
restricted groups; panel G, 24-h fasted group. Images in panels A
and B were taken at 08:00 h, in panels C, D and G at 11:00 h, and E
and F at 14:00 h.
Figure 5 Quantification of the hepatocytes’ glycogen content
of rats exposed to a restricted feeding schedule for 3 weeks
(food intake from 12:00 to 14:00 h). Data are derived from
evaluation of the liver PAS staining from Figure 4. RFS group, black
box; ad-libitum-fed control group, white box; 24-h-fasting control
group, hatched and gray box. Results are expressed as mean ± SEM
of 6 independent determinations. Significant difference between
food restricted and ad-libitum fed groups [*], within the same
experimental group [+], and different from 24-h fasting group [×].
Differences derived from Tukey’s post hoc test (a = 0.05).
Díaz-Muñoz et al. Comparative Hepatology 2010, 9:5
/>Page 5 of 10
(panels A, B, an d C) and high (panels D, E, and F) mag-
nification. Hepatocytes from rats fed ad libitum
contained numerous mitochondria, well-defined endo-
plasmic reticulum and nucleus, as well as abundant gly-
cogen deposits in the form of electron-dense material
(panels A and D). All glycogen aggregates disappeared
after 24 h of fasting, with no further a lteration in the
structure of the other organelles (Panel B and E). In
contrast, hepatocytes from rats during the FAA showed
remarkable changes, including an increased opacity that
made the cristae difficult to distinguish. Some glycogen
was a lso observed in these hepatocytes, supporting the
result obtained with the PAS stain (panels C and F).
Discussion
The liver is the principal organ that processes nutrients
and delivers metabolites to peripheral tissues and
organs; hence, it pl ays a key role in regulating the
energy balance of vertebrates and thereby is fundamen-
tal in the physiological control of the hunger-satiety
cycle [23]. Because feeding determines the individual
viability, the timing of the underlying internal metabolic
and cellular mechanisms to find and ingest food is prop-
erly regulated by circadian systems [24]. In consequence,
a variety of liver functions related to the handling of
nutrients are targets of circadian control [25]. For these
reasons, the hepatic involvement has been considered as
an important constituent of the FEO [8,11,17]. Indeed,
the FEO expression also depend s on the nutritiona l
properties and the caloric c ontent of the meal offered
during the RFS [26].
Many of the adaptations in the biochemical responses
of the liver before and after feeding during the FEO
expression are unique, and do not correspond to the
characteristics shown in either control group: fed ad
libitum or 24-h fasting [10,11,14 -16]. Taken together,
the data strongly suggest that FEO physiology is asso-
ciated with a new rheostatic equilibrium in the func-
tional and structural properties of the liver that adapt to
Figure 6 Oil red O (ORO)-stained histological sections of livers
of rats exposed to a restricted feeding schedule for 3 weeks
(food intake from 12:00 to 14:00 h). Intense red color indicates
the presence of neutral lipids, mainly triacylglycerols. Tissue samples
from food restricted and ad-libitum fed rats were collected before
(08:00 h), during (11:00 h), and after food anticipatory activity (14:00
h). Control group with 24-h fasting was processed at 11:00 h. Panels
A, C, and E, control ad-libitum fed groups; panels B, D, and F, food-
restricted groups; panel G, 24-h fasted group. Images in panels A
and B were taken at 08:00 h, in panels C, D and G at 11:00 h, and E
and F at 14:00 h.
Figure 7 Quantification of the hepatocytes’ triacylglycerols
content of rats exposed to a restricted feeding schedule for 3
weeks (food intake from 12:00 to 14:00 h). Data are derived
from evaluation of the liver oil red O staining from Figure 6. RFS
group, black box; ad-libitum-fed control group, white box; 24-h-
fasting control group, hatched and gray box. Results are expressed
as mean ± SEM of 6 independent determinations. Significant
difference between food restricted and ad-libitum fed groups [*],
within the same experimental group [+], and different from 24-h
fasting group [×]. Differences derived from Tukey’s post hoc test
(a = 0.05).
Díaz-Muñoz et al. Comparative Hepatology 2010, 9:5
/>Page 6 of 10
optimizing the handling of nutrients under the RSF sta-
tus [11,15,27].
The liver exhibits daily fluctuations in structural and
metabolic features, u sually associated with the intake
and processing of nutrients from the diet. This oscilla-
tory pattern involves daily adjustments in the hepatocyte
function to achieve a suitable assimilation of food , and
then a correct processing of nutrients [28]. RFS lea ds to
a striking hyperphagia that result in the ingestion of ≈
30 g of food during the mealtime. By the time the sto-
mach is almost empty, the FAA begins [29]. It has been
repo rted that, following the rhythm of gastric emptying,
the weight of the liver shows a clear circadian rhythm
with a peak at 08:00 h [20,30]. Although our r esults did
not show differences in the liver weight in the control
groups fed ad libitum (Table 1), the hepatocy tes cross-
sectional area was notably bigger at 08:00 h (Figure 2
and Figure 3), suggesting an increase in cell size. Inter-
esti ngly, the ratio liver weight/bo dy weight was lower at
all three times tested in the rats expressing the FEO and
similar to the value for the rats fasted 24 h (Table 2),
indicating that under RFS, the changes in corporal and
liver weights are proportional, before and after feeding.
In contrast, in the 24-h fasted group there was a more
pronounce reduction in the liver weight, confirming
data previously reported [30].
Tongiani et al., have reported a circadian rhythm for
the water content in rat hepatocytes with a peak during
the night, being the rhythm mainly regulated by the
light-dark regimen and not by the time of food access
[21]. In our RFS p rotocol, the only significant variation
detected was lower water content during the FAA (at
11:00h)(Figure1).Atthistime,thereisintensemeta-
bolic activity in the liver characterized by increased
mitochondrial respiration, an enhanced ATP synthesis,
and a switch from a carbohydrate- to a lipid-based
metabolism [10,11,14,31]. We do not know the cellular
constituent responsible for the increase in the hepatic
dry mass during FAA, but we can rule out glycogen, tria-
cylglycer ols and protein content since the first two were
present at lower levels during the FAA (Figures 5 and 7),
and the letter did not show significant changes [14]. It is
noteworthy that at this time (11:00 h), the h epatocyte
cross-sectional area was larger in the RFS group (Figure 2
and Figure 3). Hence, during the FAA, and in preparation
for receiving and processing the nutrients from the 2-h
food consumption, the liver hepatocytes become most
likely larger and contain less water.
No circadian rhythmicity has been detected for the
hepatic content of gly cogen and triac ylglycerols, since
these two parameters respond exclusively to food intake
and the elapsed time in fasting [10,30,31]. RFS groups
before food access (08:00 and 11:00 h) showed just a
moderate diminution in hepatic glycogen, but a severe
reduction in the content o f triacylglycerols (Figures 4
and 5). A possible explanation for the smaller decrease
in glycogen is the long time required for the stomach to
empty (≈ 20-21 h) in this group. As to the lower level of
Figure 8 Electron micrographs illustrating liver cells from control (A and D) fasten (B and D) and fed restricted (C and E) rats. Notice
that hepatocytes from the fed restricted animal (F) exhibit electron-dense mitochondria (m) surrounded by abundant smooth endoplasmic
reticulum (SER). N = cell nucleus, gl = glycogen, asterisks = lipid droplets, arrows = bile canaliculi. Lead-uranium staining. Scale bars = 2 μmin
A-C; 0.2 μm in D-E. Representative images of 6 independent experimental observations.
Díaz-Muñoz et al. Comparative Hepatology 2010, 9:5
/>Page 7 of 10
triacylglycerols, experimental evidence shows that in the
time prec eding food access (11:00 h), the liver is actively
metabolizing lipids, as supported by the high level of
circulating free fatty acids and ketone bodies, as well as
by the expression of lipid-oxidizing peroxysomal and
mitochondrial enzymes detected by microarray assays
[10,32]. One possibility is that the energy needed for the
liver metabolic activity before food access is obtained by
consuming the mobilized lipids from the adipose tissue.
(In support of this possibility, unpublished results from
our laboratory suggest that lipid- mobilizing factors
such as PPARa and g are increased in the liver during
the FAA.)
Uhal and Roehrig reported that the dietary state influ-
ences the hepatocyte size and volume: 48 h of fasting
resulted in a two-fold reduction in hepatocyte size and
its protein content, whereas refeeding promoted a 70-
80% [22]. Our results reproduced the difference in
cross-sectional area between the hepatocytes from ad-
libitum fed and 24-h fasting rats ( Figure 2), but no dif-
ference in protein content was detected [14], perhaps
because our protocol involved only 24 of fasting. It is
noteworthy that the liver cells increased the cross-sec-
tional area during the FAA (11:00 h). This larger size is
not linked to a net hepatic biosynth etic activation in the
rats displaying FAA, since there is a concurrent drop in
the water content of the liver (Figure 1) without changes
in protein content [14].
Finally, our electron microscopic observ ations support
and expand the early notion that the hepatocyte struc-
ture also fluctuates in circadian and daily rhythms [33].
Conclusion
We conclude that uncoupling the rat liver circadian
activity from the SCN rhythmicity by imposing a feeding
time restricted to daylight induces adaptations in the
size, ultrastructure, as well as glycogen and triacylglycer-
ols content in hepatocytes. Moreover, the main adapta-
tions caused by the RFS occurred during the FAA, and
could be accounted for as a “cellular and metabolic
anticipation” by the liver in preparation for processing
more efficiently the ingested nutrients. Finally, the
unique characteristics of the hepatic response during
RFS, which was different from the responses of the ad-
libitu m fed and 24-h control groups, support the notion
of a new rheostatic state in the liver during FEO
expression.
Methods
Animals and housing
Adult male Wistar rats weighing ≈ 150 g at the begin-
ning of the exp eriment were maintained on a 12:12 h
light-dark cycle (lights on at 08:00 h) at constant tem-
perat ure (22 ± 1°C). The light intens ity at the surface of
the cages averaged 350 lux. Animals were kept in groups
of five in transparent acrylic cages (40 × 50 × 20 cm)
with free access to water and food unless stated other-
wise. All experimental procedures were approved and
conducted according to the institutional guide for care
and use of animals under biomedical experimentation
(Universidad Nacional Autónoma de México).
Experimental design
The experimental procedure reported by Davidson and
Stephan [34] was followed with some modifications
(Figure 9) [14,15]. Rats were randomly assigned to one
of three experimental groups: 1) control rats fed ad libi-
tum, 2) rats exposed to a restricted feeding schedule
(RFS group) with food presented daily from 12:00 to
14:00 h for three weeks, or 3) control rats with a fast of
24 h. To obtain liver samples, rats from groups 1 (fed
ad-libitum) and 2 (RFS) were randomly sacr ificed at
08:00 h (before FAA), 11:00 h (during FAA), and 14:00
h (after feeding and without FAA). Rats fasted 24 h
were killed, and their liver samples removed at 11:00 h.
Each experimental group contained 6 rats.
Liver sampling
Each animal was deeply anesthetized with Anestesal®
(sodiumpentobarbital)atadoseof1mlper2.5kgof
Figure 9 Time of treatment, feeding conditions, times of sampling and light - darkness cycle used in the experimental protocol. RFS =
restricted feeding schedule.
Díaz-Muñoz et al. Comparative Hepatology 2010, 9:5
/>Page 8 of 10
body weight. In one set of experiments the r ats were
killed by decapitation, and their livers removed and
weighed. A fragment (0.3 - 0.5 g) was weighed, then
kept at ≈ 65°C for one week and weighed again; the
initial water content was calculated as the difference
between the initial and final weights. In a dif ferent set
of experiments, small sections of each liver were rapidly
removed and cut into pieces of about 1 mm
3
with sharp
razors to be fixed for morphometric measurements and
histochemical techniques or processed for electron
microscopy.
Morphometry
Small tissues blocks (≈ 1mm
3
) for each rat, 6 per group,
were immediately fixed in a cold solution of 2.5% glutar-
aldehyde diluted in 0.15 M cacodylate buffer, pH 7.3.
After 60 min, tissues were postfixed for 1 h in 1%
osmium tretroxide dissolved in the same buffer. Then,
liver f ragments were dehydrated in graded acetone dis-
solved in dei onized water and embedded in epoxy resin.
One-micron thick semi-thin sections were obtained by a
Leica ultramicrotome equipped with glass knives and
stained with toluidine blue. Observations were done in a
Nikon Eclipse E600 microscope, and images were
obtained with a digital camara Pho tometrics Co ol
SNAP. Hepatocytes with a single, clear nucleus were
selected, and their surfaces were measured with the pro-
gram IPLab V 3.6 for cross-sectional area determination.
Histochemical techniques
For glycogen staining, liver fragments (6 rats for each
experimental group) were immediately place d and kept
48 h in a fixative (freshly prepared 10% w/v formalde-
hyde in 0.1 M phosphat e buffer, pH 7.2), embedded in
paraffin, sectioned at 5-μm thickne ss, and assessed to
detect the content of glycogen within the hepatocytes
by the periodic acid-Schiff reaction, with diastase addi-
tion for non-specific staining (PAS/D). In this m ethod
periodate oxidizes the hydroxyl moieties of glucose
residues to aldehydes, which in turn react with the
Schiff reagent generating a purple-magenta color. Ten
representative fields from at least 4 different liver frag-
ments per rat were analyzed by light microscopy
(Olympus BX51; Olympus American, Melville, NY)
and captured with a digital video camera (Cool Snap
Pro, Media Cybernetics, Silver Spring, MD) . Each dig i-
tal image was photographed with the ×10 objective
and formatted at fixed pixel density (8 × 10 inches at
150 dpi) using Adobe Photoshop software (v. 5.5).
Each digital image was then analyzed using the Meta-
Morph Imaging Processing and Analysis software (v.
4.6) for histomorphometric analysis. Glycogen signal
was expressed as a p ercentage of total tissue area. The
areaoftotaltissueandtheareapositivelystainedfor
glycogen were calculated in terms of pixels by a co-
localization function of the MetaMorph program.
Background staining was calculated from slices treated
with diastase.
To stain lipids within the hepatocytes, the liver frag-
men ts (6 rats for each experimental group) were imme-
diatelyfrozeninsolidCO
2
,andthetissuewas
processed according to the oilredO(ORO)technique.
This dye acts not by dissolution but by an adsorption
process t hat gives an intense red stain with fatty acids,
cholesterol, triacylglycerols, and unsaturated fats. The
quantification of the signal was similar to the one
reported in the previous paragraph for glycogen, with
the exception that the images were photographed with
the ×40 objective.
Electron microscopy
Liver tissue samples for each rat, 6 per group, were
obtained during the laparatomy and cut into about one-
millimeter thick blocks, immersed in Karnovsky’s fixative
(4% paraformaldehyde-2.5% glutaraldehyde in 0.15 M
phosphate buffer, pH 7.3) for one hour, w ashed in the
same buffer and stored overnight at 4°C. The next day
tissues was postfixed for 1 h in 1% osmium tetraoxide
dissolved in the phosphate buffer (vide supra), dehydrated
in gra ded ethyl-alcohols, and embedded in epoxy resin.
One-micrometer-thick sections were obtained from the
tissue blocks in a Leica ultramicrotome equipped with
glass knives. The sections were s tained with toluidine
blue and coverslipped. From the surface of these trimmed
blocks, ultrathin sections ranging from 80 to 90 nm were
obtained with a diamond knife and mounted in single-
slot grids that had previously been covered with formvar
film. The sections were double stained with aqueous
solutions of uranium acetate and lead citrate and
observed in a JEOL 1010 electron microscope.
Data analysis
Data were classified by group and time and reported as
mean ± SEM. Data from ad-libitum and food- restricted
groups were compared with a two-way ANOVA f or
independent measures with a factor for group (2 levels)
and a factor for time (6 levels). One-way ANOVA was
used to determine significant oscillations in the tem-
poral pattern (6 levels) in each group. All ANOVAs
were followed by a Tukey post hoc test wi th the thresh-
old for significant values set at p < 0.05. Values from
the fast ed rats we re compared with those from the
group of rats fed ad libitum and the rats with restricted
feeding sacrificed at 11:00 h, using a one-way ANOVA
Díaz-Muñoz et al. Comparative Hepatology 2010, 9:5
/>Page 9 of 10
for independent measures. Statistical analysis was per-
formed with Statisca version 4.5 (StatSoft, 1993).
Acknowledgements
We thank MVZ José Martín García Servín, Ing. Leopoldo González Santos, Lic.
Leonor Casanova, and Omar González for their technical assistance. The
English version of this text was kindly reviewed by Dr. Dorothy Pless.
Research supported by DGAPA IN201807 and CONACYT U49047 to MD-M.
Author details
1
Instituto de Neurobiología, Campus UNAM-UAQ, Juriquilla, Querétaro, 76001
QRO, México.
2
Instituto Nacional de Cardiología, Juan Badiano #1, Ciudad de
México, 14080, DF, México.
Authors’ contributions
MD-M conceived the study, participated in designing the project and
drafting the manuscript. OV-M carried out the histological techniques,
participated in organizing and analyzing the experimental data, and
assembled the figures. AB-R did the initial liver sampling, participated in the
histological processing and drafting the manuscript. GM-C participated in
the morphometric studies. MVS-A participated in measuring the glycogen
and triacylglycerol levels. MCA-C participated in measuring the glycogen and
triacylglycerol levels. JL-S participated in designing the project and drafting
the manuscript. All authors have read and approved the final article.
Competing interests
The authors declare that they have no competing interests.
Received: 4 May 2009
Accepted: 23 February 2010 Published: 23 February 2010
References
1. Nelson W, Halberg F: Meal-timing, circadian rhythms and life span of
mice. J Nutr 1986, 116:2244-2253.
2. Foster RG, Wulff K: The rhythm of rest and excess. Nat Rev Neurosci 2005,
6:407-414.
3. Reppert SM, Weaver DR: Coordination of circadian timing in mammals.
Nature 2002, 418:935-941.
4. Yamazaki S, Numano R, Abe M, Hida A, Takahashi R, Ueda M, Block G,
Sakaki Y, Menaker M, Tei H: Resseting central and peripheral circadian
oscillators in transgenic rats. Science 2000, 288:682-685.
5. Hastings MH, Reddy AB, Maywood ES: A clockwork web: circadian timing
in brain and periphery, in health and disease. Nat Rev Neurosci 2003,
4:649-661.
6. Philippens KM, Von Mayersbach H, Scheving LE: Effects of the scheduling
of meal-feeding at different phases of the circadian system in rats. J
Nutr 1977, 107:176-193.
7. Damiola F, Le Minh N, Preitner N, Kornmann B, Fleury-Olela F, Schibler U:
Restricted feeding uncouples circadian oscillators in peripheral tissue
from the central pacemaker in the suprachiasmatic nucleus. Genes Dev
2000, 14:2950-2961.
8. Stephan FK: The “other” circadian system: food as a zeitgeber. J Biol
Rhythms 2002, 17:284-292.
9. Mistlberger RE: Circadian food anticipatory activity: formal models and
physiological mechanisms. Neurosci Biobehav Rev 1994, 18:171-195.
10. Escobar C, Díaz-Muñoz M, Encinas F, Aguilar-Roblero R: Persistence of
metabolic rhythmicity during fasting and its entrainment by restricted
feeding schedules in rats. Am J Physiol Regulatory Integrative Comp Physiol
1998, 43:R1309-R1316.
11. Díaz-Muñoz M, Vázquez-Martínez O, Aguilar-Roblero R, Escobar C:
Anticipatory changes in liver metabolism and entrainment of insulin,
glucagon, and corticosterone in food-restricted rats. Am J Physiol
Regulatory Integrative Comp Physiol 2000, 279:R2048-R2056.
12. Kietzmann T, Jungermann K: Metabolic zonation of liver parenchyma and
its short-term and long-term regulation. Functional Heterogeneity of Liver
Tissue Landes CompanyVidal-Vanaclocha F 1997, 1-42.
13. Pocai A, Obici S, Schwartz GJ, Rosseti L: A brain-liver circuit regulates
glucose homeostasis. Cell Metab 2005, 1:53-61.
14. Báez-Ruiz A, Escobar C, Aguilar-Roblero R, Vázquez-Martínez O, Díaz-
Muñoz M: Metabolic adaptation of liver mitochondria during restricted
feeding schedules. Am J Physiol Gastrointest Liver Physiol 2006, 289:
G1015-G1023.
15. Aceves C, Escobar C, Rojas-Huidobro R, Vázquez-Martínez O, Martínez-
Merlos T, Aguilar-Roblero R, Díaz-Muñoz M: Liver 5’-deiodinase activity is
modified in rats under restricted feeding schedules: evidence for post-
translational regulation. J Endocrinol 2003, 179:91-96.
16. Luna-Moreno D, Vázquez-Martínez O, Báez-Ruiz A, Ramírez J, Díaz-Muñoz M:
Food restricted schedules promote differential lipoperoxidative activity
in rat hepatic subcellular fractions. Comp Biochem Physiol A Mol Integr
Physiol 2007, 146:632-643.
17. Stokkan KA, Yamazaki S, Tei H, Sakaki Y, Menaker M: Entrainment of the
circadian clock in the liver by feeding. Science 2001, 291:490-493.
18. Gutiérrez-Salinas J, Miranda-Garduño L, Trejo-Izquierdo E, Díaz-Muñoz M,
Vidrio S, Morales-González JA, Hernández-Muñoz R: Redox state and
energy metabolism during liver regeneration. Alterations produced by
acute etanol administration. Biochem Pharmacol 1999, 58:1831-1839.
19. Hernández-Muñoz R, Díaz-Muñoz M, Chagoya de Sánchez V: Effects of
adenosine administration on the function and membrane composition
of liver mitochondria in carbon tetrachloride-induced cirrhosis. Arch
Biochem Biophys 1992, 294:160-167.
20. Ostrowski S, Mesochina P, Williams JB: Physiological adjustments of sand
gazelles (Gazella subgutturosa) to a boom-or-bust economy: standard
fasting metabolic rate, total evaporative water loss, and changes in the
sizes of organs during food and water restriction. Physiol Biochem Zool
2006, 79:810-819.
21. Tongiani R, Chieli E, Malvaldi G: Circadian rhythm of dry mass and
weight-class-pattern of the rat hepatocytes. Effects of light-dark and
feeding regimens. Acta Histochem 1982, 70:78-88.
22. Uhal BD, Roehrig KL: Effect of dietary state on hepatocyte size. Biosci Rep
1982, 2:1003-1007.
23. Russek M: Participation of hepatic glucoreceptors in the control of intake
of food. Nature 1963, 197:79-80.
24. Langmesser S, Albretch U: Life time -Circadian clocks, mitochondria and
metabolism. Chronobiol Int 2006, 23:151-157.
25. Hogenesch JB, Panda S, Kay S, Takahashi JS: Circadian transcriptional
output in the SCN and liver of the mouse. Novartis Found Symp 2003,
253:171-180.
26. Stephan FK, Davidson AJ: Glucose, but not fat, phase shifts the feeding-
entrained circadian clock. Physiol Behav 1998, 65:277-288.
27. Buiatti M, Buiatti M: The living state of matter. Riv Biol 2001, 94:59-82.
28. Davidson AJ, Castañon-Cervantes O, Stephan KF:
Daily oscillations in liver
function: diurnal vs circadian rhythmicity. Liver Int 2004, 24:179-186.
29. Martínez-Merlos T, Ángeles-Castellanos M, Díaz-Muñoz M, Aguilar-Roblero R,
Escobar C: Dissociation between adipose tissue signals, behavior and the
food entrained oscillator. J Endocrinol 2004, 181:53-63.
30. Kast A, Nishikawa J, Yabe T, Nanri H, Albert H: Circadian rhythm of liver
parameters (cellular structures, mitotic activity, glycogen and lipids in
liver and serum) during three consecutive cycles in phenobarbital-
treated rats. Chronobiol Int 1988, 5:363-385.
31. Robins SJ, Fasulo JM, Pritzker CR, Ordovas JM, Patton GM: Diurnal changes
and adaptation by the liver of hamsters to an atherogenic diet. Am J
Physiol 1995, 269:1327-1332.
32. Báez-Ruiz A, Luna-Moreno D, Vázquez-Martínez O, Ramírez-Salcedo J, Díaz-
Muñoz M: The food entrainable oscillator studied by DNA microarrays:
What is the liver doing during food anticipatory activity?. Biol Rhythm Res
2005, 36:83-97.
33. Uchiyama Y, Asari A: A morphometric study of the variations in
subcellular structures of rat hepatocytes during 24 hours. Cell Tissue Res
1984, 236:305-315.
34. Davidson AJ, Stephan FK: Plasma glucagon, glucose, insulin and motilin
in rats anticipating daily meals. Physiol Behav 1999, 66:309-215.
doi:10.1186/1476-5926-9-5
Cite this article as: Díaz-Muñoz et al.: Daytime food restriction alters
liver glycogen, triacylglycerols, and cell size. A histochemical,
morphometric, and ultrastructural study. Comparative Hepatology 2010
9:5.
Díaz-Muñoz et al. Comparative Hepatology 2010, 9:5
/>Page 10 of 10