Báo cáo y học: "Costs of stroke and stroke services: Determinants of patient costs and a comparison of costs of regular care and care organised in stroke service" ppt
Bạn đang xem bản rút gọn của tài liệu. Xem và tải ngay bản đầy đủ của tài liệu tại đây (306.8 KB, 11 trang )
BioMed Central
Page 1 of 11
(page number not for citation purposes)
Cost Effectiveness and Resource
Allocation
Open Access
Research
Costs of stroke and stroke services: Determinants of patient
costs and a comparison of costs of regular care and care organised
in stroke services
Job van Exel*
1,2
, Marc A Koopmanschap
1,2
, Jeroen DH van Wijngaarden
2
and Wilma JM Scholte op Reimer
3
Address:
1
Institute for Medical Technology Assessment (iMTA), Erasmus MC, Rotterdam, The Netherlands,
2
Department of Health Policy and
Management (iBMG), Erasmus MC, Rotterdam, The Netherlands and
3
Department of Cardiology, Erasmus MC, Rotterdam, The Netherlands
Email: Job van Exel* - ; Marc A Koopmanschap - ; Jeroen DH van
Wijngaarden - ; Wilma JM Scholte op Reimer -
* Corresponding author
Abstract
Background: Stroke is a major cause of death and long-term disability in Western societies and
constitutes a major claim on health care budgets. Organising stroke care in a stroke service has
recently been demonstrated to result in better health effects for patients. This paper discusses
patient costs after stroke and compares costs between regular and stroke service care.
Methods: Costs were calculated within the framework of the evaluation of three experiments
with stroke services in the Netherlands. Cost calculations are base on medical consumption data
and actual costs.
Results: 598 patients were consecutively admitted to hospital after stroke. The average total costs
of care per patient for the 6 month follow-up are estimated at €16,000. Costs are dominated by
institutional and accommodation costs. Patients who die after stroke incur less costs. For patients
that survive the acute phase, the most important determinants of costs are disability status and
having a partner – as they influence patients' stroke careers. These determinants also interact. The
most efficient stroke service experiment was most successful in co-ordinating patient flow from
hospital to (nursing) home, through capacity planning and efficient discharge procedures. In this
region the costs of stroke service care are the same as for regular stroke care. The other
experiments suffered from waiting lists for nursing homes and home care, leading to "blocked beds"
in hospitals and nursing homes and higher costs of care. Costs of co-ordination are estimated at
about 3% of total costs of care.
Conclusion: This paper demonstrates that by organising care for stroke patients in a stroke
service, better health effects can be achieved with the same budget. In addition, it provides insight
in need, predisposing and enabling factors that determine costs of care after stroke.
Background
Stroke is a major cause of long-term disability in Western
societies [1]. At present about 27,000 Dutch citizens (i.e.,
about 0.2% of the total population) suffer from a stroke
each year and with the ageing of the population this
number is expected to increase to 36,000 in 2015 [2]. One
Published: 26 February 2003
Cost Effectiveness and Resource Allocation 2003, 1:2
Received: 24 February 2003
Accepted: 26 February 2003
This article is available from: />© 2003 van Exel et al; licensee BioMed Central Ltd. This is an Open Access article: verbatim copying and redistribution of this article are permitted in all
media for any purpose, provided this notice is preserved along with the article's original URL.
Cost Effectiveness and Resource Allocation 2003, 1 />Page 2 of 11
(page number not for citation purposes)
third of this group dies within 36 months and about 60%
survives with moderate or severe disability [3]. In 1999
12,409 people died from a stroke, making stroke the third
cause of death in the Netherlands [4]. Stroke was estimat-
ed to be responsible for 3.2% of total health care costs in
the Netherlands in 1994, and 7.3% for the population
aged 75 and over. Therewith stroke ranked second on the
list of most costly diseases for the elderly, after dementia
[5], while these costs are expected to increase with about
40% till 2015 [6].
The treatment of stroke in the Netherlands is often not op-
timal: many patients stay in hospital too long without
medical necessity, waiting to be discharged to a nursing
home (which in the Netherlands is an old people's home
with a medical doctor and therapists), a rehabilitation
centre or for home care. The number of such "waiting
days" is quite substantial. About 10 of the average 28 days
of stay in hospital after stroke are estimated to have no
medical reason [7]. Moreover, as a result of this delay in
discharge patients occupy beds (so-called "blocked beds")
that cannot be used for other patients needing (acute)
treatment, leading to waiting lists for hospital admission,
additional effort of GPs trying to place acute patients, and
possible risk to these patients' lives and recovery.
In recent years, stroke services are increasingly initiated to
improve the management of stroke patients. A stroke serv-
ice can be defined as a regional chain of caregivers – i.e.,
medical, nursing and therapy staff – who together, as a
network, warrant integrated, expert and coherent treat-
ment and care for stroke patients in all phases – i.e., acute,
rehabilitation and chronic – of the ailment [8,9]. A stroke
service thus seeks to promote regional co-operation be-
tween the disciplines and institutions involved in the care
of stroke patients so that patients would receive the right
care at the right time in the right place from the right pro-
fessional. Though there are different models of organised
care, some common elements of a stroke service are: a
hospital stroke unit, a specialist multi-disciplinary team of
caregivers, protocol-based care, special staff training, and
agreements about transfers from one institution to anoth-
er to reduce hospital discharge delay. In the EDISSE study
(Evaluation of Dutch Integrated Stroke Service Experi-
ments) three experimental stroke services were analysed
in depth with respect to costs, health effects, quality and
organisation of care, and compared to three reference re-
gions representing current standard care for stroke in the
Netherlands [8]. It is not known which specific elements
of a stroke service exert a beneficial effect. The need to
compare different models of organized care has therefore
been emphasized [10,11]. In the present study we evalu-
ated the extent to which three different stroke services suc-
ceeded in reducing discharge delay. In this study we
demonstrated that organising stroke care in a stroke serv-
ice potentially reduces the length of hospital stay for non-
medical reasons considerably [8,12], and may lead to im-
proved health outcomes 6 months after stroke in terms of
functional limitations, handicap and quality of life [8,13].
These results are supported in recent international studies
of the effectiveness of stroke services [10,11,14–16]. In
this paper we present patient costs, relate costs to need,
predisposing and enabling factors (i.e., severity of stroke,
age, gender, place of residence before stroke, waiting lists)
[17], different care pathways and analyse whether costs
differ between regular care for stroke patients and care or-
ganised in stroke services.
Methods
The EDISSE study is an observational, non randomised
study, comparing the costs, patient outcomes and quality
of care for three experimental stroke regions versus three
reference regions that together represent current standard
stroke care. Although the study is observational, data on
case mix variables were collected, enabling us to control
for differences in case-mix, see the results.
The stroke service experiments
In all stroke service experiments evaluated, hospitals,
nursing homes, rehabilitation centres, general practition-
ers and home care worked together in order to provide co-
ordinated care. The practical design of the stroke service
experiments however varied considerably. The Delft
stroke service experiment consisted of one hospital with a
stroke unit, a major nursing home which made additional
capacity available on a special stroke unit, specialised
nurses in home care and a transmural stroke nurse to ac-
company patients and their files in and between institu-
tions. The focus of the Nijmegen experiment was on
monitoring and supporting recovery after discharge to
home. Two hospitals, that did not have stroke units dur-
ing the project, were each linked to a nursing home with
a stroke unit. A special outpatient follow-up care facility
was created to support patients in their rehabilitation, and
part of the district nurses received specialised training. The
Haarlem experiment was primarily directed at nursing
home and home rehabilitation. Three hospitals, none of
them having a stroke unit during the project, were linked
to a single nursing home with a stroke unit, and a special-
ised rehabilitation team was set up for intensive home
care. The reference regions were chosen as a proxy for av-
erage current stroke care in the Netherlands, based on pre-
vious research [18]. The study was approved by the
medical ethics committees of the participating centres,
and informed consent was given by all participants.
Cost calculation
We analysed the direct health care costs during the first 6
months after hospital admission. All costs concern the
year 1999. Health care utilisation in hospitals, nursing
Cost Effectiveness and Resource Allocation 2003, 1 />Page 3 of 11
(page number not for citation purposes)
homes and rehabilitation centres was registered by in-
specting medical patient files on inpatient days, assess-
ment, medication, physician consultations and
consultations of various paramedical personnel. Patient
interviews at 2 and 6 months after hospital admission
produced information on non institutional care, like GP
visits, medication, home care, paramedical care, home ad-
aptations and assistive devices. With respect to inpatient
days and rehabilitation treatment full costs (including
capital costs and overhead) per unit were estimated in
each facility in all 6 regions, using the direct allocation
method [19]. For a limited number of care facilities no in-
formation on costs per unit was determined due to the
small number or patients or lack of co-operation. For pa-
tients staying in these care facilities, the average costs of
other care facilities of the same type were imputed. For
special stroke units in hospitals and nursing homes the
additional treatment costs per day were estimated and ad-
ditional costs for co-ordination specific to the stroke serv-
ice experiments were taken into account. For paramedical
care (i.e., physical, speech and occupational therapy, and
social work) the costs per consultation were based on time
registration and salary costs of the relevant paramedical
disciplines [20]. For diagnostic procedures, medication
and surgery the current tariffs charged were used, as these
services only represent a small proportion of total costs.
For home care the costs per hour for several types of home
care correspond closely to the national tariffs, hence the
latter were applied. For home adaptations and assistive
devices common market prices, as published by providers
of these services, were used. The costs of re-admissions
were not considered as the number was negligible (note:
15 patients were re-admitted during the follow-up period,
i.e., 5 in Delft, 2 in Haarlem, 2 in Nijmegen, and 6 in the
reference regions; these numbers are too low to relate
them to stroke management strategy).
Statistical analysis
In non-randomised comparing studies such as the one
presented here, correcting for differences in case-mix is
very important [21]. We used the Barthel Index (BI) to de-
tect possible differences in case-mix between regions [22].
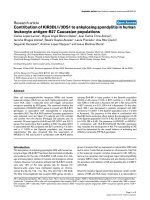
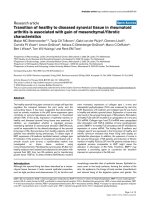
Figure 1
Patients' stroke careers during the 6 month follow-up (N = 598). Note: (i) patient flows along arrows; (ii) patients'
place of stay after 6 months in boxes.
HOSPITAL
HOSPITAL
REHABILITATION
CENTRE
REHABILITATION
CENTRE
NURSING
HOME
NURSING
HOME
HOME
HOME
DECEASED
DECEASED
109
(18%)
53
(9%)
41
(7%)
1
(0%)
26
(4%)
187
(31%)
239
(40%)
10
(2%)
44
(7%)
57
(10%)
8
(1%)
89
(15%)
314
(53%)
177
(30%)
Cost Effectiveness and Resource Allocation 2003, 1 />Page 4 of 11
(page number not for citation purposes)
BI is a recommended measure for disability after stroke
that is widely used in hospitals [23,24]. BI was registered
for all (surviving) patients at hospital admission, hospital
discharge, and 2 and 6 months after stroke during patient
interviews. A patient can receive a score between 0 (de-
ceased) and 20 (no disabilities). To investigate the rela-
tionship between costs and disability we classified the BI
scores into 5 disability categories: a BI of 20 stands for in-
dependent; 15–19 mild; 10–14 moderate; 5–9 severe; 0–
4 very severe. Univariate statistics and multivariate regres-
sion analysis are presented in the tables.
Results
Study population
The EDISSE study included a total of 598 stroke patients:
411 in the three stroke service experiments (151 in Delft,
149 in Nijmegen and 111 in Haarlem respectively) and
187 in the reference regions together. A small majority
(54%) of the total population was female, the average age
was 73.5 years (56% aged 75 or older), and one third of
the patients lived single before stroke. On average women
were somewhat older and more often single [8]. Starting
point for the cost analysis is hospital admission after
stroke. During the 6 months follow-up patients followed
different paths through the health care system (see Figure
1). About 18% of the patients died in hospital, 40% was
discharged back to home, 31% to a nursing home, 9% to
a rehabilitation centre, and 10 patients (2%) were hospi-
talised for the full 6 months period. After 6 months about
30% (i.e., 177) of the patients had died, 15% stayed in a
nursing home, and over 50% had returned home. There
was no difference in mortality between the regions in the
6 months follow-up. However, 6 months after stroke, the
average health related quality of life of patients (measured
by the EuroQol EQ-5D and the SA-SIP 30) treated in the
stroke service in Delft was significantly better than in the
reference regions [13]. With respect to quality of care the
Delft region also showed superior results. Compared to all
other regions, the fraction of observed care deficiencies
with a (potential) negative impact on patients health was
50% lower [8].
Mann-Whitney and υ
2
-tests were applied to detect poten-
tial differences in case-mix between regions. We found
traces of a case-mix difference between Haarlem and the
joint reference regions (p = 0.03), whereas no differences
in disability at hospital admission were found for Delft
and Nijmegen versus the joint reference regions [8,12].
Hospital costs
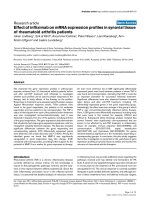
Average length of stay in hospital was 13 days in Delft, 33
days in Haarlem, 32 days in Nijmegen, and 29 days in the
reference regions (table 1) [12]. Length of stay in hospital
was mainly dependent upon severity of stroke, death from
stroke in the acute phase and waiting lists for nursing
home care (table 2 [a]). Average hospital costs per patient
amount to €6,740 (95% CI: €6,090 – €7,390). About
90% of these costs concern accommodation costs. The
costs of medication, assessment, medical and paramedical
treatment are limited. Hospital costs were lower for pa-
tients who died in hospital (€4,430 vs. €7,260; p <
0.001), patients under the age of 75 (€5,860 vs. €7,490; p
< 0.05), men (€5,970 vs. €7,400; p < 0.05) and are higher
for regions with waiting lists for nursing home care (table
2 [c]). For stroke service Delft the hospital costs are by far
the lowest: €4,170 per patient; the other two experiments
are much more expensive, whereas the reference regions
have intermediate hospital costs.
Table 1: Average hospital, nursing home and total costs per patient (in € of 1999; n = 598)
Delft Haarlem Nijmegen Reference regions
Hospital costs (per hospital patient) 4,170 7,880 8,650 6,620
(number of patients, average length of stay in days) (151, 13) (111, 33) (149, 32) (187, 29)
- accommodation costs 3,450 7,240 7,900 6,010
- diagnostics, therapy en medication 630 520 670 460
- paramedic care 90 110 80 140
Nursing home costs (per nursing home patient) 13,710 16,700 19,620 15,350
(number of patients, average length of stay in days) (55, 82) (34, 110) (44, 110) (54, 99)
- accommodation costs 11,030 14,300 15,500 13,650
- diagnostics, therapy en medication 260 670 300 590
- paramedic care 2,420 1,730 3,810 1,110
Total costs (per patient) 13,160 16,790 20,230 13,810
(number of patients) (151) (111) (149) (187)
- hospital 4,170 7,880 8,650 6,620
- nursing home 4,990 5,120 5,790 4,430
- rehabilitation centre 1,110 2,120 4,170 890
- at home 2,890 1,680 1,620 1,880
Cost Effectiveness and Resource Allocation 2003, 1 />Page 5 of 11
(page number not for citation purposes)
Only in Delft a hospital stroke unit was fully operational
during the study period: 75% of the patients was admitted
to this unit and stayed on average for 13 days. Although
the additional costs of the unit were €35 per day, hospital
costs in Delft were comparable to the reference regions as
a result of the substantial reduction in length of stay. The
substantial reduction in hospital length of stay in Delft
was caused by the fact that in Delft 82% of hospital days
had a "hard" medical reason, whereas this percentage was
only 43% in Haarlem, 46% in Nijmegen and 49% in the
reference regions [12]. A patient's day of stay in hospital
has a "hard" medical reason in case treatment or assess-
ment is performed that cannot be performed outside the
hospital; a "soft" medical reason in case treatment or as-
sessment is performed that could also have been per-
formed in an other care facility; non-medical reason in
case the patient is not undergoing any treatment or assess-
ment and is only waiting to be discharged to another care
facility [7]. Reason of stay has been recorded for all pa-
tients and all days of stay in hospital. In most regions the
main reason for patients occupying a hospital bed with-
out medical reason were waiting lists for nursing homes
and home care, "enabling" factors [17]. The hospital costs
for days of stay with a hard medical reason were however
highly comparable between regions, indicating that the
additional nursing home capacity made available in Delft
is an important determinant of the lower costs.
Nursing home costs
For the 187 patients discharged to a nursing home average
length of stay was 99 days. The total nursing home costs
were on average €16,120 (95% CI: €14,840 - €17,390)
per patient (table 1). Again the lion's share of costs (83%)
concerns accommodation. Stroke units were operational
in 3 experiment and 2 reference regions during the study
period. About half of the patients (n = 95) stayed in a
nursing home stroke unit.
Nursing home costs are lower for patients who die during
their stay in a nursing home (€8,550 vs. €18,240; p <
0.001) due to shorter length of stay. Costs are comparable
for men and women as well as for younger and older pa-
tients. Those who stayed in a nursing home stroke unit
were more expensive (€17,900 vs. €14,270; p < 0.001),
mainly due to additional expenditures and protocols for
intensified paramedical care. Average costs per region vary
significantly, predominantly as a result of differences in
length of stay. Patients in Delft were discharged from hos-
pital after a relatively short stay (13 days, see table 1).
Hence, part of the short term mortality "shifted" to the
nursing home and the mortality of patients admitted to a
nursing home increased significantly, i.e., 40% in Delft vs.
14% in the other regions (note: no differences in mortali-
ty for the 6 month follow-up or timing of death (i.e., av-
erage number of days alive of those who die) were found
Table 2: Linear regression results (n = 575)
Variable [a] Length of stay in
hospital
[b] Length of stay in nurs-
ing home
a
[c] Hospital costs [d] Nursing home costs
a
[e] Total costs
B 95% CI B 95% CI B 95% CI B 95% CI B 95% CI
Constant 3.2 -4.6; 10.9 114.7*** 76.1; 153.3 1,011 -901; 2,924 20,780*** 14,179;
27,380
-8,246*** -11,464; -
5,027
Age
b
3.7 -1.4; 8.8 7.1 -8.3; 22.5 744 -500; 1,987 658 -1,975; 3,291 1,140 -343; 2,623
Gender
c
2.4 -2.6; 7.4 -2.4 -17.4; 12.7 477 -748; 1,703 -705 -3,282; 1,872 -312 -1,730; 1,105
Living single
d
3.2 -2.1; 8.4 1.8 -12.9; 16.5 609 -680; 1,898 -656 -3,169; 1,857 1.357* -152; 2,867
BI hospital admission 2.9* -0.3; 6.1 -1.0 -14.8; 12.8 627 -154; 1,409 -357 -2,720; 2,006 1,359** 433; 2,286
BI hospital discharge 7.2*** 4.2; 10.3 6.8 -2.9; 16.4 1,823*** 1,075; 2,570 1,053 -599; 2,704 2,630*** 1,679; 3,582
Waiting list nursing
home
e
8.1** 2.4; 13.9 2,216** 809; 3,624 3,930*** 2,306; 5,554
Delft region
f
-13.0*** -19.6; -6.3 -43.7*** -61.9; -25.6 -2,216** -3,855; -577 -6,860*** -9,965; -
3,755
-651 -2,546; 1,243
Died in hospital
g
-38.6*** -48.3; -29.0 -9,482*** -11,859; -
7,105
-8,343*** -12,381; -
4,304
Died within 6
months
d
10,919*** 8,617;
13,220
Length of stay in
hospital
-0.6*** -0.9; -0.4 -109*** -150; -68
Stayed in nursing
home
d
11,325*** 9,088;
13,563
Stayed in rehab
centre
d
18,457*** 15,684;
21,229
R
2
0.23 0.17 0.21 0.17 0.66
a
Selecting only patients that stayed in nursing home (n = 182).
b
1 if 75 years or older; else 0.
c
1 if female; else 0.
d
1 if yes; else 0.
e
proxy based on
whether an agreement was made between hospital and nursing home for efficient stroke patient discharge: 1 if no; else 0.
f
1 if patient was admitted
to hospital in Delft region; else 0.
g
1 if patient died in hospital; else 0. *** significant at p < 0.001 level. ** significant at p < 0.01 level. * significant at
p < 0.1 level.
Cost Effectiveness and Resource Allocation 2003, 1 />Page 6 of 11
(page number not for citation purposes)
between experiment and reference regions. The higher
mortality in Delft nursing homes therefore is not related
to the change in service setting, but simply due to the nat-
ural course of stroke). Therefore, as patients who die have
shorter length of stay in nursing home, the average length
of stay in Delft is much lower (table 1) and consequently
also the average nursing home costs (see also table 2 [b]
and 1 [d]). Patients that do not die during their stay in the
nursing home in Delft have average lengths of stay com-
parable to the other regions (i.e., about 110 days).
Other costs
For the 53 patients who stayed in a rehabilitation centre
during the follow-up period the average costs were
€22,440 per patient. Accommodation costs accounted for
82% of total costs. The costs are lower for patients dis-
charged from hospital with only mild disabilities
(€17,040 vs. €23,700; P < 0.05). The rehabilitation costs
vary considerably between regions, but the small number
of patients per region does not allow us to draw conclu-
sions on this issue.
The costs of care for patients who stayed at home during
part of the follow-up period amount to €3,580 per pa-
tient. The main costs are for home care, paramedical care
and GP visits. The costs of medication, home adaptations
and assistive devices together were only 13% of total costs.
The costs are markedly higher for patients aged 75 and
older (€4,120 vs. €3,160; p < 0.05), and for patients living
single before stroke (€4,260 vs. €3,290; n.s.). Patients liv-
ing single (often women) can less often fall back on infor-
mal care and therefore need more professional home care
[25]. The costs at home vary considerably among regions,
with Delft as highest (€4,500) mainly due to earlier dis-
charge back home.
Total costs
The total costs of care per patient for the 6 month follow-
up after stroke amount to almost €16,000 on average
(95% CI: €14,670 – €16,930). Although many patients
spent a considerable share of the 6 months at home, insti-
tutional care is responsible for 87% of the costs (table 1).
The costs vary markedly between regions: care organised
in stroke services in Delft is the least expensive, slightly
cheaper than the reference regions (non significant differ-
ence). The stroke service in Haarlem is slightly more ex-
pensive than the reference regions (n.s.) and Delft (n.s.).
The stroke service in Nijmegen is more significantly ex-
pensive than the reference regions (p < 0.001) and Delft
(p < 0.001), especially for the hospital and rehabilitation
phases. A small part of the higher hospital costs in Ni-
jmegen may be attributed to the participation of an aca-
demic hospital in the experiment, with obviously higher
costs per day. But also after correction the hospital (and
total) costs in Nijmegen remain significantly higher. The
substantial reduction of hospital costs in Delft is partly
compensated by increased costs in the other subsectors,
especially home care.
Table 3 shows the relationship between costs and the pa-
tients' stroke career, the path patients have followed
through the health care system during the follow-up peri-
od. By far the most expensive path is a hospital stay and
subsequent rehabilitation care for the full six months pe-
riod. All paths that include nursing home or rehabilita-
tion care (after hospital care) are relatively expensive. Not
surprisingly, patients directly discharged to home are the
least expensive. The costs for patients who only stayed in
hospital are also quite low, because most of them died af-
ter a short hospital stay. The average costs for the 10 pa-
tients that stayed in hospital for the full 6 month period
amount to €44,480.
Total costs versus disability after stroke and patient
characteristics
To get better insight into the variation of costs among
stroke patients, we analysed the relationship with disabil-
ity after stroke and patient characteristics as age, gender,
and place of residence before stroke.
The last column of table 4 clearly shows that patients who
died within the first 6 months after stroke were less expen-
Table 3: Total average costs per patient by stroke career (in € of 1999; n = 598)
Hospital Hospital
↓
home
Hospital
↓
rehab centre
Hospital
↓
rehab centre
↓
home
Hospital
↓
nursing home
Hospital
↓
nursing home
↓
home
(n = 119) (n = 239) (n = 9) (n = 44) (n = 130) (n = 57)
Total costs 7,790 7,580 49,230 29,930 28,200 22,520
- institutional 7,790 3,840 49,230 27,100 28,200 19,070
- non institutional - 3,740 - 2,830 - 3,450
Cost Effectiveness and Resource Allocation 2003, 1 />Page 7 of 11
(page number not for citation purposes)
sive than average, obviously because their stay in institu-
tional care is on average relatively short and their medical
consumption therefore low. Disability at hospital admis-
sion seems to be a good indicator of total care costs: the
more severe the disability, the higher total costs, especially
for stroke survivors. A closer look shows that only the
costs of institutional care increase with the degree of disa-
bility. For ambulatory care the peak in costs can be found
for patients with mild and moderate disabilities, as a re-
sult of the combination of a fair probability of returning
home and being partly dependent after stroke. Only for
independent patients and those with mild disability the
fraction of non-institutional costs in total costs is substan-
tial. Our finding that surviving patients with very severe
disability cost about 5 times as much as independent pa-
tients corresponds to findings in previous research [26].
Viewing patient characteristics, the costs for patients older
than 75 years are slightly higher and women who survive
the first 6 months incur about 10% more costs than men
(table 5). The most important cost determinant seems to
be the place of residence before stroke: living single results
in substantially higher costs, because the probability of
being admitted to a nursing home is elevated substantial-
ly, even with limited disabilities. In our sample the prob-
ability of being discharged to a nursing home increases
with the disability at hospital discharge (p < 0.001), is
higher for patients of 75 years of age or older (p < 0.001),
patients living single before stroke (p < 0.001), and female
patients (p < 0.01). This corresponds with findings from
previous research [27,28]. Determinants for higher costs
also seem to interact: single living women (€20,080), sin-
gle elderly (€19,500) and especially single living elderly
women (€21,790) are the most expensive patients (see
also table 2 [e]).
Costs of co-ordinating stroke services
Setting up and maintaining a stroke service requires con-
siderable co-ordination efforts between disciplines and fa-
cilities involved in organising co-ordinated care for stroke
patients. Analysis of the organisation of stroke services
showed that especially in the very early phase of the stroke
service experiments the developments most of the times
took place during regular management, department and
discipline meetings [8]. Therefore, most of the times it was
impossible to reconstruct the actual start of the experi-
ment and all time and material effort dedicated to stroke
service development. As a result, we focussed on the bulk
of costs, i.e. frequency, duration and number/type of staff
involved in meetings, workshops, development teams
and training. Based on organisation schedules, minutes of
staff meetings, and interviews with staff members and
stroke service co-ordinators we estimated the costs of co-
ordination, making a distinction between one time start
up costs and yearly structural costs of a stroke service.
Start up costs consisted of: development of uniform trans-
fer of patient information, setting up communication and
treatment protocols between care facilities and treatment
disciplines, dedicated training (neurology and stroke), de-
veloping dossiers, producing news letters, organising
working conferences etc. The range of costs per region is
between €66,000 and €134,000, the average costs being
€96,000 per region. The implementation of stroke servic-
es took between 2 and 3 years.
Table 4: average total costs per patient; by disability at hospital admission and by mortality status after 6 months (in € of 1999; n = 595)
Died within 6 months? Disability
a
Average
Independent (n = 31) Mild (n = 81) Moderate (n = 98) Severe (n = 126) Very severe (n = 259)
Yes Total costs 4,510 5,630 10,020 10,240 7,500 7,870
- institutional 3,720 4,300 9,200 9,310 7,440 7,630
- non
institutional
790 1,330 820 920 60 240
No Total costs 6,610 6,860 13,170 23,810 30,610 19,160
- institutional 4,350 3,810 9,290 20,840 28,860 16,380
- non
institutional
2,260 3,050 3,880 2,960 1,750 2,780
Total Total costs 6,470 6,800 12,950 21,440 18,210 15,860
- institutional 4,310 3,830 9,290 18,830 17,360 13,820
- non
institutional
2,160 2,970 3,660 2,610 840 2,040
a
Based on Barthel Index. Categorisation: BI of 20 independent; BI of 15–19 mild; BI of 10–14 moderate; BI of 5–9 severe; BI of 0–4 very severe
Cost Effectiveness and Resource Allocation 2003, 1 />Page 8 of 11
(page number not for citation purposes)
Structural costs comprise costs of additional co-ordina-
tion between institutes, interdisciplinary meetings, fort-
nightly patient discussions, training of new personnel,
refresh training of old personnel, communication and
monitoring. The annual structural co-ordination costs
ranged from €51,000 to €98,000 per region and averaged
€71,000 per region per year. The costs of co-ordination
have not been included in the patient costs, as these could
not be attributed to individual patients (note: by simply
estimating the number of stroke patients per year per re-
gion based on the number of patients included in each re-
gion during the inclusion period of the study, the
structural co-ordination costs per patient range between
€175 and €260, i.e., about 3% (2.7–3.4%) of total costs).
Cost differences between regular care and stroke service
The substantial differences between regional costs as pre-
sented above were analysed further. We focused on the
most notable region – in terms of (comparable) costs and
(better) health effects, i.e., the stroke service in Delft. The
difference in costs per patient between Delft and the refer-
ence regions was decomposed into a price component
and a utilisation component. The price component indi-
cates the costs difference due to differences in costs per
unit of medical services and includes costs of intensified
care. The utilisation component reflects differences in the
amount of medical consumption. As table 6 shows, the
substantial reduction in hospital length of stay in Delft
causes a saving in hospital costs of €2,450 per patient. The
higher cost per day of stay for the hospital stroke unit is
thus more than compensated by this shorter stay. But, as
a consequence, the patients in Delft are treated in a nurs-
ing home and/or stay at home longer, causing additional
costs for care in those subsectors. For care at home, both
cost components are positive, indicating that in Delft the
cost per day is higher and the number of days care provid-
ed at home is larger. On balance, the total health care costs
per patient during the 6 month follow-up are €650 lower
in Delft as compared to the reference regions (non signif-
icant difference; excluding the co-ordination costs).
Discussion
Total costs of care per patient for the 6 month follow-up
after stroke are estimated at €16,000. This is comparable
to what was found in other studies [26,29–31]. Patient
costs after stroke are dominated by institutional costs,
which is again similar to what other studies found
[26,30–32]. The most important determinant of costs is
death. Patients that die from a stroke bring about signifi-
cantly less costs. That is, total costs. The costs per day alive
are significantly higher for those who die from stroke
(€275 vs. €105; p < 0.001). For patients that survive the
acute phase, disability after stroke and place of residence
before stroke – people living single most likely do not to
have a partner and therefore no informal caregivers – are
important determinants of costs as these factors have great
influence on patients' stroke careers. Previous research has
demonstrated that these "need" and "predisposing" fac-
tors are important determinants of costs of care after
stroke and therefore potential building blocks for the de-
Table 5: Average total costs per patient by age, gender and place of residence (in € of 1999; n = 598)
Died within
6 months?
Age Gender Place of residence
a
Under 75 (n = 265) 75 and older (n = 333) Female (n = 323) Male (n = 275) Single (n = 193) Other (n = 387)
Yes 7,330 8,050 7,650 7,960 9,400 7,780
No 17,760 20,630 20,090 18,040 21,800 17,790
Total 15,430 16,120 16,550 14,920 18,650 14,890
a
Of 18 respondents the place of residence before stroke could not be retrieved.
Table 6: average cost of stroke care for Delft versus reference regions, decomposed into price and utilisation component (in € of 1999)
Delft (n = 151) Reference regions (n = 187) Total cost difference Price-component Utilisation-component
Total costs 13,160 13,810 -650 2,410 -3,060
- hospital 4,170 6,620 -2,450 1,100 -3,540
- nursing home 4,990 4,430 560 400 160
- rehabilitation 1,110 880 220 250 -20
- care at home 2,890 1,880 1,020 670 350
Cost Effectiveness and Resource Allocation 2003, 1 />Page 9 of 11
(page number not for citation purposes)
velopment of Diagnosis Related Groups (DRGs) for
stroke [26,33,34]. Informal care also plays a crucial role,
as the support provided by informal caregivers is a key var-
iable in determining whether and for how long the chron-
ically ill will be institutionalised [35].
We found considerable differences in costs between the
regions participating in the study, but no significant dif-
ference between the best functioning stroke service – in
the Delft region – and regular care in the reference regions.
One of the main reasons why the stroke service experi-
ment in Delft was more efficient than the other two exper-
iments appears to be the additional capacity that was
made available in the nursing home, probably reinforced
by the transfer co-ordination efforts of the transmural
stroke nurse. This effects has been demonstrated else-
where [36]. As a result of the successful co-ordination of
patient flow, patients could be discharged from hospital
soon after finishing of medical treatment. This is
emphasised by the high percentage in Delft of days of stay
in hospital with a hard medical reason. In Haarlem nurs-
ing home capacity was insufficient to deal with the re-
quests from the three participating hospitals and in
Nijmegen the focus of the experiment was on after care. As
a result patients stayed in hospital much longer, leading to
"blocked beds" and higher costs. The hospital costs for
days of stay with a hard medical reason are however high-
ly comparable between the experiments, therefore the key
success factor of stroke services, at least concerning cost
control, may be the co-ordination of patient flow. Delft is
thus well ahead of Haarlem and Nijmegen in the develop-
ment of an integrated and fully operational stroke service,
and the cost estimate for Delft may be considered as a
good first approximation of a DRG for stroke service care
– preferably differentiated for patient life status and disa-
bility after stroke. Note, however, that we found a signifi-
cant shift of costs between subsectors of care in Delft –
mainly from institutional to home -and that integration
of care for stroke patients may therefore have an impact
on the financing of care. In addition, costs of co-ordina-
tion for setting up and maintaining a stroke service may
be substantial. There are some critical comments to our
study. First of all, EDISSE is a non-randomised non-con-
trolled observational study and consequently we have to
be cautious in comparing the results between regions.
Though we found traces of a case-mix difference between
Haarlem and the reference regions, this was not the case
for the experiment in Delft which we used as benchmark
of a fully operational stroke service. Second, not all nurs-
ing homes and revalidation centres made registrations of
paramedical therapy available. Consequently, we used
available volumes from other centres weighted for patient
disability status. As a result, the presented variations in
costs of paramedical therapy between regions may be an
underestimation of actual differences between patients
and regions.
We assert to have taken a societal perspective in calculat-
ing the costs of stroke. This is true. Still, one may argue
that taking a societal perspective also implies that we
should have taken in to account the effect (i.e., the oppor-
tunity costs) of dedicating additional scarce health care
funds to co-ordinating and intensifying care for stroke pa-
tients. Perhaps creating additional nursing home capacity
for stroke patients has lead to waiting lists for other
groups of patients, especially considering the current
shortage of capacity – mainly staff – in the Dutch health
care system. And even if this were not the case, one could
question whether stroke patients are the most deserving of
patients to be allocated this additional capacity. Nonethe-
less, our analysis shows that a well-operating stroke serv-
ice need not require additional funds – and will lead to
better health outcomes [8].
It is worth mentioning that recently the Central Agency
Tariffs for Health Care (CTG) in the Netherlands pro-
posed to allocate a bonus €86 per inpatient day to nursing
homes for intensive stroke care (e.g., on a nursing home
stroke unit) [37]. This tariff is higher than the additional
daily stroke unit costs we have estimated, but maximised
to 8 weeks per patient. Because the patients in our study
stay in the nursing home for an average of about 100 days,
the total sum for intensive stroke unit care from CTG and
from our costs study are comparable (€4,830 vs. €5,220).
Conclusions
Concluding, in this paper we have shown that patient
costs after stroke depend on need (disability after stroke),
predisposing (age, gender, place of residence/having a
partner) and enabling (waiting days and waiting lists) fac-
tors. The need and predisposing (demand-side) factors
may be important building-blocks for DRGs for stroke.
Having a partner (or other relatives) that provides infor-
mal care may prevent, shorten or postpone (costly) insti-
tutionalisation. We also demonstrated that enabling
(supply-side) factors, i.e., those related to the organisation
of care, may be an important source for improving cost-ef-
ficiency of care for stroke patients. Through sound capac-
ity planning on supra-institutional level and efficient, well
co-ordinated discharge procedures the stroke service in
Delft was able to reduce waiting lists for nursing homes
and home care and, consequently, to discharge patients
from expensive hospital beds as soon as there was no
longer a hard medical reason for them to stay. Finally, and
most important, our study [8] shows that a well-operating
stroke service will lead to better health outcomes for pa-
tients and need not require additional health care funds.
Evidence from other disease groups support the statement
Cost Effectiveness and Resource Allocation 2003, 1 />Page 10 of 11
(page number not for citation purposes)
that this result is not exclusive for stroke care [e.g.,
[38,39]].
Competing interests
At the time of the study Wilma Scholte op Reimer was em-
ployed at the Department of Health Policy and Manage-
ment of Erasmus MC, Rotterdam, The Netherlands.
Authors' contributions
JE, MK, WS and JW participated in the design of the study.
MK and WS participated in the co-ordination of the study.
JE, WS and JW carried out the data collection. JE and MK
performed the statistical analysis and prepared the manu-
script. All authors read and approved the final
manuscript.
Acknowledgements
The EDISSE study was funded by ZorgOnderzoek Nederland (ZON), the
Dutch governmental intermediary for health care research. Projectnumber:
10200004. ZON, PO Box 93 245, 2509 AE The Hague, The Netherlands.
See also:
The open peer review comments of Dr Kevin
Schulman (US) and Anita Patel (UK) on an earlier version of this paper are
gratefully acknowledged.
References
1. Scholte op Reimer WJM, de Haan RJ, Pijnenborg JMA, Limburg M and
van den Bos GAM Assessment of burden in partners of stroke
patients with the Sense of Competence Questionnaire. Stroke
1997, 29:373-379
2. National Institute of Public Health and the Environment (RIVM) Pub-
lic Health Status and Forecasts 1997 [in Dutch]. Utrecht 1997,
3. Dutch Heart Foundation Action-plan Stroke Service; a seven-
steps model to arrive at regional co-operation in stroke care
[in Dutch]. The Hague 1999,
4. Central Bureau of Statistics Deceased and most important caus-
es of death, main statistics health. 2001, [
]
5. Polder JJ, Meerding WJ, Koopmanschap MA, Bonneux L and van der
Maas PJ Cost of illness in the Netherlands 1994 [in Dutch]. In-
Figure 2
Average length of stay and mortality per region during the 6 month follow-up (N = 598). Note: (i) average length
of stay in bars; (ii) mortality per sector as percentage of total deceased in region.
29
32
33
13
29
33
34
30
4
14
9
4
80
68
57
94
0 30 60 90 120 150
Ref regions
Nijmegen
Haarlem
Delft
Days
hospital nurs home rehab centre home
63% 20%3%15%
39% 11%0%50%
73% 16%0%11%
71% 11%2%16%
141
142
147
133
Publish with BioMed Central and every
scientist can read your work free of charge
"BioMed Central will be the most significant development for
disseminating the results of biomedical research in our lifetime."
Sir Paul Nurse, Cancer Research UK
Your research papers will be:
available free of charge to the entire biomedical community
peer reviewed and published immediately upon acceptance
cited in PubMed and archived on PubMed Central
yours — you keep the copyright
Submit your manuscript here:
/>BioMedcentral
Cost Effectiveness and Resource Allocation 2003, 1 />Page 11 of 11
(page number not for citation purposes)
stituut Maatschappelijke Gezondheidszorg, Institute for Medical Technolo-
gy Assessment, Erasmus University, Rotterdam 1997, [http://
www.rivm.nl/kostenvanziekten/site_en/index.htm]
6. Evers SMAA, Struijs JN, Ament AJHA, van Genugten MLL, Jager JC
and van den Bos GAM The disease impact, health care manage-
ment, and costs of stroke in the Netherlands. Report
282701001/2002, National Institute for Public Health and the Environ-
ment (RIVM), Bilthoven 2002,
7. van Straten A, van der Meulen JHP, van den Bos GAM and Limburg M
Length of hospital stay and discharge delays in stroke
patients. Stroke 1997, 28:137-140
8. Huijsman R, Klazinga NS, Scholte op Reimer WJM, van Wijngaarden
JDH, van Exel NJA, van Putte-Boon C, Prestholt FT, Koopmanschap
MA and Niessen LW Beroerte, beroering en borging in de ket-
en: Results of the EDISSE study of three regional experi-
ments with stroke-service [in Dutch] Report, ZonMW, The Hague
2001,
9. Stolker DHCM Co-operating in a stroke service: experiences
with co-operating in care for stroke patients en their rela-
tives [in Dutch]. Dutch Heart Foundation, The Hague 2001,
10. Stroke Unit Trialists' Collaboration Collaborative systematic re-
view of the randomised trials of organised inpatient (stroke
unit) care after stroke. BMJ 1997, 314:1151-1159
11. Langhorne P and Duncan P Does the organization of postacute
stroke care really matter? Stroke 2001, 32:268-274
12. Scholte op Reimer WJM, van Straten A, van Exel NJA, van Wijn-
gaarden JDH, Klazinga NS and Huijsman R Stroke service: a reduc-
tion of length of hospital stay and discharge delay? Submitted
to Cerebrovascual Diseases
13. Scholte op Reimer WJM, van Exel NJA, van Wijngaarden JDH, Nies-
sen LW, Koopmanschap MA, Klazinga NS and Huijsman R Stroke
service: improvement of health outcomes? Submitted to stroke
14. Moher D, Weinberg A, Hanlon R and Runnals K Effects of a medi-
cal team coordinator on length of hospital stay. CMAJ 1992,
146:511-515
15. Grieve R, Porsdal V, Hutton J and Wolfe CDA A comparison of
the cost-effectiveness of stroke care in London and
Copenhagen. Int J Technol Assess Health Care 2000, 16(2):1-12
16. Anderson C, Ni Mhurchu C, Brown PM and Carter K Stroke reha-
bilitation services to accelerate hospital discharge and pro-
vide home-based care: an overview and cost analysis.
Pharmacoeconomics 2002, 20(8):537-52
17. Andersen R and Newman JF Societal and individual determi-
nants of medical care utilization in the United States. The Mil-
bank Memorial Fund Quarterly 1973, 51:95-124
18. Limburg M Can stroke patients be treated any better? [in
Dutch] Ziekenfondsraad, Amstelveen 1998,
19. Drummond MF, O'Brien B, Stoddart GL and Torrance GW Methods
for the economic evaluation of health care programs. Oxford
University Press 1997,
20. Oostenbrink JB, Koopmanschap MA and Rutten FFH Guidelines for
cost calculations, methods and recommended prices for
economic evaluations in health care [in Dutch]. College voor
Zorgverzekeringen, Amstelveen 2000,
21. Davenport RJ, Dennis MS and Warlow CP Effect of correcting
outcome data for case mix: an example from stroke
medicine BMJ 1996, 312(7045):1503-1505
22. Mahoney FI and Barthel DW Functional evaluation: the Barthel
Index. Maryland State Medical Journal 1965, 14:61-65
23. Dutch Institute for Healthcare Improvement (CBO) CBO Clinical
Guidelines for Stroke 2000 [in Dutch]. Utrecht 2000,
24. Dutch Heart Foundation Care after stroke [in Dutch]. Den Haag
1995,
25. Kavanagh S, Knapp M and Patel A Costs and disability among
stroke patients. Journal of Public Health Medicine 1999, 21(4):385-
394
26. Porsdal V and Boysen G Costs of health care and social services
during the first year after ischemic stroke. International Journal
of Technology Assessment in Health Care 1999, 15(3):573-584
27. Scholte op Reimer WJM Long-term care after stroke: Studies
on care utilisation, quality of care and burden of caregiving
[PhD dissertation]. University of Amsterdam, Amsterdam 1999,
28. Brown RD Jr, Ransom J, Hass S, Petty GW, O'Fallon WM, Whisnant
JP and Leibson CL Use of Nursing Home After Stroke and
Dependence on Stroke Severity: A Population-Based
Analysis. Stroke 1999, 30:924-929
29. Dewey HM, Thrift CL, Mihalopoulos C, Carter R, MacDonnell RAL,
McNeil JJ and Donnan GA Costs of stroke in Australia from a so-
cietal perspective: Results from the North East Melbourne
Stroke Incidence Study (NEMESIS). Stroke 2001, 32:2409-2416
30. Claesson L, Gosman-Hedström GA, Johannesson M, Fagerberg B and
Blomstrand C Resource Utilization and Costs of Stroke Unit
Care Integrated in a Care Continuum: A 1-Year Controlled,
Prospective, Randomized Study in Elderly Patients: The
Göteborg 70+ Stroke Study. Stroke 2000, 31:2569-2577
31. Caro JJ, Huybrechts KF and Duchesne I Management patterns
and costs of acute ischemic stroke: An international study.
Stroke 2000, 31:582-590
32. Bergman L, van der Meulen JHP, Limburg M and Habbema JDF Costs
of Medical Care After First-Ever Stroke in the Netherlands.
Stroke 1995, 26:1830-1836
33. Diringer MN, Edwards DF, Mattson DT, Akins PT, Sheedy CW, Hsu
CY and Dromerick AW Predictors of acute hospital costs for
treatment of ischemic stroke in an academic center. Stroke
1999, 20:724-728
34. Evers SMAA Economic Evaluation of Stroke [PhD
dissertation]. University of Maastricht, Maastricht 2001,
35. Robinson BC Validation of a Caregiver Strain Index. Journal of
Gerontology 1983, 38(3):344-348
36. Webb DJ, Fayad PB, Wilbur C, Thomas A and Brass LM Effects of a
specialized team on stroke care: The first two years of the
Yale Stroke Program. Stroke 1995, 26:1353-1357
37. Central Agency Tarives Healt Care (CTG) Policy rule II-476 [in
Dutch]. Utrecht 2001,
38. Steffens B Cost-effective management of type 2 diabetes: pro-
viding quality care in a cost-constrained environment. Am J
Manag Care 2000, 6(13 Suppl):S697-703
39. Challis D, von Abendorff R, Brown P, Chesterman J and Hughes J
Care management, dementia care and specialist mental
health services: an evaluation. Int J Geriatr Psychiatry 2002,
17(4):315-25