Báo cáo y học: "Health and economic impact of combining metformin with nateglinide to achieve glycemic control: Comparison of the lifetime costs of complications in the U.K" pps
Bạn đang xem bản rút gọn của tài liệu. Xem và tải ngay bản đầy đủ của tài liệu tại đây (308.38 KB, 9 trang )
BioMed Central
Page 1 of 9
(page number not for citation purposes)
Cost Effectiveness and Resource
Allocation
Open Access
Research
Health and economic impact of combining metformin with
nateglinide to achieve glycemic control: Comparison of the lifetime
costs of complications in the U.K
Alexandra J Ward*
1
, Maribel Salas
1
, J Jaime Caro
1,2
and David Owens
3
Address:
1
Caro Research Institute, Concord, MA USA,
2
Division of General Internal Medicine, McGill University, Montreal, Quebec, Canada and
3
Diabetes Research Unit, Llandough Hospital, Penarth, UK
Email: Alexandra J Ward* - ; Maribel Salas - ; J Jaime Caro - ;
David Owens -
* Corresponding author
Abstract
Background: To reduce the likelihood of complications in persons with type 2 diabetes, it is
critical to control hyperglycaemia. Monotherapy with metformin or insulin secretagogues may fail
to sustain control after an initial reduction in glycemic levels. Thus, combining metformin with
other agents is frequently necessary. These analyses model the potential long-term economic and
health impact of using combination therapy to improve glycemic control.
Methods: An existing model that simulates the long-term course of type 2 diabetes in relation to
glycosylated haemoglobin (HbA
1c
) and post-prandial glucose (PPG) was used to compare the
combination of nateglinide with metformin to monotherapy with metformin. Complication rates
were estimated for major diabetes-related complications (macrovascular and microvascular) based
on existing epidemiologic studies and clinical trial data. Utilities and costs were estimated using data
collected in the United Kingdom Prospective Diabetes Study (UKPDS). Survival, life years gained
(LYG), quality-adjusted life years (QALY), complication rates and associated costs were estimated.
Costs were discounted at 6% and benefits at 1.5% per year.
Results: Combination therapy was predicted to reduce complication rates and associated costs
compared with metformin. Survival increased by 0.39 (0.32 discounted) and QALY by 0.46 years
(0.37 discounted) implying costs of £6,772 per discounted LYG and £5,609 per discounted QALY.
Sensitivity analyses showed the results to be consistent over broad ranges.
Conclusion: Although drug treatment costs are increased by combination therapy, this cost is
expected to be partially offset by a reduction in the costs of treating long-term diabetes
complications.
Background
Type 2 diabetes is a prevalent disease with complications
that cause substantial financial burden [1]. Improving gly-
cemic control can influence the prognosis for patients
with type 2 diabetes as it reduces the risk of developing
microvascular complications (nephropathy, neuropathy
and retinopathy) [2]. Recent guidelines from the National
Institute of Clinical Excellence (NICE) recommend the
initial use of diet and exercise and, when these fail to
maintain glycemic control, metformin should be
Published: 15 April 2004
Cost Effectiveness and Resource Allocation 2004, 2:2
Received: 09 June 2003
Accepted: 15 April 2004
This article is available from: />© 2004 Ward et al; licensee BioMed Central Ltd. This is an Open Access article: verbatim copying and redistribution of this article are permitted in all
media for any purpose, provided this notice is preserved along with the article's original URL.
Cost Effectiveness and Resource Allocation 2004, 2 />Page 2 of 9
(page number not for citation purposes)
prescribed [3]. Monotherapy with any treatment, how-
ever, is often unable to sustain target HbA
1c
levels of 6.5–
7.5% in the majority of patients. They are therefore
expected to require additional therapy within six years [4].
Sulphonylureas have been frequently used in combina-
tion with metformin, but are not always appropriate
choices as these may cause weight gain and increase the
risk of hypoglycaemia [3]. The development of newer
insulin secretagogues, such as nateglinide, provides physi-
cians with an alternative to sulphonylureas when selecting
the optimal combination of oral agents for an individual
patient. Nateglinide (120 mg three times per day) is
advantageous over other agents in that it helps to control
postprandial glucose (PPG) levels, along with glyco-
sylated hemoglobin, and also can be used in combination
with metformin (500 mg three times per day) [5]. The use
of combination therapy subsequent to the failure of mon-
otherapy helps some patients to achieve the recommend
levels of glycemic control. However, use of any combina-
tion is clearly also associated with an increased cost com-
pared with metformin as monotherapy.
The purpose of this study was to estimate the potential
long-term health and economic impact of adding nategli-
nide to metformin in order to improve glycemic control
and thereby reduce complication rates. Together with the
clinical data on the therapeutic efficacy of combination
therapy, these economic analyses facilitate assessment of
the long-term cost-effectiveness from the perspective of
the health care system, of using this combination to
achieve improved glycemic control.
Methods
Model framework
This model was developed to simulate the lifetime risk of
developing diabetes-related complications rates (microv-
ascular and macrovascular) in a cohort of patients diag-
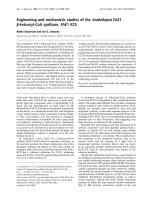
nosed with type 2 diabetes [6,7] (Figure 1). In this
updated version of the model, both the level of HbA
1c
(glycosylated haemoglobin) and two-hour postprandial
glucose (PPG) define the degree of glycemic control [8,9].
Each year of remaining life is simulated for all the patients
in the cohort and during each cycle, the patient is exposed
to the risks of developing each type of complication.
These risks are determined from the degree of glycemic
control, as well as other known risk factors, such as dura-
tion of diabetes.
The microvascular complications (nephropathy, retinop-
athy, and neuropathy) have several stages through which
each patient can progress. The most severe stages for the
microvascular complications are end stage renal disease,
blindness or amputations. The stages of a complication
are assumed irreversible – only progression to more severe
stages is possible. Complications such as hypoglycaemia
and foot ulcer were assumed to resolve in the course of
each cycle of one year. For the purpose of this model, mac-
rovascular complications (stroke and myocardial infarc-
tion) were considered as finite events, rather than
progressive conditions.
Each simulated patient had clinical characteristics that
were determined by the input distributions specified.
Using a Monte Carlo technique, each patient in the cohort
was assigned gender, race and age. The assignment of cho-
lesterol level, smoking status, body mass index and systo-
lic blood pressure was then determined using the
distributions and associations observed amongst patients
with type 2 diabetes [10-12].
For thirty annual cycles, the model checks each patient
who has survived to that point, and updates the age, dura-
tion of disease and HbA
1c
level. Over each cycle, the esti-
mated risks of developing a new complication or
progressing to the next stage of an established one are
assigned to each simulated patient in the cohort. During a
pre-model period of seven years, the patients were
allowed to accumulate complications but costs from man-
aging these complications are not considered in the
comparisons.
The model was assessed for face validity by clinical experts
and health authorities. Previous analyses using the model
have been evaluated by peer review [6-9]. Source data and
other independently obtained results were used as com-
parisons to determine predictive validity [2,13]. Model
results for relative risk over 10 years for all-cause mortality
and for microvascular disease and retinopathy at 12 years
were consistent with UKPDS patients in intensive and
conventional treatment groups.
Risk estimates
The risk of death in this updated model was linked to both
PPG and HbA
1c
levels. Weibull functions were derived
from the Diabetes Epidemiology: Collaborative Analysis
of Diagnostic Criteria in Europe (DECODE) study [14,15]
– and estimates were based on the patients' age, gender,
systolic blood pressure, total cholesterol, body mass
index, smoking status, and PPG level. As in the original
model, the risk of death was also assessed from the age-
and gender-dependent mortality for patients diagnosed
with type 2 diabetes [16], with an adjustment if nephrop-
athy develops [17,18]. The higher of these three death risk
estimates in each model cycle was applied.
The estimates for microvascular complications (nephrop-
athy, retinopathy, and neuropathy) were determined
from the available epidemiological studies [19-21] and
the risk gradients observed in the Diabetes Control and
Cost Effectiveness and Resource Allocation 2004, 2 />Page 3 of 9
(page number not for citation purposes)
Complications Trial (DCCT) were assumed to apply to
type 2 diabetes [22], an accepted assumption [23-25] con-
firmed by the UKPDS [2]. The risks of each microvascular
complication are estimated by adjusting each according to
the patient's HbA
1c
level at a specific point in time (risk =
1 - e
-λ-t
, where λ = λ
b
H
r
β
, and H
r
is the HbA
1c
value relative
to a standard and β is a complication-specific coefficient)
[16,26]. The base hazard for a complication depends on
factors such as duration of diabetes, race and for the retin-
opathy module, for example, also the probability of detec-
tion and treatment.
Evidence has recently been published that indicates PPG
is an independent predictor of the occurrence of macrov-
ascular complications, as well as of mortality [14,27,28].
In this updated model, the risk of stroke or myocardial
infarction was estimated using Weibull functions derived
from the DECODE study [15]. The risk equations derived
from the DECODE study include established risk factors
for macrovascular disease such as age, gender, systolic
blood pressure, total cholesterol, body mass index, smok-
ing status, as well as PPG level.
Costs
For each complication, the direct medical costs were esti-
mated for the immediate impact of the event (costs arising
in the year the event occurs) and the subsequent impact of
the complication (costs accrued in years subsequent to the
year of the event). Clarke et al combined resource use data
collected from the UKPDS with cost estimates for these
services, and published regression equations for estimat-
ing the cost of major complications [29]. The annual hos-
pital in-patient costs, and non-hospital costs (general
practioners, nurses, podiatrists, opticians, dieticians, hos-
pital outpatient clinics) were estimated using these regres-
sion equations for the event year and subsequent years. As
the inpatient costs were estimated for myocardial infarc-
tion, stroke, blindness, or an amputation. The inpatient
costs of less severe stages of these complications were not
included in these estimates the cost estimates are quite
conservative. All complication costs are expressed in 1999
Schematic representation of model (Reprinted with permission from Can J DiabetesFigure 1
Schematic representation of model (Reprinted with permission from Can J Diabetes. 2003; 27(1): 33–41).
Create
population
•Age
•Gender
•Ethnicity
•Lipids
•Smoking
•SBP
Record time
of death
Record time
of death
Tally
management
costs
Update glycemic parameters: HbA
1c
PPG
Determine
risks
•Death
•Complications
Determine
risks
•Death
•Complications
Increase
age
Update
status
Update
status
Record
time
Tally
costs
Y
Occurs?
N
Record
time
Tally
costs
Y
Occurs?
N
Occurs?
N
•MI
•Stroke
• Renal
• Hypoglycemia
• Foot ulcers
•Neuropathy
•Eye
•MI
•Stroke
• Renal
• Hypoglycemia
• Foot ulcers
•Neuropathy
•Eye
Y
N
For
Each
patient
For
each
complication
Alive ?
Ledgen
MI = myocardial infarction
N = no
PPG = postprandial plasma glucose
SBP = systolic blood pressure
Y = yes
Cost Effectiveness and Resource Allocation 2004, 2 />Page 4 of 9
(page number not for citation purposes)
Great Britain Pounds (£1 GBP = $1.7 USD = €1.4 Euros).
It should be noted that the cost of end stage renal disease
was estimated based on data from 1996 [30]. We elected
not to inflate this cost, however, as the applicability of
general inflation rates to something as specialized as the
management of end stage renal disease is fraught with
inaccuracy and this was the most expensive complication
(£21,456 per year).
The drug treatment cost estimates conservatively assumed
full compliance with the treatment. The daily cost for met-
formin (1500 mg per day) was £0.07 [31], and £0.87 for
the combination of nateglinide (360 mg/day = £0.80)
with metformin (1500 mg per day) [31].
Analyses
The distributions of HbA
1c
and PPG at the beginning of
the model period, as well as the effects of each treatment
regimen were obtained from a clinical trial assessing the
efficacy of combining nateglinide (360 mg/day) with met-
formin (1500 mg per day) compared with metformin
alone [5] (Table 1). The mean HbA
1c
at baseline was 8.4%,
at the trial end point the HbA
1c
was reduced with both
metformin and for the combination (-0.8%, and -1.5%
respectively), as was the PPG level (-0.9, and -2.3
respectively).
After processing each cohort of 10,000 patients over thirty
years, the model provides estimates of the mean survival
time, the frequency of each type of complication, and the
mean accumulated complication and treatment costs per
patient. Survival time is also weighted by the quality of
life; the utility assigned depending on the complications
present. The utilities assigned were as follows; amputation
0.50, stroke 0.62, blindness 0.71 and myocardial infarc-
tion 0.73 [32], end stage renal disease 0.59 [33]. The cost
per life year gained (LYG) and cost per quality adjusted
life year (QALY) was determined. Consistent with NICE
recommendations, costs were discounted at 6% and ben-
efits at 1.5% [34]. Sensitivity analyses were conducted on
model parameters and uncertainty in the base case esti-
mates was examined using the bootstrap technique with
250 model replications, and 1000 re-samples from the
results of these simulations.
Results
Our analyses simulated a cohort of patients treated with
metformin and estimated the mean survival time to be
13.5 years. Over their lifetime, microvascular complica-
tions were frequent – retinopathy was the most common
affecting over a quarter of the patients, as well as foot
ulcers and microalbuminuria (Table 2). The model pre-
dicted mean lifetime discounted costs per patient of about
five thousand pounds (Table 3). Macrovascular disease
was common (Table 2) and accounted for about 40% of
the lifetime costs due to complications, with myocardial
infarction being the slightly larger component of the mac-
rovascular costs (63%). Amputation comprised one third
of the cost estimate for management of microvascular
complications.
Base case
The improvement in glycemic control, in terms of both
the HbA
1c
and the PPG, expected with the combination
nateglinide with metformin is estimated to increase sur-
vival on average 0.39 years per patient (0.32 discounted
years) or 0.46 (0.37 discounted) QALY (Table 3). Moreo-
ver, complications were expected to occur less frequently,
or at least progress more slowly (Table 2).
Combination therapy is expected to reduce the frequency
of complications and prolong survival, but also increase
the average costs by an average of £2,066 per patient. To
determine the impact of the nateglinide-metformin com-
bination on the cost of managing complications, the dif-
ference in mean cost between metformin alone and the
combination group was determined (Table 3). Thus, sav-
ings of £464 were estimated regarding the lifetime cost of
managing complications. These arise mainly from a
reduction in the costs of treating end stage renal disease
(72%) and neuropathy (19%). The increase in the treat-
ment costs due to combination therapy are therefore pre-
dicted to be partially offset by this reduction in the cost of
managing complications, leaving an increment of £2,066
in the lifetime costs per patient (Table 3). This translates
into a cost-effectiveness ratio of £6,772 (95%CI: £6,134
to 7,464) per additional discounted year of life, and
£5,609 per discounted QALY.
Table 1: Clinical characteristics of simulated cohort
Parameter Value
Age (years)
Mean 58
Range 29–88
Gender (% Female) 38%
Race
Caucasian 92%
Afro-Caribbean 4%
Asian 4%
Initial resulting HbA
1c
level (mean)
Metformin monotherapy 7.6%
Combination therapy 6.9%
HbA
1c
annual upward drift 0.15%
Cost Effectiveness and Resource Allocation 2004, 2 />Page 5 of 9
(page number not for citation purposes)
Sensitivity analyses
The model inputs were varied to reflect different scenarios
and Table 4 shows the impact on the estimates. The degree
of upward drift of HbA
1c
and initial HbA
1c
were influential
parameters. If a population with higher glycemic levels at
baseline is modeled, a larger proportion of the cohort
develops severe complications on metformin alone. Vary-
ing the discount rate had a major effect on the cost-effec-
tiveness results.
Varying the efficacy of the combination of nateglinide and
metformin on PPG values had a minor effect, a 50%
reduction in efficacy led to a 3% increase in macrovascular
disease related costs. Varying the impact of the combina-
Table 2: Frequency of microvascular and macrovascular complications by treatment
Complication Metformin (/100 pt) Combination (/100 pt) Improvement
Absolute Relative (%)
Nephropathy
Microalbuminuria 21.1 18.1 3.0 14.2
Gross proteinuria 18.8 13.4 5.4 28.7
End stage renal disease 5.9 4.4 1.5 25.4
Retinopathy
Background retinopathy 30.7 23.7 7.0 22.7
Macular edema:
Detected 25.4 20.6 4.7 18.7
Photocoagulated 24.3 19.9 4.5 18.4
Proliferative retinopathy:
detected 12.3 7.9 4.5 36.3
photocoagulated 12.1 7.7 4.4 36.3
Blindness 9.4 8.0 1.4 14.9
Neuropathy
Foot ulcer 21.1 16.3 4.8 22.7
Neuropathy 12.7 9.6 3.2 24.8
1
st
Lower-extremity
amputation
9.0 7.5 1.5 16.5
2
nd
Lower-extremity
amputation
5.1 4.3 0.7 14.6
Macrovascular Disease
Myocardial infarction 15.0 14.6 0.4 2.4
Stroke 13.7 13.4 0.3 1.9
Table 3: Health benefits and costs for metformin and the combination of metformin with nateglinide
Metformin Combination Difference
Cumulative cost (mean per
patient)
Complications £3,548 £3,084 £-464
Total £5,093 £7,159 £2,066
Survival (mean, years)
Life years (discounted) 13.5 (11.7) 13.9 (12.1) 0.39 (0.32)
Quality Adjusted (discounted) 12.2 (10.7) 12.6 (11.0) 0.46 (0.37)
Cost-effectiveness
Cost per LYG (discounted
LYG)
£5,403 (6,772)
Cost per QALY (discounted
QALY)
£4,500 (5,609)
LYG = Life Year Gained QALY = Quality Adjusted Life Year
Cost Effectiveness and Resource Allocation 2004, 2 />Page 6 of 9
(page number not for citation purposes)
tion of nateglinide and metformin treatment on HbA
1c
values had a larger impact on the total cost predicted.
Decreasing the efficacy by 10%, or 25% led to total cost
increases of 3%, and 9%, respectively. Also a 10% increase
in efficacy led to a 4% decrease in costs.
Discussion
Improving glycemic control using combination therapy
will inevitably increase drug treatment costs when com-
pared with monotherapy. However, the reduction in
HbA1c and PPG levels when treating patients with type 2
diabetes with a combination of nateglinide and met-
formin has the potential to translate into reduced compli-
cation rates. Long term therefore, combination treatment
is likely to result in substantial offsets in overall costs.
Thus, the additional glycemic control is achieved at a rate
of £6,772 per year of additional life, an estimate generally
considered cost-effective [35].
These results are consistent with the evidence emerging
from the UK. Diabetes-related complications have been
shown in several UK studies to require expensive medical
interventions, frequently provided in a hospital inpatient
setting [36-39]. The UKPDS demonstrated that keeping
Table 4: Sensitivity analysis
Change in Outcome CER
Parameter Net Cost LYG QALY Cost/LYG Cost/QALY
Base values £2,066 0.32 0.37 £6,772 £5,609
Age (mean)
46.5 years £2,531 0.34 0.45 £7,476 £5,589
82.5 years £718 0.14 0.12 £5,303 £5,804
Cost of complications
+20% £1,973 0.32 0.37 £6,213 £5,357
-20% £2,159 0.32 0.37 £6,799 £5,861
Duration of disease
before oral agent
prescribed
5 years £2,101 0.27 0.33 £7,680 £6,320
10 years £1,971 0.31 0.35 £6,260 £5,553
Utilities
+20% £2,066 0.32 0.36 £6,506 £5,807
-20% £2,066 0.32 0.38 £6,506 £5,426
Race
100% Caucasian £2,105 0.31 0.36 £6,686 £5,771
HbA1c level
HbA1c before
prescription = 9.4%
£1,782 0.37 0.42 £4,784 £4,287
Metformin = 8.6%
Combination = 7.9%
HbA1c before
prescription = 7.9%
£2,184 0.28 0.34 £7,904 £6,516
Metformin = 7.1%
Combination = 6.4%
HbA1c upward drift
Metformin = 1.5%;
Combination = 0%
£1,478 0.54 0.65 £2,761 £2,272
Metformin = 0%;
Combination = 0%
£2,307 0.28 0.31 £8,336 £7,338
HbA1c drift delay
Metformin = 0 years;
Combination = 1 year
£1,987 0.35 0.41 £5,715 £4,870
Discount
Cost = 3%; Benefit =
3%
£2,420 0.26 0.30 £9,319 £8,058
Cost = 6%; Benefit =
6%
£2,066 0.18 0.21 £11,369 £9,888
Cost = 6%; Benefit =
0%
£2,066 0.39 0.46 £5,237 £4,500
Cost Effectiveness and Resource Allocation 2004, 2 />Page 7 of 9
(page number not for citation purposes)
glucose levels near normal decreased the incidence of
microvascular complications over ten years [40]. In addi-
tion, cost-effectiveness analyses based on the UKPDS
results indicate the costs of managing complications
would be expected to be reduced, [41,42] and, specifi-
cally, intensive blood glucose control with metformin is
predicted to result in lower complications costs amongst
overweight patients [42]. The DCCT results showed
improved glycemic control can lower microvascular com-
plication rates in patients with type 1 diabetes, and one
key assumption of this model is that these rates also apply
to type 2 diabetes. This assumption was demonstrated to
be tenable by similar findings in the UKPDS [2,3]. This
model predicts comparable results to those of the UKPDS
patients in the intensive and conventional treatment
groups in terms of relative risk over ten years for microv-
ascular disease or retinopathy at 12 years.
The economic implications of combination therapy
depend to some extent on the characteristics of the cohort
analyzed. For example, the sensitivity analyses illustrate
that greater savings are predicted for patients diagnosed
when they are young, with longer duration of disease and
poorer glycemic control initially. These characteristics
tend to identify patients at higher risk of developing com-
plications later on.
Macrovascular disease is predicted to be the major com-
ponent of the costs accounting for over one third of the
costs accrued over a lifetime from managing diabetes
related complications. This is of particular importance as
these complications tend to arise earlier in the course of
the disease than those that are microvascular in nature,
and are the leading cause of death [43,44]. Thus, from
both the clinical and economic perspectives, it is impor-
tant that in addition to glycemic control, any risk factors
for cardiovascular disease that are known to be modifiable
are managed such as smoking cessation, reducing obesity,
high blood pressure and hypercholesterolaemia [3,45].
The equations developed for predicting the risk of stroke
and of myocardial infarction included the PPG level.
These predictions are based on the results of the DECODE
study that investigated the prevalence of macrovascular
disease and mortality in Europe [14,28,46]. Thus, the
assumption in the model that reducing PPG levels will
reduce the risk of macrovascular disease remains to be
proven conclusively[3,47].
The long-term predictions were based on the efficacy of
combining nateglinide with metformin demonstrated in
clinical trials [5]. Even though these analyses were based
on the efficacy observed in a randomized, controlled trial,
it was necessary to make some assumptions about long-
term glycemic control. Given the lack of specific data on
the combination over longer timeframes, it was assumed
that after the initial improvement in glycemic control, the
HbA
1c
would begin to drift upward as it did with met-
formin and other hypo glycemic agents employed in the
UKPDS [4,48]. This is a conservative assumption as it is
quite possible that with the combination there will be a
slower, or at least delayed, upward drift.
The cost inputs for these economic analyses were limited
to only the most severe stages of the complications. This
was done in order to accord with the estimates' source, the
UKPDS. The costs also did not include the less severe
stages of the complications (such as gross proteinuria,
foot ulcers or photocoagulation). Similarly, the macrovas-
cular costs do not include the management of milder con-
ditions such as angina or transient ischaemic attacks.
Thus, the cost estimates are quite conservative implying
that the savings are underestimated.
Conclusion
In conclusion, prescribing the combination of nateglinide
and metformin for patients who are not maintaining
good glycemic control on monotherapy alone should be
cost-effective, as the combination is expected to reduce
the rates of diabetes-related complications at an accepta-
ble additional cost. Long-term data are needed to confirm
these predictions.
Competing interests
Caro Research of which Jaime Caro is a shareholder,
received a grant from Novartis Pharma AG, (United King-
dom), which provided funding for portions of the study.
Authors' contributions
All authors participated in the design of the study and
interpreted the results. All authors have read and
approved the final draft of this manuscript. AW and MS
conducted the analyses and drafted the manuscript.
References
1. Bagust A, Hopkinson PK, Maslove L, Currie CJ: The projected
health care burden of Type 2 diabetes in the UK from 2000
to 2060. Diabetic Medicine 2002, 19:1-5.
2. UK Prospective Diabetes Study Group: Intensive blood-glucose
control with sulphonylureas or insulin compared with con-
ventional treatment and risk of complications in patients
with type 2 diabetes (UKPDS 33). Lancet 1998, 352:837-53.
3. McIntosh A, Hutchinson A, Home PD, Brown F, Bruce A, Damerell
A, Davis R, Field R, Frost G, Marshall S, Davis R, Roddick J, Tesfayes
S, Withers H, Suckling R, Smith S, Griffin S, Kaltenthaler E, Peters J:
Clinical guidelines and evidence review for Type 2 diabetes:
blood glucose management. Sheffield: Sc HARR, University of
Sheffield 2001.
4. Turner R, Cull C, Frighi V, Holman RR: Glycemic control with
diet, sulfonylurea, metformin, or insulin in patients with type
2 diabetes mellitus. Progressive requirement for multiple
therapies (UKPDS 49). JAMA 1999, 281:2005-12.
5. Horton ES, Clinkingbeard C, Gatlin M, Foley J, Mallows S, Shen S:
Nateglinide alone and in combination with metformin
improves glycemic control by reducing mealtime glucose
levels in type 2 diabetes. Diabetes Care 2000, 23:1660-65.
Cost Effectiveness and Resource Allocation 2004, 2 />Page 8 of 9
(page number not for citation purposes)
6. Caro JJ, Klittich WS, Raggio G, Kavanagh P, O'Brien J, Shomphe LA,
Flegel KM, Copley-Merriman C, Sigler C: Economic assessment of
troglitazone as an adjunct to sulfonylurea therapy in the
treatment of type 2 diabetes. Clin Ther 2000, 22:116-27.
7. Caro JJ, Ward A, O'Brien J: Lifetime Costs of Complications
Resulting from Type 2 Diabetes in the U.S. Diabetes Care 2002,
25:476-81.
8. Salas M, Ward A, Caro J: Health and economic effects of adding
nateglinide to metformin to achieve dual control of glyco-
sylated hemoglobin and postprandial glucose levels in a
model of type 2 diabetes mellitus. Clin Ther 2002,
24(10):1690-705.
9. Caro JJ, Salas M, Ward AJ, Raggio G, O'Brien JA, Gruger J: Combi-
nation therapy for Type 2 Diabetes: What are the potential
health and cost implications in Canada? Canadian Journal of
Diabetes 2003, 27(1):33-41.
10. Cowie CC, Harris MI: Physical and metabolic characteristics of
persons with diabetes. In Diabetes in America 2nd edition. National
Diabetes Data Group. Bethesda, MD, National Institutes of Health,
National Institute of Diabetes and Digestive and Kidney Diseases,
(NIH publ. No. 95–468; 1995:117-64.
11. Fujimoto WY: Diabetes in Asian and Pacific Islander Ameri-
cans. In Diabetes in America 2nd edition. National Diabetes Data
Group. Bethesda, MD: National Institutes of Health, National Insti-
tute of Diabetes and Digestive and Kidney Diseases, NIH publ. no 95–
468; 1995:661-82.
12. Rewers M, Hamman RF: Risk factors for non-insulin-dependent
diabetes. In:Diabetes in America 2nd edition. National Diabetes Data
Group, National Institutes of Health, NIH publication No 95–1468;
1995:179-220, 619.
13. Eastman RC, Seibert CW, Harris , Gorden P: Implications of the
Diabetes Control and Complications Trial. Diabetes Care 2001,
24:S28-S32.
14. DECODE Study Group: Glucose tolerance and cardiovascular
mortality. Comparison of fasting and 2-hour diagnostic
criteria. Arch Intern Med 2001, 161:397-404.
15. Glick H: The potential for CVD prevention by reducing post-
prandial hyperglycaemia. In Proceedings of the IDEG: Acapulco
2000.
16. Eastman RC, Javitt JC, Herman WH, Dasbach EJ, Zbrozek AS, Dong
F, Manninen D, Garfield SA, Copley-Merriman C, Maier W, Eastman
JF, Kotsanos J, Cowie CC, Harris M: Model of complications of
NIDDM. I. Model construction and assumptions. Diabetes Care
1997, 20:725-34.
17. Mogensen CE: Microalbuminuria predicts clinical proteinuria
and early mortality in maturity-onset diabetes. N Engl J Med
1984, 310:356-60.
18. Neil A, Hawkins M, Potok M, Thorogood M, Cohen D, Mann J: A
prospective population-based study of microalbuminuria as
a predictor of mortality in NIDDM. Diabetes Care 1993,
16:996-1003.
19. Ballard DJ, Melton LJ, Dwyer MS, Trautmann JC, Chu CP, O'Fallon
WM, Palumbo PJ: Risk factors for diabetic retinopathy: a popu-
lation-based study in Rochester, Minnesota. Diabetes Care
1986, 9:334-42.
20. Humphrey LL, Palumbo PJ, Butters MA, Hallett JW, Chu CP, O'Fallon
M, Ballard DJ: The contribution of non-insulin dependent dia-
betes to lower extremity amputation in the community. Arch
Intern Med 1994, 154:885-92.
21. Klein R, Klein BE, Moss SE, Davis MD, DeMets DL: The Wisconsin
Epidemiologic Study of Diabetic Retinopathy. Arch Ophthalmol
1989, 107:244-49.
22. The Diabetes Control and Complications Trial Research Group: The
effect of intensive treatment of diabetes on the development
and progression of long-term complications in insulin-
dependent diabetes mellitus. N Engl J Med 1993, 329:977-86.
23. Nathan DM: Long-term complications of diabetes mellitus. N
Engl J Med 1993, 328:1676-85.
24. American Diabetes Association: Implications of the Diabetes
Control and Complications Trial. Diabetes Care 2001, 24:S2832.
25. Pollet RJ, El-Kebbi IM: The applicability and implications of the
DCCT to NIDDM. Diabetes Rev 1994, 2:413-27.
26. Eastman RC, Javitt JC, Herman WH, Dasbach EJ, Copley-Merriman C,
Maier W, Dong F, Manninen D, Zbrozek AS, Kotsanos J, Garfield SA,
Harris M: Model of complications of NIDDM. II. Analysis of
the health benefits and cost-effectiveness of treating NIDDM
with the goal of normoglycemia. Diabetes Care 1997, 20:735-44.
27. Barrett-Connor E, Ferrara A: Isolated postchallenge hyperglyc-
emia and the risk of fatal cardiovascular disease in older
women and men: the Rancho Bernardo Study. Diabetes Care
1998, 21:1236-39.
28. The DECODE Study Group on behalf of the European Diabetes Epi-
demiologyGroup: Glucose tolerance and mortality: compari-
son of WHO and American Diabetes Association diagnostic
criteria. Lancet 1999, 354:617-21.
29. Clarke P, Gray A, Legood R, Briggs A, Holman R: The impact of
diabetes-related complications on healthcare costs: results
from the United Kingdom Prospective Diabetes Study
(UKPD Study No. 65). Diabetic Medicine 2003, 20:442-450.
30. Lamping DL, Constantinovici N, Roderick P, Normand C, Henderson
L, Harris S, Brown E, Gruen R, Victor C: Clinical outcomes, qual-
ity of life, and costs in the North Thames Dialysis Study of
elderly people on dialysis: a prospective cohort study. Lancet
2000, 4(356 (9241)):1543-50.
31. Monthly Index of Medical Specialties. Haymarket Publishing
Services Ltd; 2002.
32. Clarke P, Gray A, Holman R: Estimating utility values for health
states of type 2 diabetic patients using the EQ-5D (UKPDS
62). Med Decis Making 2002, 22:340-49.
33. Lawrence WF, Grist TM, Brazy PC, Fryback DG: Magnetic reso-
nance angiography in progressive renal failure: a technology
assessment. Am J Kidney Dis 1995, 25:701-709.
34. Guidance for manufacturers and sponsors (N0014). National
Institute of Clinical Excellence 2001.
35. Review of completed technology appraisals 2000/2001. Item 3
National Institute of Clinical Excellence Annual Public Meeting . 18 July
2001.
36. Alexander W, and South East Thames Diabetes Physicians Group:
Diabetes care in a UK Health Region: Activity, facilities and
costs. Diabet Med 1988, 5:577-81.
37. Currie CJ, Williams DR, Peters JR: Patterns of in and out-patient
activity for diabetes: a district survey. Diabet Med 1996,
13:273-80.
38. Currie CJ, Morgan CLL, Peters JR: The epidemiology and cost of
inpatient care for peripheral vascular disease, infection, neu-
ropathy, and ulceration in diabetes. Diabetes Care 1998, 21:42-8.
39. Morgan CL, Currie CJ, Hunt J, Evans JD, Rogers C, Stott N, Peters JR:
Relative activity and referral patterns for diabetes and non-
diabetes in general practice. Diabet Med 2000, 17:230-5.
40. UK prospective diabetes study (UKPDS) group: Effect of intensive
blood-glucose control with metformin on complications in
overweight patients with type 2 diabetes (UKPDS 34). Lancet
1998, 352:854-65.
41. Gray A, Raikou M, McGuire A, Fenn P, Stevens R, Cull C, Stratton I,
Adler A, Holman R, Turner R, on behalf of the UKPDS study group:
Cost effectiveness of an intensive blood glucose control pol-
icy in patients with type 2 diabetes: economic analysis along-
side randomised controlled trial (UKPDS 41). BMJ 2000,
320:1373-78.
42. Clarke P, Gray A, Adler A, Stevens R, Raikou M, Cull C, Stratton I,
Holman R: Cost-effectiveness analysis of intensive blood-glu-
cose control with metformin in overweight patients with
Type II diabetes (UKPDS No 51). Diabetologia 2001,
44(3):298-304.
43. Walters DP, Gatling W, Houston C, Mullee MA, Julious SA, Hill RD:
Mortality in diabetic subjects: an eleven year follow-up of a
community based population. Diabet Med 1994, 11:968-73.
44. Morrish NJ, Stevens LK, Head J, Fuller H, Jarrett , Keen H: A pro-
spective study of mortality among middle-aged diabetic
patients (the London cohort of the WHO Multinational
Study of Vascular Disease in Diabetics) I: causes and death
rates. Diabetologia 1990, 33:538-41.
45. Turner RC, Millns H, Neil HA, Stratton IM, Manley SE, Matthews DR,
Holman RR, for the United Kingdom Prospective Diabetes Study
Group: Risk factors for coronary artery disease in non-insulin
dependent diabetes mellitus: United Kingdom prospective
diabetes study (UKPDS 23). BMJ 1998, 316:823-8.
46. The DECODE Study Group: Consequences of the new diagnos-
tic criteria for diabetes in older men and women. Diabetes Care
1999, 22:1667-71.
Publish with BioMed Central and every
scientist can read your work free of charge
"BioMed Central will be the most significant development for
disseminating the results of biomedical research in our lifetime."
Sir Paul Nurse, Cancer Research UK
Your research papers will be:
available free of charge to the entire biomedical community
peer reviewed and published immediately upon acceptance
cited in PubMed and archived on PubMed Central
yours — you keep the copyright
Submit your manuscript here:
/>BioMedcentral
Cost Effectiveness and Resource Allocation 2004, 2 />Page 9 of 9
(page number not for citation purposes)
47. American Diabetes Association: Postprandial blood glucose. Dia-
betes Care 2001, 24:775-8.
48. Turner R, Cull C, Holman R, United Kingdom Prospective Diabetes
Study 17: A 9-year update of a randomized, controlled trial on
the effect of improved metabolic control on complications in
non-insulin dependent diabetes mellitus. Ann Intern Med 1996,
124:136-45.