Báo cáo y học: "The attrition rate of licensed chiropractors in California: an exploratory ecological investigation of time-trend data" docx
Bạn đang xem bản rút gọn của tài liệu. Xem và tải ngay bản đầy đủ của tài liệu tại đây (676.49 KB, 9 trang )
HYPOTHES IS Open Access
The attrition rate of licensed chiropractors in
California: an exploratory ecological investigation
of time-trend data
Stephen M Foreman
*†
, Michael J Stahl
†
Abstract
Background: The authors hypothesized the attrition rate of licensed chiropractors in California has gradually
increased over the past several decades. “Attrition” as determined for this study is defined as a loss of legal
authority to practice chiropractic for any reason during the first 10 years after the license was issued. The
percentage of license attrition after 10 years was determined for each group of graduates licensed in California
each year between 1970 and 1998. The cost of tuition, the increase in the supply of licensed chiropractors and the
ratio of licensed chiropractors to California residents were examined as possible influences on the rate of license
attrition.
Methods: The attrition rate was dete rmined by a retrospective analysis of license status data obtained from the
California Department of Consumer Affairs. Other variables were determined from US Bureau of Census data,
survey data from the American Chiropractic Association and catalogs from a US chiropractic college.
Results: The 10-year attrition rate rose from 10% for those graduates licensed in 1970 to a peak of 27.8% in 1991.
The 10-year attrition rate has since remained between 20-25% for the doctors licensed between 1992-1998.
Conclusions: Available evidence supports the hypothesis that the attrition rate for licensed chiropractors in the
first 10 years of practice has risen in the past several decades.
Background
A chiropractic license, issued by a governmental regula-
tory body, is the certification required to transition the
graduate from academic study into the world of unsu-
pervised practical application. The need for the license
is paramount for without it the graduate remains a
highly educated layman without unrestricted clinical
practice rights. The ongoing maintenance of an active
license in California requires several duti es; the payment
of an annual fee, the time and expense of yearly conti-
nuing education study and practicing within the guide-
lines of the license [1]. Failure to meet anyone of these
duties can result in license restriction, suspension or
revocation.
The loss of legal practice rights for any reason rep-
resents a major interruption in the chiropractor’ s
professional career and may signify their complete exit
from the profession. Reasons for license loss vary greatly
and can include a move to another license jurisdiction,
personal illness or disability, employment in other pro-
fessions/jobs, disciplinary action against the license for
improper behavior, retirement and even death of the
doctor. The authors expected these various non-finan-
cial reasons for license loss to remain fairly consistent
over the years.
The authors hypothesized the current attrition rate of
licensed chiropractors has not been consistent and is
now higher than the rate observed in past years. A rising
attrition rate of l icensees may be linked to a number of
forces such as changes in population, an oversupply
of chiropractors, changes in reimbursement, the cost of
education and general dissatisfaction with the profes-
sion. Detection and documentation of a rising attrition
rate within the profession may stimulate investigation to
identify the causes and help set educational and license
policies.
* Correspondence:
† Contributed equally
Private practice of chiropractic, West Hills, California, USA
Foreman and Stahl Chiropractic & Osteopathy 2010, 18:24
/>© 2010 Foreman and Stahl; licensee BioMed Central Ltd. This is an Open Access article distributed under the terms of the Creative
Commons Attribution License (ht tp://creative commons.org/licenses/by/2.0), which permits unrestricted use, di stribution, and
reproduction in any medium, provided the original work is properly cited.
Our examination of the license attrition rates required
the selection of a point in time to represent an earlier
than expected loss of practice rights. The ten-year anni-
versary of initial license issuance was chosen for each
yearly license group as this appeared to allow time for
the newly licensed doctor to work with an experienced
doctor, gain professional experience and business skills,
obtain funding to open an office and, if desired, estab-
lish his/her own practice. The passage of 10 years also
allowedtimeforthedoctortoincreasethenumberof
patients they serve and become financially established in
the community. A loss of practice rights in less than
10 years was believed to possibly represent a premature
departure from the profession and inconsistent with the
time, effort and expense devoted to education and earn-
ing a license.
Methods
The authors hypothesized the trend of license attrition
was rising during the study period from 1970 to 1998
and chose to observe the actual time-trend with an eco-
logically based exploratory analysis [2]. Collection of the
data-points for the time-trend analysis required a review
of the current license status for each chiropractic license
issued between 1970 and 1998. The California Depart-
ment of Consumer Affairs (DCA) maintains an online
searchable database [3] that contains the current license
status of all licensed chiropractors in California. Califor-
nia was chosen for study for a number of reasons
including the large number o f chiropractic colleges in
the State during the past 28 years (n = 8), the large
State population, its geographic size and the fact Califor-
nia has the greatest number of licensed chiropractors
out of the estimated 69,000 chiropractors in the United
States [4].
A “valid” status license allows the chiropractor to leg-
ally provide care. Other DCA license categories t hat do
not allow licensed practice include “revoked, cancelled,
inactive, voluntary suspension, forfeiture and deceased.”
The doctor may choose to reactivate a license that is
inactive or in forfeiture status. The data obtained for
this study from DCA does not allow determination of
issues such as which doctors may have allowed their
license to expire and are now practicing in other states,
which doc tors are in full-time versus part-time practice
or the identity of doctors that may have left pract ice but
are now employed in academia or related areas.
The authors obtained data from the DCA databa se for
each chiropractor licensed between January 1, 1970 and
November 7, 1998 (n = 14,922). The doctors licensed
during 1970 (n = 126) were grouped and sorted accord-
ing to the date their l icense expired and was listed as
other than “v alid.” Analysis of the group licensed during
1970 revealed 12 doctors listed as other than “valid” for
an attrition rate of 10% between 1/1/70 and 12/31/79.
This grouping and sorting process was repeated for
those graduates license d each year until 1998. The 10-
year attrition percentage was calculated for each yearly
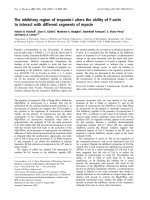
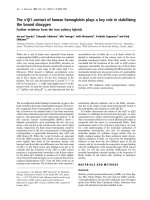
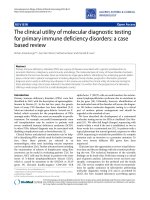
license group and the results were plotted (Figure 1).
Analysis of the DCA database revealed a higher attrition
rate for t hose doctors licensed in the 1980s and 1990s
compared to their counterparts licensed in the 1970s.
Attrition after 10 years for those licensed during 1970
was 10% and this rate continued to trend upward to a
peak of 27.8% by 1991, an increase of 178%. The 10-
year attrition rate since 1991 has reduced from its peak
Figure 1 Percentage of license attrition, 1970-1998. A graphical depiction of the percentage of chiropractors without practice rights 10 years
after the license was issued. The range was 10% in 1970 and a peak of 27.8% in 1991. The 10-year attrition rate has since remained between 20-
25% for the doctors licensed between 1992-1998.
Foreman and Stahl Chiropractic & Osteopathy 2010, 18:24
/>Page 2 of 9
but remained between 20-25% for the doctors licensed
between 1992-1998.
Analysis
Potential influences on the attrition rate trend
Documenting factors that m ay have contributed to
increasing attrition rate may help identify root c auses
and shape future publi c and professional policy deci-
sions. Although the ultimate causes of the increased
attrition for each individual are unknown, previously
published studies of the chiropractic profession provided
insight and reason able areas for future investigat ion. For
example, Mior and Laporte’s [5] ec onomic and resource
assessment of chiropractors practicing in Ontario,
Canada between 1990 and 2004 revealed a “ long-run
oversupply of doctors that outpaced the increase in
population.” The number of registere d chiropractors in
Ontario doubled during their study period. The over-
supply situation was paralleled by a re duction of an nual
net income from $97,892 in 1992-93 to $48,900 in
2002-03. Mior and Laporte concluded, “Chiropractors
who cannot meet their operating costs and achieve a
reasonable return on their investment in training will
drop out of the market.” These findings led us to inves-
tigate changes in the ratio of the domestic population
and the number of licensed chiropractors in California
during our study period.
Information from the United States Bureau of Census
provided the percentage of change in California popula-
tion each year between 1970 and 1998 [6]. California
experienced a growth in residential population during
each year between 1970 and 1998, the largest being
2.6% in 1981 and the lowest being 0.7% in 1995. The
total residential population between 1970 and 1998 rose
65.1% from 19,971,071 to 32,987,675. The steady and
gradual population increase each year would argue
against it as a catalyst in the rising attrition rate for
chiropractors. The steady change in residential popula-
tion led us to investigate the changes in the number of
licensed chiropractors in California since 1970.
Changes in the number of licensed chiropractors
Mior and Laporte [5] noted a doubling of the licensed
chiropractors in their Canadian study and a resultant
reduction in both doctor/patient ratio and net annual
income. These findings directed our study in Cal ifornia.
The DCA database was reviewed to determine the total
number of valid chiropractic licenses in California each
year between 1970 and 1998. As was observed in the
Canadian study, the number of chiropractors in Califor-
nia grew and there was drop in the doctor/patient ratio.
The DCA database revealed 4274 active chiropractic
licenses in 1970, which grew to 11,637 by the end of the
study period in 1998. The 170% growth rate in chiro-
practors during the study far exceeds the 65.1% increase
in residential population. As will be discussed, the dis-
proportion between the two growth rates resulted in a
decrease in the doctor/patient ratio.
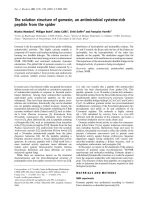
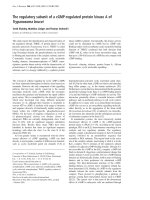
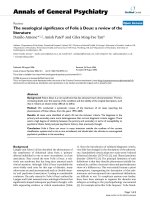
The DCA database also revealed the rate of yearly per-
centage i ncrease in licensed chiropractors in California
between 1970 and 19 98 was not linea r. (Figure 2) The
total number of licensees in the early portion of the
1970s actually decreased year-to-year. The total number
of licensed chiropractors decreased in 1971, 1972, 1973
and 1975, the largest drop of 3.9% occurring in 1972.
Large increases in licensees of 7.1% and 8.6% respec-
tively in 1978 and 1979 eliminated the reductions seen
earlier in the decade. In total, the number of licensed
chiropractors rose from 4274 in 1970 to 4583 in 1979, a
rise of 7.2%. Unlike the 1970s, the 1980s saw unprece-
dented increases in the number of licensed chiroprac-
tors. The smallest year-to-year increase of 4.7% was
noted in 1984 and the largest increase w as 11.4% in
1985. The DCA data revealed the number of licensed
chiropractors rose from 4978 in 1980 to 8671 in 1989, a
rise of 74.1% during that single decade. Although the
largest surge in licensees had peaked in the 1980s, there
was still an increase in licensees between 1990 and
1999. The number of licensed chiropractors rose from
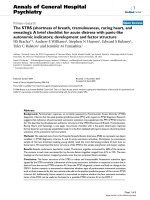
9124 in 1990 to 12,043 in 1999, a rise of 31.9%. Finally,
the total, the number of licensed chiropractors rose
Figure 2 Percentage of yearly increase/decrease in chiropractors. The total number of licensed chiropractors decreased in 1971, 1972, 1973
and 1975, the largest drop of 3.9% occurring in 1972. The largest increase was 11.4% in 1985.
Foreman and Stahl Chiropractic & Osteopathy 2010, 18:24
/>Page 3 of 9
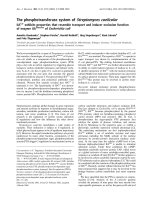
from 12,441 in 2000 to 13,822 in 2008, a rise of 11.5%.
(Figure 3)
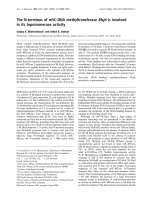
Calcu lation of the growth rate in chiropractors during
the 1970s, 1980s and 1990s obscures th e larger impact
of the total increase over the entire study period. In
total, the number of licensed chiropractors rose from
4306 in 1970 to 11,637 in 1998, a rise of 170.2%. The
total number of active licenses has continued to rise
beyond the 1998 end of the study period and was
13,822 in 2008. (Figure 4)
The overall increase in licensed chiropractors of
170.2% from 1970 to 1998 far outpaced the 65.1%
growth in residential population. The percentage of
change in Calif ornia population on a year-to-year basis
was charted and compared to the percentage of
increase in the number of issued chiropractic licenses
(Figure 5). Figure 5 revealed the yearly percentage in
licensed chiropractors exceeded the yearly percentage
growth in population from 1977 until 1997. The dis-
parity in growth rates reached its peak of 9% difference
in 1985.
The rising numbers of chiropractors, versus the avail-
able population, impacts the doct or/patient ratio. Mior
and Laporte [5] documented the concurrent decrease in
the doctor/patient ratio with the decrease in net annual
income. They noted the ratio of population to chiro-
practors (total population/chiropractors = X) was
6,453:1 in 1992-93 and this ultimately dropped to
4,352:1 in 2002-2003, a reduction of 33%. Mior and
Laporte determine the latter number was lower than
needed for a doctor in full-time practice and contributed
to their conclusion a long-term oversupply of chiroprac-
tors was present in Ontario, Canada.
We calculated the population-to-chiropractor ratio
with California population numbers and the number of
licensees from the DCA database. The population-to-
chiropractor ratio in California was lower than that seen
in Mior’s Canadian study. The population of 19,971,020
and 4274 chiropractors in 1970 resulted in a popula-
tion-to-chiropractor ratio of 4674:1. The population of
36,756,660 in 2008 and 13,882 chiropractors resulted in
2,647:1, a drop of 44%. These numbers are far lower
than those found in Mior’s study.
Potential influences of the population-to-chiropractor
ratio on attrition rates
The imbalance between the higher growth rates of chir-
opractors, compared to the population, is potentially sig-
nificant as it dramatically changes the availability of
potential patients. Previous investigations [7-10] have
found a small percentage of the current population uti-
lizes chiropractic services. Lawrence and Meeker [ 11]
reviewed studies that analyzed chiropractic utilization
and noted, “Studies looking at chiropractic utilization
demonstrate that the rates vary, but generally fall into a
range f rom around 6% to 12% of the population ” The
growth in licensed chiropractors during our study
resulted in a dramatic increase in com petition for avail-
able patients, despite the 65% growth in residential
population.
For the purposes of this study, we chose to use 10% as
the percentage of the populat ion that would utilize chir-
opractic care, as this falls well within the range observed
in other studies cited by Lawrence and Meeker and
allows for a consistent point of comparison across the
study period. However, it should be noted that larger,
later and more generalized studies conducted in 1999
and 2002 [12,13] concluded utilization rates of chiro-
practic by adults has been dropping during the later
portion of the study and is now believed to be 7.5% [14].
Figure 3 Increase in total population of California chiropractors by decade. A bar graph depicting the total increase in licensed
chiropractors for each decade from 1970 to 2008.
Foreman and Stahl Chiropractic & Osteopathy 2010, 18:24
/>Page 4 of 9
The results of the calculations ( 10% of population/
licensed chiropra ctors = X), seen in Figure 6, reveals 467
potential patients for each chiropractor in 1970, and a
peak of 534 potential patients in 1976. The potential doc-
tor/patient ratio continued to decrease as the number of
licensed chiropractors increased and outpaced population
growth during the study period. The potential patient-to-
doctor ratio had decreased to 283:1 by 1998, a reduction
of 40% in 28 years. The rate of decline in the patient-to-
doctor ratio has slowed after the study period, but cur-
rently stands at 263:1 in 2008. The slowed rate of decline
in available patients is reflective of the reduced growth
rate in chiropractic licenses that more closely tracks the
growth in population. The authors believe the increased
competition for available patients adversely affects the
doctor financially, mirroring the findings in Mior and
Laporte’s Canadian study [5].
Financial influences on Attrition Rates
A decrease in the population-to-chiropractor ratio
appears to have a significant, and expected, neg ative
financial effect. Mior and Laporte [5] noted the 33%
reduction in the patient-to-doctor ratio in their study
and observed significant decreases in the annual net
income of Canadia n chiropractors. Annual net income
during their study dropped from $97,892 in 1992-93 to
$48,900 in 2002-03, a reduction of 50% in 10 years.
The potential relationship between decreased income
and increased attrition rates is obvious, but no t the only
area of significant financial impact. The cost of profes-
sional education and the potential for professional reim-
bursement are areas that have undergone significant
change during our stud y period. Both areas were exam-
ined and indicated need for additional study.
Tuition increases
The authors studied the change in tuition cost for the
Doctor of Chiropractic degree between 1970 a nd 1998.
Chiropractic colleges in the United States are privately
funded and tui tion dependent instituti ons that grew and
changed during the study period. Expanded classrooms,
improved or new facilities, increased number and quality
Figure 5 Yearly percentage change in California popula tion and licensed chiropractors. The annual percentage of increase or decrease in
California chiropractors from 1970 to 1998 was plotted with the solid line. The annual percentage growth in California residential population
was plotted with the dashed line. The yearly percentage in licensed chiropractors exceeded the yearly percentage growth in population from
1977 until 1997. The disparity in growth rates reached its peak of 9% difference in 1985.
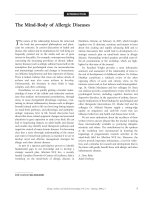
Figure 4 Increase in licensed chiropractors, 1970-2008. The number of licensed chiropractors rose from 4306 in 1970 to 11,637 in 1998, a
rise of 170.2%. The total number of active licenses has continued to rise and was 13,822 in 2008.
Foreman and Stahl Chiropractic & Osteopathy 2010, 18:24
/>Page 5 of 9
of faculty members and costs associated with accredita-
tion are but some of the forces that aff ected the cost of
tuition. Increases in tuition mirrored the growth in the
number of the practitioners.
Data concerning tuitio n for the doctor of chiropractic
degree was obtained from the annual catalogues issued
between 1970 and 1998 by an accredited c hiropractic
college in the United States. The tuition rates at this
single institution were believed to be representative of
tuition fees at other chiropracti c colleges. An absence of
older catalogs at other colleges prohibited a direct com-
parison. Minor fees associated with make-up tests, late
registration, dissection c lass, graduation and transcripts
were not considered as they varied between colleges and
were a minor portion of the total cost.
Quarterly tuit ion in 1970, as see n in Figure 7, was
$255 and rose to $4,530 in 1998, a t otal increase of
1,676% in 28 years. Information from the catalogs
revealed the tui tion increased 194% in the 1970s, 114 %
in the 1980s and 101% in the 1990s. The increase of
tuition from the $255 per quarter level in 1970 far
exceeded the rate of inflation between 1970 and 1998.
The $255 quarterly tuition adjusted for inflation to
1998 dollars would have risen to $1092. Thus, the
$4,530 per quarter tuition in 1998 outpaced inflation
by 414%.
The rapid increase in tuition may be related to
increased demand and financial rewards of practice at
that time. Survey data obtained from chiropractors in
the US, released by the American Chiropracti c Associa-
tion in 1999, [15] revealed incomes more than d oubled
between 1980 and 1989. Gross income rose from
$83,572 in 1 980 to $216,366 in 1989. Net income rose
from $43,457 in 1980 to $101,423 in 1989.
The increases in earning and numbers of students
enrolling in chiropractic colleges occurred simulta-
neouslywithanewsourceoffundingforchiropractic
education. In 1981, public law 97-35 made chiropractic
students eligible to borrow up to $12,500 per year for
four years in the Federal Health Education Loan
(HEAL) program [16].
The new availability of tuition funds was mirrored by
additional tuition increases and total base tuition for the
DC degree in our survey college rose to $1 9,800 by
1982. Congress raise d the total available funds through
the HEAL program to $18,500 in 1992, but total base
tuition for the DC degree in our survey college had now
rea ched $39,200. By the time the HEAL program ended
in 1998, the total base tuition for the DC degree had
reached $54,360, a total rise of 1,676% in 28 years.
The total amount borrowed or repaid by students in
California chiropractic colleges during the existence of
the HEAL program is not publically available for review,
but the total amount of those in default to the program
is still being tracked by the US Department of He alth
and Human Services, Bureau of Health Professions and
available for review online [17]. The debt still owed for
Federal student loans to c over the cost of their educa-
tion reflects a portion of the debt graduates were
required to repay in a environment of increased compe-
tition. The 240 graduates of the five California chiro-
practic colleges who defaulted on Federal H EAL loans
between 1981 and 1998 still owe a combined
$20,835,958, for an average of $86,816 per person. The
Figure 6 Change in the doctor/patient ratio. The calculated potential population for each licensed chiropractor, using 10% of the residential
population, decreased from 534 patients per doctor in 1976 to 283 patients in 1998.
Foreman and Stahl Chiropractic & Osteopathy 2010, 18:24
/>Page 6 of 9
chiropractic profession has always represented the great-
est default rate in regards to HEAL loans. It should be
noted that the HEAL funds were limited to the costs for
graduate education in chiroprac tic college and do not
reflect the costs associated with undergraduate educa-
tion needed for admission to chiropractic college. Those
costs have also increased during the study period
because of increases in pre-requisite education qualifica-
tions and rises in the costs of undergraduate courses.
Fundamental adverse changes in healthcare
reimbursement for chiropractic services occurred during
the study period
Changes in the healthcare reimbursement system during
the study period may have contributed to the increased
attrition rate.
Unrestricted “group health” (employer provided/pri-
vate payer) coverage that paid 80% of submitted chiro-
practic charges, and a 20% (80/20) patie nt co-payment
wascommoninCaliforniain1970butwassoonto
change. Passage of the Health Maintenance Organiza-
tion Act of 1973 [18] allowed for the creation of alterna-
tive reimbursement systems such as Preferred Provider
Organizations (PPOs) and Health Maintenance Organi-
zations (HMOs) that are collectively referred to as
“ Man aged Care.” The PPOs and HMOs frequently
restricted access to the chiropractic profession and used
fee schedules that paid a smaller percentage of the usual
and customary fees, as compared to group health cover-
age of 80/20. Alternative reimbursement systems were
authorized in 1973, but their implementation and broad
adaption in society took more than a decade.
Some chiropractors elected to join networ ks of com-
plementary and alternative providers that were created
during the study period. Doctors joining a network were
frequently required to accept the net work reimburse-
ment as payment in full. Advocates of the profession
claimed these new reimbursement systems adversely
affected the profession. For example, The California
Chiropractic Association (CCA) filed suit against the lar-
gest network of preferred chiropractors in 2001 and
alleged their practices were “damaging the entire chiro-
practic profession” and “negatively affected the patients’
ability to access care and doctors’ ability to provide
care.” [19] CCA further claimed the network improperly
withheld 7 million dollars from network doctors
between 1997 and 1999 and engaged in unfair practices.
The court eventually dismissed the CCA litigation in
2005 [20]. Others in the profession documented the per-
ceived effects of managed care on the profession. In
1994, Stephen Seater, executive director of the Founda-
tion for Chiropractic Education and Research, stated:
“On an average day, the FCER staff talks to about 50
practicing chiropractors. These doctors are telling us
more and more frequently that their practices are down,
some by as much as 50%! And time and time again, the
villain is managed care. In a reas where managed care is
growing rapidly, it is systematically cutting out most
chiropractors [21].”
The claim of reduced income appears to correlate
with surv ey data from the American Chiropractic Asso-
ciation [15] that showed decreases in gross and net
income between 1991 and 1997 (Figure 8). The 1991
and 1997 ACA survey numbers do not account for the
effects of inflation on changes of true spending power in
1997.
Figure 9 shows both gross and net incomes peaked in
1989 and decreased in spending power in both 1991
and 1997. In fact, the survey numbers show, after
adjusting for inflation to 1997 levels, the net income in
Figure 7 Changes in tuition 1970 to 1999. A time-trend depiction of the increasing quarterly tuition of a chiropractic college from 1970 to
1999. The dotted line represents the $255 per quarter tuition in 1970 adjusted for inflation between 1970 and 1999. The actual rise in tuition
exceeds inflation by 414%.
Foreman and Stahl Chiropractic & Osteopathy 2010, 18:24
/>Page 7 of 9
1997 had returned to its 1980 level. The return to 1980
level net income was not matched by corresponding
reductions in student l oan debt or increases in patient-
to-doctor ratios enjoyed in 1980.
Discussion
The authors originally proposed the hypothesis that the
attrition rate of licensed chiropractors is now higher
than the rate seen in past decades. Analysis of the DCA
records supports the hypothesis as data revealed the
attr ition rate to be significantly higher for those doctors
licensed in the 1990s compared t o their counterparts
licensed in the 1970s. We also believe that the adverse
financial impacts of increased competition for patients
seen in other studies were mirrored in California during
our study period. The 170% increase in licensed chiro-
practors between 1970 and 1998 far out-paced the
growth in population. The exact causes of the increased
rates of attrition have not been determined, but negative
economic conditions produced by spiraling tuition,
Figure 8 ACA Survey data on gross and net income. Th e solid line represents ACA survey data on gross inco me in 1980, 1989, 1991 and
1997. The dashed line represents net income from the same survey.
Figure 9 ACA Survey data on gross and net income adjusted for inflation. The solid line represents inflation adjusted ACA survey data on
gross income in 1980, 1989, 1991 and 1997. The dashed line represents inflation adjusted net income from the same survey. Note that the
adjusted net income in 1997 has returned to the 1980 level.
Foreman and Stahl Chiropractic & Osteopathy 2010, 18:24
/>Page 8 of 9
increased competition for available patients and lower
reimbursement rates are likely contributing factors that
require additional study.
There are limitations to this study. The DCA license
status information does not allow determination of
which doctors may have allowed their license to expire
and are now practicing in other states, which doctors
are in full-time versus part-time practice or the identity
of doctors that may have left practice but are now
employed in academia or related areas. The potential
relationship between increasing attrition rates and finan-
cial factors remains hypothetical and further study
would be required to establish a reliable association.
Specific information concerning gross a nd net income
levels for chiropractors within California during the
study period is not available. Income observations have
been limited to survey data collected from chiropractors
across the United States. Tuition information h as been
limited to a single institution that was believed to be
representative of the costs seen in other c olleges. An
absence of older catalogs at other colleges prohibited a
direct comparison to all chiropractic colleges in Califo r-
nia during the study. Half of the chiropractic colleges
instructing students in California during the study are
now closed and unable to supply information.
Authors’ contributions
SMF conducted the initial data extraction and prepared the first draft of the
manuscript. MJS participated in the conception, review of data, and design
of the study and in the revision and coordination of the final manuscript.
Both authors read and approved the final manuscript.
Competing interests
The authors declare that they have no competing interests.
Received: 23 January 2010 Accepted: 12 August 2010
Published: 12 August 2010
References
1. California Board of Chiropractic Examiners - Rules and Regulations.
[ Title 16, Division 4,
Article 6, §355 Accessed 6/26/10.
2. Morgenstern H: Use of ecological analysis in epidemiologic research.
AJPH 1982, 72(12):336-1344.
3. California Department of Consumer Affairs: License Verification, Board of
Chiropractic Examiners. [ />$lcev2.startup?p_qte_code=DC&p_qte_pgm_code=8500], Accessed 1/13/10.
4. National Board of Chiropractic Examiners: Job Analysis of Chiropractic.
2005 [ Accessed 1/13/10.
5. Mior S, Laporte A: Economic and Resource Status of the Chiropractic
Profession in Ontario, Canada: A Challenge or an Opportunity. J Manip
and Physio Ther 2008, 32(2):104-114.
6. Real Estate Center at Texas A&M University. [ />data/pops/pops06.htm], Accessed 12/31/09.
7. Hurwitz EL, Coulter ID, Adams AH, Genovese BJ, Shekelle PG: Use of
chiropractic services from 1985 through 1991 in the Unites States and
Canada. Am J Public Health 1998, 88:771-776.
8. Shekelle PG, Brook RH: A community-based study of the use of
chiropractic services. Am J Public Health 1991, 81:439-442.
9. Cote P, Cassidy JD, Carroll L: The treatment of neck and low back pain:
Who seeks care? Who goes where? Med Care 2001, 39:956-967.
10. Sherman KJ, Cherkin DC, Connelly MT, Erro J, Savetsky JB, Davis RB,
Eisenberg DM: Complementary and alternative medical therapies for
chronic low back pain: what treatments are patients willing to try? BMC
Complement Altern Med 2004, 19(4):9.
11. Lawrence D, Meeker W: Chiropractic and CAM Utilization: A Descriptive
Review. Chiropractic & Osteopathy 2007, 15:2.
12. Barnes P, Powell-Griner E, McFann K, Nahin R: Complementary and
alternative medicine use among adults; United States, 2002. Adv Data
2004, 27(343):1-19.
13. Ni H, Simile C, Hardy A: Utilization of complementary and alternative
medicine by United States adults; results from the 1999 national health
interview survey. Med Care 2002, 40(4):353-358.
14. Davis M, Davis A, Luan J, Weeks W: The supply and demand of
chiropractors ion the United States from 1996 to 2005. Alternative
Therapies 2009, 15(3):36-40.
15. Editorial Staff: The Chiropractic Practice – Now, and Then. ACA Survey
Reveals Dramatic Changes over Last 20 Years. Dynamic Chiropractic 1999,
17:12.
16. Omnibus Budget Reconciliation Act of 1981, P.L. 97-35, 95 Stat. 357-933.
[ />TOM:/bss/d097query.html], Accessed 1/2/2010.
17. US Department of Health and Human Services, Bureau of Health
Professions. [ Accessed 1/1/
2010.
18. Health Maintenance Organization Act of 1973. [nell.
edu/uscode/42/300e.html], (Public Law 93-222), 42 U.S.C. § 300e, Accessed
1/14/2010.
19. Editorial Staff: California Chiropractic Association Sues ASHP: Patient
Access and Ability to Treat Are at Issue. Dynamic Chiropractic 2001, 19:16.
20. Editorial Staff: CCA Loses Suit to American Specialty Health, Vows to
Continue Pursuing Claims. Dynamic Chiropractic 2006, 24:01.
21. Seater S: FCER Forum: Warfare requires new directions. Dynamic
Chiropractic 1995, 13(24):26.
doi:10.1186/1746-1340-18-24
Cite this article as: Foreman and Stahl: The attrition rate of licensed
chiropractors in California: an exploratory ecological investigation of
time-trend data. Chiropractic & Osteopathy 2010 18:24.
Submit your next manuscript to BioMed Central
and take full advantage of:
• Convenient online submission
• Thorough peer review
• No space constraints or color figure charges
• Immediate publication on acceptance
• Inclusion in PubMed, CAS, Scopus and Google Scholar
• Research which is freely available for redistribution
Submit your manuscript at
www.biomedcentral.com/submit
Foreman and Stahl Chiropractic & Osteopathy 2010, 18:24
/>Page 9 of 9