Báo cáo y học: " Chemical fingerprinting and quantitative analysis of a Panax notoginseng preparation using HPLC-UV and HPLC-MS" pdf
Bạn đang xem bản rút gọn của tài liệu. Xem và tải ngay bản đầy đủ của tài liệu tại đây (385.32 KB, 8 trang )
RESEARCH Open Access
Chemical fingerprinting and quantitative analysis
of a Panax notoginseng preparation using
HPLC-UV and HPLC-MS
Hong Yao, Peiying Shi, Qing Shao, Xiaohui Fan
*
Abstract
Background: Xuesaitong (XST) injection, consisting of total saponins from Panax notoginseng, was widely used for
the treatment of cardio- and cerebro-vascular diseases in China. This study develops a simple and global quality
evaluation method for the quality control of XST.
Methods: High performance liquid chromatography-ultraviolet detection (HPLC-UV) was used to identify and
quantify the chromatographic fingerprints of the XST injection. Characteristic common peaks were identified using
HPLC with photo diode array detection/electrospray ionization tandem mass spectrometry (HPLC-PDA/ESI-MS
n
).
Results: Representative fingerprints from ten batches of samples showed 27 ‘common saponins’ all of which were
identified and quantified using ten reference saponins.
Conclusion: Chemical fingerprinting and quantitative analysis identified most of the common saponins for the
quality control of P. notoginseng products such as the XST injection.
Background
Xuesai tong (XST) injection, consisting of total saponins
from Panax notoginseng (Sanqi), was widely used for the
treatment of cardiovascular and cerebrovascular diseases
in China. As total saponins (including ginsenosides and
notoginsenosides) in the XST injection are its active
ingredients, quality control of total saponins in the XST
injection is critical for its safety, efficacy and stability.
Single or simultaneous determination of main compo-
nents of t he total saponin extracts from P. notoginseng
using high performance liquid chromatography-ult ravio-
let detection (HPLC-UV ) [1-5], high performance liquid
chromatography-evaporative light scattering detection
(HPLC-ELSD) [6], high performance liquid chromato-
graphy-mass spectroscopy (HPLC-MS) [7-13] have been
reported but over half of the total saponins were not
quantified in these studies due to the lack of saponin
references or poor chromatographic resolution. A com-
prehensive and systematic quality control of saponin
extracts is much needed.
Fingerprintanalysisiscurrently developed for quality
control in Chinese medicine [14-26] and has been
accepted by the WHO for the assessment of herbal medi-
cines [27]. The State Food and Drug Administration
(SFDA) of China requires all herbal medicine-derived
injections and related materials to use chromatographic
fingerprints [28] in standardization.
This article reports a novel fingerprint analytical method
for quality control of the XST injection, which may be
applicable to other herbal products. Over the previous stu-
dies [1-13], the new method features the following advan-
tages. (1) The representative fingerprints show good
chromatographic separation for most of visible peaks in
the chromatographic profiles at 203 nm; (2) All main
saponins (27 visible peaks in chromatographic profiles) are
identifiable using high performance liquid chromatogra-
phy-photo diode array detection/electrospray ionization
tandem mass spectrometry (HPLC-PDA/ESI-MS
n
)techni-
que, ten saponin references or data from literature [8-14].
Methods
Materials and reagents
Acetonitrile and methanol (HPLC grade) were pur-
chased from Merck (Darmstadt, Germany). Acetic acid
* Correspondence:
Pharmaceutical Informatics Institute, Zhejiang University, Hangzhou 310058,
China
Yao et al. Chinese Medicine 2011, 6:9
/>© 2011 Yao et al; licensee BioMed Central Ltd. Thi s is an Open Access article distributed under the terms of the Creative Commons
Attribution License ( licenses/by/2.0), which permits unrestricted use, distribution, and reproduction in
any medium, provided the original work is properly cited.
glacial (HPLC grade) was from Tedia (Fairfield, OH,
USA). The water used was purified by Milli-Q system
(Millipore, USA). Reference compounds, namely noto-
ginsenoside R
1
,ginsenosideRg
1
,Rg
2
,Rh
1
,Rb
1
,Rb
2
,Rd,
Re, 20(S)-Rg
3
and 20(R)-Rg
3
were purchased from Jilin
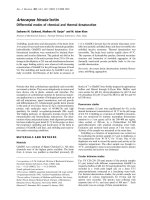
University (Shenyang, China). The structures of these
compounds are shown in Figure 1. Mixed standard
stock solution containing accurately weighed reference
compounds was directly prepared in 80% aqueous
methanol (v/v). Working standard solutions were pre-
pared by diluting the stock solution with 80% aqueous
methanol (v/v) to obtain a series of concentrations for
the calibration curves.
HPLC instrumentationadditional 1 and chromatographic
conditions
An Agilent 1100 HPLC system (Agilent Technologies,
USA) consisted of a quaternary solvent delivery system,
an on-line degasser, an auto-sampler, a column tem-
perature controller and ultraviolet detector coupled with
an analytical workstation and an Ultimate™ XB-C
18
col-
umn, 5 μm, 250 mm × 4.6 mm i.d. (Welch Materials,
USA) were used in the HPLC-UV experiments. Flow
rate was 1.0 ml/min and sample injection volume was
10 μl. Detection wavelength was set at 203 nm and the
column temperature was at 30°C. Mobile phase con-
tained deionized water-acetic acid (A; 100:0.01, v/v) and
acetonitrile-acetic acid (B; 100:0.01, v/v). The gradient
elution was as follows: 19-21.2% B at 0-30 min; 21.2-
26% B at 30-35 min; 26-28% B at 35-40 min; 28-3 8% B
at 40-50 min; 38-55% B at 50-60 min; 55% B at 60-65
min; 55-80% B at 65-70 min; 80-95% B at 70-75 min.
Re-equilibrium was 10 min; the total run time was
85 min.
HPLC-MS
n
instrumentation and chromatographic
conditions
Analysis was performed on an Agilent 1100 series LC
system equipped with a binary solvent delivery system,
an auto-sampler, a column temperature controller, a
photo diode array detector and a Finnigan LCQ Deca
XP
plus
ion trap mass spectrometer (Thermo Finnigan,
USA) via an ESI interface. The chromatographic condi-
tions were the same for HPLC-UV as described in the
previous section. The operating parameters for MS in
thenegativemodewereasfollows:collisiongas,ultra-
high-purity helium (He); nebulizing gas, high purity
nitrogen (N
2
); ion spray voltage, -4.5 kV; sheath gas
(N
2
) at a flow rate of 60 arbitrary units; auxiliary gas
(N
2
) at a flow rate of 20 arbitrary units; capillary tem-
perature, 350°C; capillary voltage , -15 V; tube lens offset
voltage, -30 V. Full scan data acquisition was performed
from m/z 80 to 1800 in MS scan mode. The MS
n
spec-
tra were obtained with the collision energy for collision-
induced dissociation adjusted to 30%-40% of maximum
and the isolation width of precursor ions was 2.0Th.
Sample preparation
Ten samples of the XST injection (Batch No. 20090307,
20090510, 20090310, 20081 018, 9042213, 2 0090312,
20090421, 20090 512, 20090504, 2009020 3), manufac-
tured by three Chinese pharmaceutical companies, were
obtained either from pharmacies or factories. For
HPLC- PDA-MS
n
analysis, a certain volume of the injec-
tion, acc ording to its nominal content of total saponins,
was transferred to a 50 ml volumetric flask and was
diluted with 80% aqueous methanol (v/v) to obtain total
saponins at a concentration of about 1 mg/ml. For
HPLC-UV analysis, the injection was diluted with 80%
aqueous methanol (v/v) to obtain total saponins at a
concentration of about 0.5 mg/ml. Prior to analysis, the
sample solutions were filtered through a 0.45 μmnylon
membrane (Whatman, Britain). Spiked injection was
produced by mixing sample solutions with the reference
solutions at the ratio of 1:1.
Data analysis
Data analysis was carried out with Similarity Evaluation
System for Chromatographic Fingerprint of Traditional
Chinese Medicine (version 2004A, National Committee
of Pharmacopoeia, China) recommended by the SFDA.
Results and discussion
Optimization of HPLC separation
We optimized the separation conditions including the
column, mobile phase, detection wavelength, elution
gradient and column temperature in this study. Four
reversed-phase columns, Agilent Zorbax Eclipse SB-C
18
colu mns (250 mm × 4.6 mm, 5 μm; 150 mm × 4.6 mm,
3.5 μm; 100 mm × 2.1 mm, 1.8 μm) and Ultimate™
XB-C
18
column (250 mm × 4.6 mm, 5 μm) were tested.
The results showed that all four columns obtained good
peak resolutions in 75 min, 7 5 min, 45 min and 75 min
respectively; however, only two columns with the length
of 250 mm (Zorbax Eclipse SB-C
18
and Ultimate™ XB-
C
18
) produced more peaks in chromatograms. Ulti-
mate™ XB-C
18
column (250 mm × 4.6 mm, 5 μm) was
selected in the fingerprint analysis due to its lower cost
than Zorbax Eclipse SB-C
18
column.
The effects of mobile phase c omposition on chroma-
tographic separation were also studied. The cetonitrile/
water system produced more sharp peaks than the
methanol/water system; the addition of 0.01% acetic
acid in the acetonitrile/water system further improved
the peak shape. Moreover, as the retention time of some
components such as ginsenoside 20(S)-Rg
3
and 20(R)-
Rg
3
was long, gradient elution was used in HPLC analy-
sis. Satisfactory separation was achieved in 75 min.
Yao et al. Chinese Medicine 2011, 6:9
/>Page 2 of 8
There was no strong absorption for most of saponins
in the region of ultraviolet and visible spectra due to
their structural characteristics, eg lack of conjugation
groups in the molecular structures. As the end adsorp-
tion wavelength 203 nm is suitable for the a ssay of
ginsenosides and notogin senosides [1-5], it was selected
as the detection wavelength in the experiment. Further-
more, the effects of column temperature on chromato-
graphic separation were also examined. Four column
temperatures, namely 20, 25, 30 and 35°C w ere tested.
R
1
H
OH
R
2
R
3
20S-form 20R-form
20
20(21)-ene-form
R
1
H
OH
R
2
20(22)-ene-form
20
22
22
R
1
H
OH
R
2
20
R
3
R
1
H
OH
R
2
20
ʳ
No. Saponin R
1
R
2
R
3
20S-form 1 Notoginsenoside R
3
OH Oglc Oglc(6-1)-glc
2 Notoginsenoside R
1
OH Oglc(2-1)xyl Oglc
3 Ginsenoside Rg
1
OH Oglc Oglc
4 Ginsenoside Re OH Oglc(2-1)rha Oglc
5 Notoginsenoside R
6
OH Oglc Oglc(6-1)-glc'
6 Ginsenoside Rf OH Oglc(2-1)glc OH
7 Notoginsenoside I
*
OH Oglc(2-1)glc Oglc(6-1)glc
8 SC1
**
OH Oxyl Oglc(6-1)xyl
9 Ginsenoside Rg
2
OH Oglc(2-1)rha OH
10 Ginsenoside Rh
1
OH Oglc OH
11 Ginsenoside F
1
OH OH Oglc
12 Notoginsenoside R
4
Oglc(2-1)glc H Oglc(6-1)glc(6-1)xyl
13 Notoginsenoside Fa Oglc(2-1)glc(2-1)xyl H Oglc(6-1)glc
14 Ginsenoside Rb
1
Oglc(2-1)glc H Oglc(6-1)glc
15 Notoginsenoside Fc Oglc(2-1)glc(2-1)xyl H Oglc(6-1)xyl
16 Ginsenoside Rb
2
Oglc(2-1)glc H Oglc(6-1)araf
17 Ginsenoside Rd Oglc(2-1)glc H Oglc
18 Notoginsenoside K Oglc(6-1)glc H Oglc
19 Ginsenoside F
2
Oglc H Oglc
20 Ginsenoside 20(S)-Rg
3
Oglc(2-1)glc H OH
20R-form 21 Ginsenoside 20(R)-Rg
3
Oglc(2-1)glc H OH
20(21)-ene-form 22 Notoginsenoside T
5
OH OGlc(3-1)xyl –
23 Ginsenoside Rk
1
Oglc(2-1)glc H –
24 Ginsenosiede Rk
3
OH Oglc –
20(22)-ene-form 25 Ginsenosiede Rh
4
OH Oglc –
26 Ginsenoside Rg
5
Oglc(2-1)glc H –
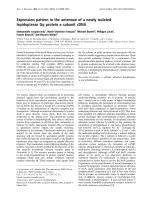
Figure 1 Structures of the investigated saponins in P. notoginseng.glc,b-D-glucose; glc’, a-D-glucosexyl, b-D-xylose; rha, a-L-rhamnose;
araf, a-L-arabinose (furanose). Notoginsenoside I *, H is instead of OH (C
12
) in 20S-form. SC1 **, 6-O-b-D-xylopyranosyl -20-b-D-xylopyranosyl-
(1®6)-b-D-glucopyranosyl dammar-24-ene-3b,6a,12b, 20(S)tetraol.
Yao et al. Chinese Medicine 2011, 6:9
/>Page 3 of 8
We found that at 30°C most peaks in chromatography
had good resolutions; therefore, 30°C was chosen as the
column temperature for the fingerprint analysis.
HPLC-UV fingerprinting of the XST injection
To standardize the fingerprints, we analy zed ten sam ples
using the optimized HPLC-UV method. Peaks found in
all ten samples with good resolution were assigned as
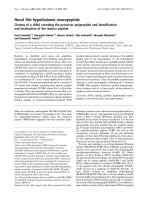
‘ characteristic peaks’ and there were 27 characteristic
peaks in the fingerprint chromatograms (Figure 2A). The
software of Similarity Evaluation System for Chromato-
grap hic Fingerprint of Traditional Chinese Medicine was
used to evaluate these chromatograms.Toexcludethe
effects of the solvent and baseline fluctuation, we selected
the chromatographic data of these ten samples and trea-
ted them within the time frame of 28 min to 75 min. The
similarities of chromatograms for the ten samples to t he
reference fingerprints were established using the means
of all chromatograms (Additio nal file 1). The results
showed that the ten samples possessed similarities to the
reference fingerprints (Additional file 2). While the
HPLC-UV fingerprints from different batches and com-
panies varied, the 27 characteristic peaks were common
in all samples. Therefore, the detection of these common
peaks in HPLC fing erprints is useful in assessing the
quality of the XST injection.
Identification of characteristic peaks
HPLC-PDA/ESI-MS
n
was used for the components analy-
sis and all 27 characteristic peaks were identified. I n the
ESI-MS experiment, the molecular weight of each peak was
also obtained. By comparing with the ESI-MS
n
data and
HPLC retention time of standard sanponins (Figure 2B and
Additional file 3), we identified 10 peaks as notogisenoside
min
30 40 50 60 70
0
50
100
150
200
1
2
3
4
5
6
7
8
9
10
11
12
13
14
15
16
17
18
19
20
21
22
23
24
25
26
27
A
min
30 40 50 60 70
0
20
40
60
80
100
120
140
160
1
2
3
11
12
13
15
23
24
9
B
Signal (mAU)
Signal (mAU)
Figure 2 Chromatograms of (A) the representative fingerprint, (B) mixture standard compounds including (1) notoginsenoside R
1
,
(2) ginsenoside Rg
1
, (3) ginsenoside Re, (9) ginsenoside Rb
1
, (11) ginsenoside Rg
2
, (12) ginsenoside Rh
1
, (13) ginsenoside Rb
2
, (15),
ginsenoside Rd, (23) ginsenoside 20 (S)-Rg
3
and (24) ginsenoside 20 (R)-Rg
3
.
Yao et al. Chinese Medicine 2011, 6:9
/>Page 4 of 8
R
1
, ginsenoside Rg
1
, Re, Rb
1
,Rg
2
,Rh
1
,Rb
2
, Rd and 20(S)-
Rg
3
,20(R)-Rg
3
. A total of 17 peaks were identified tenta-
tively with the aid of the ESI-MS
n
data and HPLC retention
time of some saponins from previous reports [1-13]. All the
identification results are shown in Table 1. In addition, The
UV spectra of all peaks in the XST injection were obtained
from the PDA chromatogram (Additional file 3). The
results showed that among all the peaks in the chromato-
gram of the XST injection no strong UV absorption within
the wavelength range from 210 nm to 400 nm was
obtained, suggesting that the XST injection consisted of
saponins with few other natural components possessing
strong UV absorption, such as flavonoids , lignins, anthra-
quinones and alkaloids.
Determination of the main saponins in the XST injection
As shown in Figure 2A, 27 saponins were well separated,
of which 25 were potentially identified (Table 1). The ratio
of total saponin peak area to all peaks (except for solvent
peaks and baseline fluctuation in 0-28 min) in the
chromatogram of each sample was beyond 95%. Thus, a
method for quantification of the 27 saponi ns should pro-
vide a global and systematical evaluation for the quality
control of the XST injection. However, it was difficult to
obtain the reference co mpounds for all 27 saponins; we
were only able to ob tain ten, including notoginsenoside
R
1
, ginsenoside Rg
1
, Re, Rb
1
,Rg
2
,Rh
1
,Rb
2
, Rd, 20(S)-Rg
3
and 20(R)-Rg
3
. Some reports [1-3] found that the slopes of
regression equations for most of the determined saponins,
such as notoginsenoside R
2
,R
4
, Fa, ginsenoside Rg
1
,Re,
Rf, Rb
1
,Rg
2
,Rh
1
and Rd were approximately negatively
correlated to their molecular weights by HPLC-UV at 203
nm (Additional file 4) and that the regression equations of
some saponins with similar molecular weights were also
close to each other under the same chromatographic con-
dition (Additional file 5, 6, 7, 8 and 9).
Ten saponins, namely R
1
, ginsenoside Rg
1
, Re, Rb
1
,Rg
2
,
Rh
1
,Rb
2
, Rd, 20(S)-Rg
3
and 20(R)-Rg
3
were quantitatively
determined and the rest 17 saponins without standard
references were semi-quantified using substitutive
Table 1 The identification results of saponins in the XST injection by LC/MS
n
Peak
No.
Identification Retention time
(min)
MS[M-H]
-
MS data (m/z)
1 Notoginsenoside R
1
34.89 932 799 [M-H-Xyl]
-
; 637 [M-H-Xyl-Glc]
-
; 475 Agl
2 Ginsenoside Rg
1
39.32 800 637 [M-H-Glc]
-
; 619 [M-H-H
2
O-Glc]
-
; 475 Agl
3 Ginsenoside Re 39.72 945 783 [M-H-Glc]
-
; 637 [M-H-Glc-Rha]
-
; 475 Agl
4 Notoginsenoside R
4
51.24 1240 1107 [M-H-Xyl]
-
; 1077 [M-H-Glc]]
-
; 945 [M-H-Xyl-Glc; 783 [M-H-Xyl-2Glc]
-
5 Ginsenoside Rf 51.89 800 637 [M-H-Glc]]
-
; 475 Agl
6 Notoginsenoside Fa 52.17 1240 1107 [M-H-Xyl]
-
; 1077 [M-H-Glc]]
-
; 945 [M-H-Xyl-Glc; 783 [M-H-Xyl-2Glc]
-
7 Notoginsenoside I 52.39 1092 929[M-H-Glc]
-
; 767 [M-H-2Glc]
-
; 605[M-H-3Glc]
-
8 SC1 52.56 901 769 [M-H-Xyl]
-
; 637 [M-H-2Xyl]
-
; 475 Agl
9 Ginsenoside Rb1 53.48 1107 945 [M-H-Glc]
-
; 783 [M-H-2Glc]
-
; 621 [M-H-3Glc]
-
; 459 Agl
10 Notoginsenoside Fc 54.32 1209 1077 [M-H-Xyl]
-
; 945 [M-H-2Xyl]
-
; 783 [M-H-2Xyl-Glc]
-
; 621 [M-H-2Xyl-2Glc]
-
; 459 Agl
11 Ginsenoside Rg
2
54.75 783 637 [M-H-Rha]
-
; 621 [M-H-Glc]
-
; 475 Agl
12 Ginsenoside Rh
1
55.04 637 475 [M-H-Glc]
-
13 Ginsenoside Rb
2
55.30 1077 945[M-H-Arap]
-
; 915[M-H-Glc]
-
; 783[M-HArap-Glc]
-
; 621[M-H-Arap-2Glc]
-
;
459 Agl
14 Ginsenoside F
1
55.84 637 475 [M-H-Glc]
-
15 Ginsenoside Rd 57.16 945 783 [M-H-Glc]
-
; 621[M-H-2Glc]
-
; 459Agl
16 Notoginsenoside K 58.32 945 783 [M-H-Glc]
-
; 621[M-H-2Glc]
-
; 459Agl
17 Notoginsenoside T
5
/
Unkown
61.70 752 619[M-H-Xyl]
-
; 457 Agl
18 Unkown 62.09 765 603[M-H-Glc]
-
19 Notoginsenoside T
5
/
Unkown
62.42 752 619[M-H-Xyl]
-
; 457 Agl
20 Unkown 62.81 765 603[M-H-Glc]
-
21 Ginsenoside Rk
3
63.42 619 551 [M-H-C
5
H
10
]
-
22 Ginsenoside Rh
4
64.18 619 551 [M-H-C
5
H
10
]
-
23 20(S)-ginsenoside Rg
3
65.14 783 621 [M-H-Glc]
-
; 459 Agl
24 20(R)-ginsenoside Rg
3
65.86 783 621 [M-H-Glc]
-
; 459 Agl
25 Ginsenoside F
2
66.05 783 621 [M-H-Glc]
-
; 459 Agl
26 Ginsenoside Rk
1
72.47 765 603 [M-H-Glc]
-
27 Ginsenoside Rg
5
72.89 765 603 [M-H-Glc]
-
Yao et al. Chinese Medicine 2011, 6:9
/>Page 5 of 8
standard substances. The calibration curves for the quan-
tification of each saponin were selected and listed in
Table 2. The developed analytical method was successfully
applied to analysis of ten batches of the XST injection. All
of the 27 characteristic peaks were determined simulta-
neously and the results are in Table 3. In the XST injec-
tion, the content of ginsenoside Rb
1
was the most
(26.17%-29.60%), followed by ginsenoside Rg
1
(20.50%-
25.43%), Rd (6.82%-8.10%), notoginsenoside R
1
(5.29%-
6.89%) and ginsenoside Re (2.91%-4.92%). The total
content of the five saponins made up 61.69%-71.39% of the
total saponins in the XST injection (total saponins nom-
inal: 50 mg/ml). The ten saponins with available standard
substances were quantitatively determined and made up
68.46%-75.85% of the total saponins nominal. Thus, com-
bined with the semi-quantification data, 81.81%-95.71%
components in the X ST injection could be examined.
Conclusion
The fingerprint profiles of ten batches of samples showed
27 characteristic peaks. Ten of these 27 saponins in the
XST injections were quantitatively determi ned with their
standard references; the rest 17 saponins were semi-
quantified with the substitutive standard references.
Additional material
Additional file 1: The chromatogram of similarity analysis of the
fingerprints of 10 samples.
Additional file 2: The similarities of chromatograms of 10 samples
(n = 3).
Additional file 3: PDA Chromatograms. standard compounds (A) and
a XST injection (C), and total ion current chromatograms of standard
compounds (B) and a XST injection (D). 1-27 were the characteristic
peaks, listed in Table 2
Additional file 4: Plots of slopes of calibration curves vs. molecular
weights (MW) of saponins. From literatures (A) [Journal of
Pharmaceutical and Biomedical Analysis 41 (2006) 274-279], (B) [Journal
of Pharmaceutical and Biomedical Analysis 48 (2008) 1361-1367], (C)
[Journal of Pharmaceutical and Biomedical Analysis 38 (2005) 45-51], (D)
[Journal of Chromatography A 1011 (2003) 77-87], (E) [Journal of
Shenyang Pharmaceutical University Vol. 20, No.1 (2003) 27-31], and (F)
[Chinese Pharmaceutical Journal Vol. 38, No.9 (2003) 698-699]
Additional file 5: The method validation for simultaneous
determination of the twenty-seven saponins in XST injection. The
quantitative and semi-quantitative methods were validated and the
semi-quantitative principle were discussed in detail.
Table 2 Calibration curves, detection limits and quantification limits of the saponins by HPLC-UV
Peak No. Saponins M.W. Calibration curve
a
Linear range (μg/ml) R
2
LOD (μg/ml)
21 Ginsenoside Rk
3
619 y = 6.7519x - 7.6085
22 Ginsenoside Rh
4
619 y = 6.7519x - 7.6085
12 Ginsenoside Rh
1
637 y = 6.7519x - 7.6085 4.28-68.5 0.9993 2.14
14 Ginsenoside F
1
637 y = 6.7519x - 7.6085
17 Notoginsenoside T
5
/Unkown 752 y = 5.4845x - 4.8387
19 Notoginsenoside T
5
/Unkown 752 y = 5.4845x - 4.8387
18 Unkown 765 y = 5.4845x - 4.8387
20 Unkown 765 y = 5.4845x - 4.8387
26 Ginsenoside Rk
1
765 y = 5.4845x - 4.8387
27 Ginsenoside Rg
5
765 y = 5.4845x - 4.8387
11 Ginsenoside Rg
2
783 y = 5.6715x - 5.6679 3.34-53.5 0.9993 1.67
23 20(S)-Rg
3
783 y = 5.4845x - 4.8387 2.95-47.3 0.9990 1.48
24 20(R)-Rg
3
783 y = 5.0923x - 2.8995 2.63-42.0 0.9994 1.75
25 Ginsenoside F
2
783 y = 5.4845x - 4.8387
2 Ginsenoside Rg
1
800 y = 5.1367x - 76.471 16.64-1065 0.9990 10.29
5 Ginsenoside Rf 800 y = 5.1367x - 76.471
8 SC1 901 y = 4.3254x - 5.0843
1 Notoginsenoside R
1
932 y = 4.3254x - 5.0843 10.26-492.5 0.9997 7.42
3 Ginsenoside Re 945 y = 4.4123x - 29.465 43.28-692.5 0.9993 4.73
15 Ginsenoside Rd 945 y = 4.1199x - 5.5681 16.64-532.5 0.9993 4.43
16 Notoginsenoside K 945 y = 4.1199x - 5.5681
13 Ginsenoside Rb
2
1077 y = 3.8757x + 2.4182 4.84-77.5 0.9995 1.95
7 Notoginsenoside I 1092 y = 3.8757x + 2.4182
9 Ginsenoside Rb
1
1107 y = 3.5815x - 29.548 15.98-1022.5 0.9992 7.91
10 Notoginsenoside Fc 1209 y = 3.5815x - 29.548
4 Notoginsenoside R
4
1240 y = 3.5815x - 29.548
6 Notoginsenoside Fa 1240 y = 3.5815x - 29.548
a
y: peak area of analyte; x: concentration of analyte (μg/ml).
Yao et al. Chinese Medicine 2011, 6:9
/>Page 6 of 8
Additional file 6: Precisions and repeatability. The results of precision
and repeatability for simultaneous determination of the twenty-seven
saponins
Additional file 7: Recovery. The results of recovery for simultaneous
determination of the twenty-seven saponins
Additional file 8: Plots of slopes of calibration curves vs molecular
weights (MW) with different chromatography columns. (A)
Ultimate™™ XB-C18 (250 mm × 4.6 mm, 5 μm), (B) Zorbax Eclipse SB-
C18 (250 mm × 4.6 mm, 5 μm) and (C) Zorbax Eclipse SB-C18 (100 mm
× 2.1 mm, 1.8 μm)
Additional file 9: Regression equation using different columns .
Columns: Zorbax Eclipse SB-C18 (250 mm × 4.6 mm, 5 μm) and Zorbax
Eclipse SB-C18 (100 mm × 2.1 mm, 1.8 μm)
Abbreviations
XST: Xuesaitong; HPLC-UV: high performance liquid chromatography-
ultraviolet detection; HPLC-PDA/ESI-MS
n
: HPLC with photo diode array
detection/electrospray ionization tandem mass spectrometry; HPLC-ELSD:
high performance liquid chromatography-evaporative light scattering
detection; HPLC-MS: high performance liquid chromatography-mass
spectroscopy; SFDA: State Food and Drug Administration (China)
Acknowledgements
This work was supported by the National S&T Major Project (No.
2009ZX09502-005 & 2009ZX09311-002) and Zhejiang Provincial Natural
Science Foundation, China (R2080693).
Authors’ contributions
XHF designed the study. HY performed the fingerprint and quantitative
analysis and wrote the manuscript. PYS and QS assisted HY to identify the
characteristic peaks using HPLC-PDA/ESI-MS
n
. All authors read and approved
the final version of the manuscript.
Competing interests
The authors declare that they have no competing interests.
Received: 29 July 2010 Accepted: 24 February 2011
Published: 24 February 2011
References
1. Lau AJ, Woo SO, Koh HL: Analysis of saponins in raw and steamed Panax
notoginseng using high-performance liquid chromatography with diode
array detection. J Chromatogr A 2003, 1011:77-87.
2. Lau AJ, Seo BH, Woo SO, Koh HL: High-performance liquid
chromatographic method with quantitative comparisons of whole
chromatograms of raw and steamed Panax notoginseng. J Chromatogr A
2004, 1057:141-149.
Table 3 Contents (%) of the 27 saponins in the XST injection (total saponins nominal: 50 mg/ml)
a
Peak No. Saponins S1 S2 S3 S4 S5 S6 S7 S8 S9 S10
1 Notoginsenoside R
1
(%) 6.64 5.29 6.89 6.47 6.27 5.86 5.33 6.41 6.07 6.35
2 Ginsenoside Rg
1
(%) 25.43 20.50 24.53 23.99 23.76 20.29 21.15 22.23 22.31 23.33
3 Ginsenoside Re (%) 3.43 2.91 4.92 3.61 3.55 3.56 3.35 3.04 3.03 3.69
4 Notoginsenoside R
4
(%) 1.52 1.19 1.24 1.33 1.28 1.33 1.31 1.11 1.15 1.38
5 Ginsenoside Rf (%) 1.24 0.95 0.98 1.15 1.15 0.97 1.03 1.03 1.03 1.00
6 Notoginsenoside Fa (%) 1.45 1.21 1.90 1.35 1.44 1.43 1.35 1.29 1.29 1.34
7 Notoginsenoside I (%) 0.89 0.62 0.17 0.80 0.80 0.76 0.81 0.73 0.66 0.83
8 SC1 (%) 0.65 0.51 2.28 0.56 0.62 0.46 0.54 0.52 0.49 0.54
9 Ginsenoside Rb
1
(%) 28.39 26.17 26.34 28.30 28.78 29.58 29.60 28.00 28.14 27.78
10 Notoginsenoside Fc (%) 1.30 0.94 0.99 1.13 1.12 1.06 0.98 1.05 1.05 1.15
11 Ginsenoside Rg
2
(%) 1.02 1.31 1.08 1.18 0.98 0.78 1.44 1.38 1.38 1.17
12 Ginsenoside Rh
1
(%) 1.77 3.06 2.25 2.22 1.65 1.06 2.90 3.19 3.22 2.17
13 Ginsenoside Rb
2
(%) 1.09 0.69 2.18 1.07 1.06 1.00 0.90 0.81 1.11 1.04
14 Ginsenoside F
1
(%) 0.76 1.77 0.29 1.14 0.85 0.50 1.59 1.90 1.88 1.24
15 Ginsenoside Rd (%) 7.50 6.82 7.25 7.22 7.24 7.27 8.10 7.41 7.48 7.18
16 Notoginsenoside K (%) 1.01 0.72 1.05 1.18 1.24 1.33 1.36 0.96 1.04 1.43
17 Notoginsenoside T
5
/Unkown (%) 0.39 0.69 0.58 0.69 0.47 0.39 0.79 0.87 0.86 0.83
18 Unkown (%) 0.30 0.37 1.11 0.45 0.36 0.23 0.56 0.50 0.50 0.46
19 Notoginsenoside T
5
/Unkown (%) 0.72 1.31 0.41 1.19 0.82 0.63 1.51 1.51 1.54 1.20
20 Unkown (%) 0.39 0.55 0.31 0.55 0.37 0.39 0.70 0.66 0.67 0.55
21 Ginsenoside Rk
3
(%) 0.90 2.30 1.59 1.78 1.10 0.80 2.35 2.52 2.57 1.77
22 Ginsenoside Rh
4
(%) 1.27 3.66 2.47 2.69 1.49 0.91 3.70 3.87 3.88 2.65
23 20S-Rg
3
(%) 0.37 1.01 0.75 0.81 0.44 0.43 1.21 1.09 1.14 0.83
24 20R-Rg
3
(%) 0.21 0.70 0.52 0.51 0.25 0.22 0.78 0.76 0.82 0.56
25 Ginsenoside F
2
(%) 0.36 0.38 0.23 0.28 0.14 0.10 0.78 0.42 0.43 0.25
26 Ginsenoside Rk
1
(%) 0.41 1.13 1.22 0.81 0.66 0.47 1.62 1.02 1.28 0.80
27 Ginsenoside Rg
5
(%) 0.32 1.30 1.17 1.05 0.65 0.46 1.95 1.31 1.50 1.03
Total (%)
b
89.41 86.78 93.54 92.47 87.90 81.81 95.71 94.27 95.02 91.50
a
Mean values of samples (n = 3).
b
Total content of the 27 saponins in samples.
Yao et al. Chinese Medicine 2011, 6:9
/>Page 7 of 8
3. Li L, Zhang JL, Sheng YX, Guo DA, Wang Q, Guo HZ: Simultaneous
quantification of six major active saponins of Panax notoginseng by
high-performance liquid chromatography-UV method. J Pharm Biomed
Anal 2005, 38:45-51.
4. Guan J, Lai CM, Li SP: A rapid method for the simultaneous
determination of 11 saponins in Panax notoginseng using ultra
performance liquid chromatography. J Pharm Biomed Anal 2007,
44:996-1000.
5. Qian ZM, Wan JB, Zhang QW, Li SP: Simultaneous determination of
nucleobases, nucleosides and saponins in Panax notoginseng using
multiple columns high performance liquid chromatography. J Pharm
Biomed Anal 2008, 48:1361-1367.
6. Wan JB, Yang FQ, Li SP, Wang YT, Cui XM: Chemical characteristics for
different parts of Panax notoginseng using pressurized liquid extraction
and HPLC-ELSD. J Pharm Biomed Anal 2006, 41:1596-1601.
7. Wang XY, Zhao T, Gao XF, Dan M, Zhou MM, Jia W: Simultaneous
determination of 17 ginsenosides in rat urine by ultra performance
liquid chromatography-mass spectrometry with solid-phase extraction.
Anal Chim Acta 2007, 594:265-273.
8. Lai CM, Li SP, Yu H, Wan JB, Kan KW, Wang YT: A rapid HPLC-ESI-MS/MS
for qualitative and quantitative analysis of saponins in “XUESETONG”
injection. J Pharm Biomed Anal 2006, 40:669-678.
9. Li L, Tsao R, Dou JP, Song FR, Liu ZQ, Liu SY: Detection of saponins in
extract of Panax notoginseng by liquid chromatography-electrospray
ionisation-mass spectrometry. Anal Chim Acta 2005, 536:21-28.
10. Li XY, Sun JG, Wang GJ, Hao HP, Liang Y, Zheng YT, Yan B, Sheng LS:
Simultaneous determination of panax notoginsenoside R
1
, ginsenoside
Rg
1
, Rd, Re and Rb
1
in rat plasma by HPLC/ESI/MS: platform for the
pharmacokinetic evaluation of total panax notoginsenoside, a typical
kind of multiple constituent traditional Chinese medicine. Biomed
Chromatogr 2007, 21:735-746.
11. Liu HL, Xia L, Cao J, Li P, Qi LW: Simultaneous determination of twelve
saponins in Radix et Rhizoma Notoginseng by rapid resolution LC-ESI-
TOF-MS. Chromatographia 2008, 68:1033-1038.
12. Chan ECY, Yap SL, Lau AJ, Leow PC, Toh DF, Koh HL: Ultra-performance
liquid chromatography/time-of-flight mass spectrometry based
metabolomics of raw and steamed Panax notoginseng. Rapid Commun
Mass Spectrom 2007, 21:519-528.
13. Dan M, Su MM, Gao XF, Zhao T, Zhao AH, Xie GX, Qiu YP, Zhou MM, Liu Z,
Jia W: Metabolite profiling of Panax notoginseng using UPLC-ESI-MS.
Phytochemistry 2008, 69:2237-2244.
14. Wang XJ, Lv HT, Sun H, Jiang XG, Wu ZM, Sun WJ, Wang P, Liu L, Bi KS:
Quality evaluation of Yin Chen Hao Tang extract based on fingerprint
chromatogram and simultaneous determination of five bioactive
constituents. J Sep Sci 2008, 31:9-15.
15. Liu AH, Lin YH, Yang M, Guo H, Guan SH, Sun JH, Guo DA: Development
of the fingerprints for the quality of the roots of Salvia miltiorrhiza and
its related preparations by HPLC-DAD and LC-MS
n
. J Chromatogr B 2007,
846:32-41.
16. Han C, Shen Y, Chen JH, Lee FSC, Wang XR: HPLC fingerprinting and LC-
TOF-MS analysis of the extract of Pseudostellaria heterophylla (Miq.) Pax
root. J Chromatogr B 2008, 862:125-131.
17. Qiao CF, Han QB, Song JZ, Mo SF, Kong LD, Kung HF, Xu HX: Chemical
fingerprint and quantitative analysis of Fructus Psoraleae by high-
performance liquid chromatography. J Sep Sci 2007, 30:813-818.
18. Ding S, Dudley E, Plummer S, Tang J, Newton RP, Brenton AG: Fingerprint
profile of Ginkgo biloba nutritional supplements by LC/ESI-MS/MS.
Phytochemistry 2008, 69:1555-1564.
19. Jiang Y, Li SP, Wang YT, Chen XJ, Tu PF: Differentiation of Herba
Cistanches by fingerprint with high-performance liquid
chromatography-diode array detection-mass spectrometry. J Chromatogr
A 2009, 1216:2156-2162.
20. Jin XF, Lu YH, Wei DZ, Wang ZT: Chemical fingerprint and quantitative
analysis of Salvia plebeia R.Br. by high-performance liquid
chromatography. J Pharm Biomed Anal 2008, 48:100-104.
21. Kong WJ, Zhao YL, Xiao XH, Jin C, Li ZL: Quantitative and chemical
fingerprint analysis for quality control of Rhizoma Coptidischinensis
based on UPLC-PAD combined with chemometrics methods.
Phytomedicine 2009, 16:950-959.
22. Li W, Deng YL, Dai RJ, Yu YH, Saeed MK, Li L, Meng WW, Zhang XS:
Chromatographic fingerprint analysis of Cephalotaxus sinensis from
various sources by high-performance liquid chromatography-diodearray
detection-electrospray ionization-tandem mass spectrometry. J Pharm
Biomed Anal 2007, 45:38-46.
23. Dumarey M, van Nederkassel AM, Deconinck E, Vander Heyden Y:
Exploration of linear multivariate calibration techniques to predict the
total antioxidant capacity of green tea from chromatographic
fingerprints. J Chromatogr A 2008, 1192:81-88.
24. Teo CC, Tan SN, Yong JWH, Hew CS, Ong ES: Validation of green-solvent
extraction combined with chromatographic chemical fingerprint to
evaluate quality of Stevia rebaudiana Bertoni. J Sep Sci 2009, 32:613-622.
25. Ni YN, Lai YH, Brandes S, Kokot S: Multi-wavelength HPLC fingerprints
from complex substances: An exploratory chemometrics study of the
Cassia seed example. Anal Chim Acta 2009, 647:149-158.
26. Li J, Li WZM, Huang W, Cheung AWH, Bi CWC, Duan R, Guo AJY, Dong TTX,
Tsim KWK: Quality evaluation of Rhizoma Belamcandae (Belamcanda
chinensis (L.) DC.) by using high-performance liquid chromatography
coupled with diode array detector and mass spectrometry.
J Chromatogr
A 2009, 1216:2071-2078.
27. World Health Organization: Guidelines for the Assessment of Herbal Medicines
WHO, Munich, Geneva; 1991.
28. State Food and Drug Administration of China: Technical Requirements for
the Development of Fingerprints of TCM Injections SFDA, Beijing; 2000.
doi:10.1186/1749-8546-6-9
Cite this article as: Yao et al.: Chemical fingerprinting and quantitative
analysis of a Panax notoginseng preparation using HPLC-UV and HPLC-
MS. Chinese Medicine 2011 6:9.
Submit your next manuscript to BioMed Central
and take full advantage of:
• Convenient online submission
• Thorough peer review
• No space constraints or color figure charges
• Immediate publication on acceptance
• Inclusion in PubMed, CAS, Scopus and Google Scholar
• Research which is freely available for redistribution
Submit your manuscript at
www.biomedcentral.com/submit
Yao et al. Chinese Medicine 2011, 6:9
/>Page 8 of 8