Echocardiography A Practical Guide to Reporting - part 7 doc
Bạn đang xem bản rút gọn của tài liệu. Xem và tải ngay bản đầy đủ của tài liệu tại đây (566.78 KB, 16 trang )
ch08 4/5/07 1:34 pm Page 86
9
ATRIA
• A single LA diameter measurement is still recorded in routine clinical
practice using 2D, usually in a parasternal long-axis view. Normal is
<4.0 cm.
• LA geometry varies, and is not accurately represented by a linear
dimension. LA size needs to be assessed more accurately if there is:
– atrial dilatation noted on the initial study
– hypertension (as a sign of increased filling pressure)
– atrial fibrillation (likely success of cardioversion, thromboembolic
risk)
– mitral valve disease (thromboembolic risk, indirect marker of
severity).
• A simple clinical method is planimetry of the area in a 4-chamber
view, modified if necessary to optimise atrial size (Table 9.1) and
frozen at maximum size just before mitral valve opening. For research
studies, biplane Simpson’s or area–length rule using 4-chamber and 2-
chamber views should be indexed to BSA.
• Atrial dilatation can give a clue to the diagnosis (Tables 9.2 and 9.3).
A guide threshold for RA dilatation is a transverse diameter >5 cm in
the 4-chamber view.
Table 9.1 LA dilatation
1,2
Mild
a
Moderate Severe
LA area (cm
2
) 20–29 30–40 >40
LA volume/BSA (ml/m
2
) 29–31 32–39 >40
a
Interpret within the whole echocardiographic and clinical context
ch09 4/5/07 1:34 pm Page 87
REFERENCES
1. Lang RM, Bierig M, Devereux RB, et al. Recommendations for chamber quantifica-
tion. Eur J Echocardiogr 2006; 7:79–108.
2. Abhayaratna WP, Seward JB, Appleton CP, et al. Left atrial size: physiologic determi-
nants and clinical applications. J Am Coll Cardiol 2006; 47:2357–63.
Echocardiography: A Practical Guide for Reporting
88
Table 9.2 Causes of severe biatrial enlargement
• Apical hypertrophic cardiomyopathy
• Restrictive cardiomyopathy
• Rheumatic disease affecting mitral and tricuspid valves
Table 9.3 Causes of right atrial dilatation
• Tricuspid stenosis or regurgitation
• Pulmonary hypertension
• ASD
• RV myopathy
ch09 4/5/07 1:34 pm Page 88
10
RIGHT HEART
RIGHT VENTRICLE
RV size and function must always be assessed especially if there is:
• RV dilatation on the minimum standard study
• congenital heart disease
• left-sided disease, especially mitral stenosis or severe aortic stenosis
• suspected RV cardiomyopathy
• pulmonary hypertension
• suspected pulmonary embolism
• chronic lung disease
• cardiac transplantation.
1. Is the RV dilated?
• This may be a new finding. Significant RV dilatation is present if the
RV is as large as or larger than the normal LV in the apical 4-chamber
view.
• A simple set of thresholds is given in Table 10.1 (and see Figure 10.1)
and more detailed measurements in Appendix 1.
Table 10.1 Thresholds for abnormal RV size in diastole
1,2
Dilated
a
Tricuspid annulus (cm) >3.0
Maximum transverse (cm) >4.0
Base-to-apex (cm) >9.0
a
These values are derived from two sets of normal ranges
ch10 4/5/07 1:34 pm Page 89
Echocardiography: A Practical Guide for Reporting
90
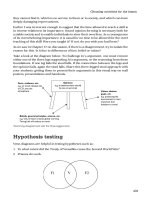
Figure 10.1 Levels for measuring RV size. 1 is at the annulus, 2 is the maximum
transverse diameter, and 3 is base-to-apex. This is a 4-chamber view centred on the
RV in a patient with arrhythmogenic RV dysplasia
Table 10.2 Causes of RV dilatation
Active
• Left-to-right shunt above the RV
• Tricuspid or pulmonary regurgitation
Hypokinetic
• Pulmonary hypertension, especially acute pulmonary embolism
• RV infarction
• RV myopathy
• End-stage pulmonary valve disease or tricuspid regurgitation
1
2
3
2. If large, is the RV active or hypokinetic?
• An active RV suggests an ASD shunt or tricuspid or pulmonary regur-
gitation (Table 10.2).
• A hypokinetic RV suggests pulmonary hypertension, myocardial
infarction, or a myopathy or long-standing severe pulmonary or
tricuspid regurgitation (Table 10.2).
• Look for a regional abnormality of contraction, and also check the
inferior wall of the LV, since about a third of inferior LV infarcts are
associated with RV infarction.
ch10 4/5/07 1:34 pm Page 90
3. Quantification of systolic function using long-axis
measurements
• Place the M-mode cursor on the junction between the RV free wall
and tricuspid annulus in a 4-chamber view. Measure the excursion as
the vertical distance between the peak and nadir (tricuspid annular
plane systolic excursion: TAPSE) (Figure 10.2 and Table 10.3).
• Place the Doppler tissue sample in the RV free wall at the tricuspid
annulus (Figure 10.3 and Table 10.3). Record the peak systolic veloc-
ity. A velocity <11.6 cm/s suggests a reduced RV ejection fraction or
pulmonary hypertension.
3,4
4. Is there RV hypertrophy?
This is defined by a free wall thickness >5 mm. RV hypertrophy suggests:
• Eisenmenger syndrome (pulmonary hypertension as a result of left-to-
right shunting)
• pulmonary stenosis
• hypertrophic cardiomyopathy
• amyloid.
5. Is there left-sided disease?
• RV dilatation as a result of pulmonary hypertension may complicate
severe mitral stenosis, but can also occur in end-stage aortic stenosis
and occasionally mitral regurgitation.
Right heart
91
Table 10.3 Measures of RV function
Long-axis excursion (TAPSE)
Normal range
5
24.9 ± 3.5 mm
RV ejection fraction
6
3.2 × long-axis excursion (mm)
Abnormal threshold
5
<18 mm
Doppler tissue S velocity
Normal range
3
14.0 ± 2.8 cm/s
Normal range
4
15.5 ± 2.6 cm/s
Abnormal threshold
3,4
<11.6 cm/s
ch10 4/5/07 1:34 pm Page 91
Echocardiography: A Practical Guide for Reporting
92
Figure 10.2 Long-axis excursion. Position for placing the M-mode cursor and the
M-mode recording obtained. Measure from nadir (N) to peak (P)
(a)
(b)
N
P
ch10 4/5/07 1:34 pm Page 92
6. Is there evidence of a shunt above the RV?
• If the RV is dilated and active, but no ASD is visible, injection of
agitated saline may show an ASD as a void caused by a left-to-right
jet or by the right-to-left passage of microcavitation.
• Otherwise consider TOE, which is usually necessary to detect a sinus
venosus defect or partial anomalous pulmonary venous drainage.
7. Is there tricuspid and pulmonary regurgitation?
See pages 59 and 61.
Right heart
93
Figure 10.3 Doppler tissue imaging. Position for placing the cursor and the
recording obtained
Checklist for reporting the RV
1. RV size and systolic function
2. Pulmonary pressures
3. Right-sided valve disease
4. Evidence of a shunt
5. Presence of left-sided disease
ch10 4/5/07 1:34 pm Page 93
8. Estimate pulmonary artery pressure
See below.
PULMONARY HYPERTENSION
1. Estimating systolic pressure
• Measure the tricuspid regurgitant peak velocity V
max
. If the signal varies,
take the highest value. Estimate the pressure difference (4V max
2
).
• Estimate the RA pressure range from the response of the IVC
(subcostal view) to inspiration (Table 10.4).
• The sum of these two is the RV systolic pressure. This is the same as
the pulmonary systolic pressure, assuming that there is no pulmonary
stenosis.
2. Estimating diastolic pressure
• Measure the end-diastolic velocity of the pulmonary regurgitant signal
V
ED
(Figure 10.4) and estimate the pressure difference (4V
ED
2
).
• Estimate the RA pressure (Table 10.4).
• The sum of these is the pulmonary artery diastolic pressure (assum-
ing no tricuspid stenosis).
3. Detection of pulmonary hypertension if there is no
measurable tricuspid regurgitant jet
• Place the pulsed sample in the centre of the main PA or the pulmonary
valve annulus. Avoid placing the sample too near the artery wall,
which may give an artefactually sharp signal.
Echocardiography: A Practical Guide for Reporting
94
Table 10.4 Semisubjective estimation of RA pressure from the IVC
Collapse on inspiration Pressure estimate (mmHg)
Complete 0–5
>50% 5–10
25–50% 10–15
<25% 15–20
• With severe tricuspid regurgitation, pressures >20 mmHg may often
occur
• IVC diameter is probably too variable to be a firm guide
ch10 4/5/07 1:34 pm Page 94
Right heart
95
Figure 10.4 Pulmonary regurgitation. PA diastolic pressure is estimated using the
end-diastolic velocity of the pulmonary regurgitant continuous-wave signal added to
an estimate of RA pressure. (a) was recorded in a normal subject and (b) in a
patient with pulmonary hypertension in whom the end-diastolic velocity was 2.0 mls
(a)
(b)
ch10 4/5/07 1:34 pm Page 95
Echocardiography: A Practical Guide for Reporting
96
• Measure the time from the start of flow to the peak velocity (Figure 10.5).
• A time >105 ms excludes pulmonary hypertension
7
while a time
<80 ms makes pulmonary hypertension highly likely. This method is
not accurate enough to give an estimate of absolute pressure.
4. Estimating RV systolic pressure with a VSD
• Measure the brachial artery systolic pressure and subtract 4V
VSD
2
,
where V
VSD
is the peak velocity across the VSD.
5. Assess RV size and systolic function
See page 89.
6. Assess grade of tricuspid regurgitation
See page 59.
7. Look for cardiac causes of pulmonary hypertension (Table
10.5)
• Some of the extracardiac causes may also affect the echocardiogram
(Table 10.5).
Table 10.5 Causes of pulmonary hypertension
Cardiac
• Left-sided disease:
– Mitral valve disease
– Severe aortic stenosis
– Severe left ventricular impairment
• Congenital heart disease
Extracardiac
• Thromboembolic disease
• Chronic lung disease
• Autoimmune disease e.g. SLE (also associated with valve thickening, LV
dilatation, pericardial effusion)
• Scleroderma
• HIV (also causes LV dilatation)
• Drugs, e.g. anorexic agents (also cause valve thickening)
• Primary pulmonary hypertension
ch10 4/5/07 1:34 pm Page 96
Right heart
97
Figure 10.5 PA velocity. A normal waveform with time to peak velocity 144 ms
(a) and a recording in a patient with pulmonary hypertension (b). The time to peak
velocity is short and the signal is notched as a result of increased wave reflectance
(a)
(b)
ch10 4/5/07 1:34 pm Page 97
REFERENCES
1. Triulzi MO, Gillam LD, Gentile F. Normal adult cross-sectional echocardiographic
values: linear dimensions and chamber areas. Echocardiography 1984; 1:403–26.
2. Foale R, Nihoyannopoulos P, McKenna W, et al. Echocardiographic measurement of
the normal adult right ventricle. Br Heart J 1986; 56:33–44.
3. Gin PL, Wang WC, Yang SH, Hsiao SH, Tseng JC. Right heart function in systemic
lupus erythematosus: insights from myocardial Doppler tissue imaging. J Am Soc
Echocardiogr 2006; 19:441–9.
4. Meluzin J, Spinarova L, Bakala J, et al. Pulsed Doppler tissue imaging of the velocity
of tricuspid annular systolic motion; a new, rapid, and non-invasive method of evalu-
ating right ventricular systolic function. Eur Heart J 2001; 22:340–8.
5. Hammarstrom E, Wranne B, Pinto FJ, Purvear J, Popp RL. Tricuspid annular motion.
J Am Soc Echo 1991; 4:131–9.
6. Kaul S, Tei C, Hopkins JM, Shah PM. Assessment of right ventricular function using
two-dimensional echocardiography. Am Heart J 1984; 107:526–31.
7. Kosturakis D, Goldberg SJ, Allen HD, Loeber C. Doppler echocardiographic prediction
of pulmonary arterial hypertension in congenital heart disease. Am J Cardiol 1984;
53:1110–15.
Echocardiography: A Practical Guide for Reporting
98
Checklist for reporting pulmonary hypertension
1. Estimated pulmonary pressures or presence/absence based on time to peak
PA velocity
2. RV size and systolic function
3. Tricuspid regurgitation grade
4. Underlying cause?
ch10 4/5/07 1:34 pm Page 98
11
ADULT CONGENITAL
DISEASE
SIMPLE DEFECTS
1. ASD
• The diagnosis should be considered if the RV is dilated.
• Describe the position. Most are approximately in the centre of the
septum (secundum). ‘Primum’ defects (correctly termed partial AV
septal defects) are next to the AV valves (Table 11.1).
• It is possible to mistake flow from the SVC for flow across an ASD.
Take multiple views. If there is still doubt, consider a contrast injec-
tion or TOE or use pulsed Doppler on the RA side of the septum.
ASD flow has a peak in late diastole and systole. For the SVC, the
peaks are earlier.
• Calculate the shunt as the ratio of flow in the PA to the LV outflow
tract (Table 11.2).
• Estimate the PA pressure (page 94).
• TOE is indicated before device closure of a secundum ASD (Table
11.3) and TTE afterwards (Table 11.5).
Table 11.1 Features of a partial AV septal defect (‘primum’)
• Defect adjacent to the AV valves
• Common AV valve rather than separate tricuspid and mitral valves:
– Lack of offset between left- and right-sided AV valve
– Left AV valve appears ‘cleft’ or trileaflet
• Long LV outflow tract caused by an offset between aortic valve and
‘mitral valve’ (normally the non-coronary aortic cusp is continuous with
the base of the anterior mitral leaflet)
• May be associated with a VSD
ch11 4/5/07 1:35 pm Page 99
Echocardiography: A Practical Guide for Reporting
100
Table 11.2 Levels for shunt calculation
a
Downstream Upstream
ASD PA LV outflow
VSD PA LV outflow
PDA LV outflow Pulmonary valve
a
See page 138.
2. VSD
• Localise the site of the defect (Figure 11.1).
• Estimate the shunt (Table 11.2).
• Assess the LV. LV volume load suggests a large shunt. Volume
overload and systolic dilatation are criteria for closure.
• Estimate PA pressures (page 94).
3. PDA
• Look for reversed flow in the main PA using parasternal short- and
long-axis views and for the defect in the suprasternal view (Figure
11.2a).
• Estimate the PA pressure (page 94). When this is raised, flow through
the duct may diminish, cease, or reverse during systole. When it is
normal, flow is continuous throughout the cardiac cycle (Figure
11.2b).
• Estimate the shunt size (Table 11.2). LV volume load suggests a large
shunt.
4. Coarctation
See page 83.
SYSTEMATIC STUDY
• Congenital disease should be suspected if specific abnormalities are
found (Table 11.4).
• Little or no background information may be available (e.g., new
diagnosis, emergency admission, details of corrective surgery not
available).
ch11 4/5/07 1:35 pm Page 100
Adult congenital disease
101
Table 11.3 What to look for on TOE before device closure
• How many defects or fenestrations?
• Total septal length
• Diameter of defect on imaging and colour in 4-chamber and bicaval
views
• Distance from AV valves
• Distance from IVC and SVC
• Distance from aorta (a margin is not necessary when an Amplatzer
device is used)
• Check correct drainage or right-sided pulmonary veins
• Other cardiac abnormalities, e.g. mitral prolapse
Figure 11.1 Position of VSDs. (a) Parasternal short-axis at aortic level.
(b) Parasternal short-axis at papillary muscle level. (c) Apical 4-chamber.
(d) Apical 5-chamber
Perimembranous
Doubly
committed
subarterial
Muscular
trabecular
Inlet
muscular
ch11 4/5/07 1:35 pm Page 101