Báo cáo y học: "Frequent activation of EGFR in advanced chordomas" pptx
Bạn đang xem bản rút gọn của tài liệu. Xem và tải ngay bản đầy đủ của tài liệu tại đây (2.91 MB, 16 trang )
RESEARC H Open Access
Frequent activation of EGFR in advanced
chordomas
Barbara Dewaele
1*
, Francesca Maggiani
2
, Giuseppe Floris
3
, Michèle Ampe
4
, Vanessa Vanspauwen
1
,
Agnieszka Wozniak
3
, Maria Debiec-Rychter
1
and Raf Sciot
2
Abstract
Background: Chordomas are rare neoplasms, arising from notochordal remnants in the midline skeletal axis, for
which the current treatment is limited to surgery and radiotherapy. Recent reports suggest that receptor tyrosine
kinases (RTK) might be essential for the survival or proliferation of chordoma cells, providing a rationale for RTK
targeted therapy. Nevertheless, the reported data are conflicting, most likely due to the assorted tumor specimens
used for the studies and the heterogeneous methodological approaches. In the present study, we performed a
comprehensive characterization of this rare entity using a wide range of assays in search for relevant therapeutic
targets.
Methods: Histopathological features of 42 chordoma specimens, 21 primary and 21 advance d, were assessed by
immunohistochemistry and fluorescent in situ hybridization (FISH) using PDGFRB, CSF1R, and EGFR probes. Twenty-
two of these cases, for which frozen material was available (nine primary and 13 advanced tumors), were
selectively analyzed using the whole-genome 4.3 K TK-CGH-array, phospho-kinase antibody array or Western
immunoblotting. The study was supplemented by direct sequencing of KIT, PDGFRB, CSF1R and EGFR.
Results: We demonstrated that EGFR is frequently and the most significantly activated RTK in chordomas.
Furthermore, concurrent to EGFR activation, the tumo rs commonly reveal co-activation of alternative RTK. The
consistent activation of AKT, the frequent loss of the tumor suppressor PTEN allele, the recurrent activation of
upstream RTK and of downstream effectors like p70S6K and mTOR, all in dicate the PI3K/AKT pathway as an
important mediator of transformation in chordomas.
Conclusions: Given the complexity of the signaling in chordomas, combined treatment regimens targeting
multiple RTK and downstream effectors are likely to be the most effective in these tumors. Personalized therapy
with careful selection of the patients, based on the molecular profile of the specific tumor, is anticipated.
Background
Chordomas are rare tumors. With an incidence of about
0.05/100000/year, they account for less than 5% of all
primary malignant bone tumors. Mainly adults between
40 and 60 years are affected, but cases of children pre-
senting with chordoma were also rarely reported (5% of
cases). These bone tumors arise from remnants of the
fetal notochord, and hence occur along the mid line, and
most often in the caudal spine or the base of the skull.
They are slowly growing masses with the tendency to
destroy t he surrounding bone and to infiltrate adjacent
soft tissue. Initial symptoms usually relate to local pro-
gression of the disease. Chordomas infrequently meta s-
tasize to lung, bone, soft tissue, lymph nodes and skin.
On histology at low power magnification they show pro-
minent lobules separated by fibrous septa. The tumors
maybearrangedinchordsorsheetsormaybefloating
singularly in the abundant myxoid matrix often present.
The current treatment for chordoma is predominantly
surgery, followed by radiotherapy. Safe margins are
often difficult to obtain because of the anatomical loca-
tion of the tumors [1]. Unfortunately, standard che-
motherapy was shown to be basically unsuccessful,
which causes serious problems for ma naging patients
with locally recurrent or metastatic disease. Survival
* Correspondence:
1
Department of Human Genetics, Catholic University of Leuven, University
Hospitals, Leuven, Belgium
Full list of author information is available at the end of the article
Dewaele et al. Clinical Sarcoma Research 2011, 1:4
/>CLINICAL SARCOMA RESEARC
H
© 2011 Dewaele et al; licensee BioMed Central Ltd. This is an Open Access article distributed under the terms of the Creative
Commons Attribution License ( which permits unrestricted use, distribution, and
reproduction in any medium , provided the original work is properly cited.
rates of 5 and 10 years are 68% and 40%, respectively
[2].
Cytogenetic studies in chordomas have revealed in
general nearly diploid or rather hypodiploid karyotypes,
with a number of numerical and structural rearrange-
ments. Rec urrent genetic events reported in chordoma
include frequent losses of large parts of chromosomes 3,
4, 10 and 13 and the most commonly lost regions are
1p31-pter, 3p21-pter, 3q21-qter, 9p24-pter and 17q11-
qter [3]. The most common gains affect the chromo-
some 5q and the entire chromosomes 7 and 20 [4,5].
Loss of heterozygosity at 1p36 was also found in familial
chordomas, further supporting the hypothesis that an
important tumor suppressor might be located at the dis-
tal part of 1p [6]. Importantly, the CDKN2A tu mor sup-
pressor gene, which maps to 9p21.3, is reported to be
lost in a high percentage (60%) of chordomas [7,8]. In
addition, loss of one copy of the PTEN tumor suppres-
sor gene (l ocated on 10q23.31) was found in 37% (7/19)
of lesions, although no difference in PTEN expression
level was shown by Western blotting [8].
In the literature, several RTK, specifically PDGFRA,
PDGFRB, KIT, EGFR, MET and HER2, were reported to
be expressed in chordoma by immunohistochemistry
[9-12]. Given that RTK could prove to be essential for
the survival or proliferation of chordoma tumor cells,
targeting these RTK using antibodies or small molecule
tyrosine kinase inhibitors (TKI) might offer new treat-
ment options for chordoma patients. Interestingly, ima-
tinib was found to have antitumor activity in patients
with chordoma [13]. It was suggested that PDGFRB sig-
naling might be implicated in the tumor growth, as ima-
tinib-responding tumors were found to be
immunohistochemically positive for PDGFRB. Ex pres-
sion of basic fibroblast growth factor (bFGF), transform-
ing growth factor alpha (TGF alpha) and fibronectin was
reported to correlate with an increased incidence of dis-
ease recurrence in chordoma [14]. Moreover, clinical
response to imatinib in o ne case was accompanied by
the inhibition of PDGFRB as demonstrated by Western
blot [13]. In recent reports, Tamborini and co-workers
characterized 22 chordomas by immunoprecipitation
and antibody arrays. The activation of PDGFRA,
PDGFRB, KIT, FLT3, CSF1R, EGFR, HER2, HER4, AXL
and DTK was reported in these studies [8,11]. Notably,
PDGFRB activation was found in 95% (21/22) of cases.
The EGFR activation, mainly through EGFR/HER2 het-
erodimer formation, was also suggested. Other groups
found EGFR activation in three out of three and in
about 50% of chordomas evaluated by RTK antibody
arrays and immunohistochemistry respectively [15,16].
Partial response of metastatic chordoma to combined
cetuximab/gefitinib treatment suggests that EGFR tar-
geted treatment may benefit chordoma patients [9]. In
addition, expression of the MET oncogene has been
reported in chordoma [10]. Of note, the MET oncogene
is known to be expressed in various chondroid neo-
plasms, normal articular cartilage and fetal notochord
[17,18]. Given their possi ble relationship to notochordal
development and chondro id differentiation, further
investigation is warranted to clarify the roles of these
and other RTK in chordomagenesis.
Activities of effectors more downstream in the main
RTK pathways were also recently described. The ER K1/2,
AKT and STAT3 activity was demonstrated in 18 (86%),
16 (76%) and 14 (67%) of cases, respectively, by immuno-
histochemistry performed on 21 chordomas [15].
Furthermore, analysis of 22 chordomas by Tamborini
and co-workers showed c onsistent ERK1/2 activation in
all the cases, and activation of AKT in 20 (91%), mTOR
in 18 (82%), and S6 in 16 (73%) of the tumors [8].
In the p resent study, we have performed a compre-
hensive molecular and biochemical analysis of 42 chor-
domas, focusing on the role of RTK and their
downstream signaling pathway in chordoma develop-
ment, in primary tumors or their recurrent/metastatic
counterparts.
Methods
Patients and histopathology
The present study included 31 patients [16 women and
15 men; age range 18-84 (median 58 years)] (Table 1).
In total, 42 tumor specimens from these patients were
retrieved, of which 21 were annotated as primary
tumors and 21 as recurrences or metastases (in the text
further referred to as advanced cases). The primary
chordomas originated from the spine (n = 9), the
sacrum (n = 10), the clivus (n = 1), and the cervix (n =
1). Samples 10a and 10b represent primary samples
fromthesamepatientobtainedbyneedlebiopsyand
subsequent surgical resectio n, respectively. Histopatho-
logical examination was performed on formalin fixed,
paraffin embedded tissue. Five μmsectionswereused
for routine hematoxylin and eosin (H&E) staining, and
immunohistochemical staining was performed by the
avidin-biotin-peroxidase complex method, using the fol-
lowing monoclonal (mc) and polyclonal (pc) antibodies:
Pankeratin (mc, dilution 1:200; Serotec, Oxford, UK),
Epithelial Membrane Antigen (EMA) (mc, 1:50; DAKO,
Glostrup, Denmark), Multikeratin (mc, dilution 1:10;
Novocastra, Newcastle Upon Tyne, UK), S-100 protein
(pc, 1:300; D AKO) and Vimentin (mc, dilution 1:500,
DAKO). In addition, the EGFR (EGFR PharmDxTM,
DAKO) and HER2/ERBB2 (HercepTestTM, DAKO)
staining kits were used. EGFR and HER2 protein expres-
sion was reported as membranous brown staining of
neoplastic cells using a three-tier system ranging from
“1+” to “3+”.
Dewaele et al. Clinical Sarcoma Research 2011, 1:4
/>Page 2 of 16
Table 1 Pathologic description of chordoma cases and results summary
Cases Gender Age Tumor
status
Site Immuno FISH Proteome
profiler array
TK
Mut
Western TK
aCGH
EGFR HER2 EGFR HER2 PDGFRB/
CSF1R
PTEN P-
EGFR
P-
PDGFRB
EGFR PDGFRB
1a F 56 P Spinal 1+ neg dis. dis. polys. nd nd nd nd nd nd nd
1b R Spinal neg nd dis. dis. polys. nd weak weak nd nd nd nd
2a M 33 R Spinal 1+ nd dis. dis. polys. nd nd nd nd nd nd nd
2b M 3+ nd dis. dis. polys. nd nd nd neg E E nd
3 F 43 R Spinal 3+ neg polys. dis. dis. dis. strong weak neg nd nd table
2
4a M 62 P Spinal neg nd dis. dis. dis. dis. nd nd nd nd nd nd
4b M 2+ nd polys. dis. polys. monos. interm weak neg E neg table
2
5 F 75 R Sacrum 3+ neg polys. polys. polys. polys. nd nd neg E/P E table
2
6 M 60 R Clivus 3+ nd dis. monos. dis. dis. strong interm. nd nd nd nd
7a F 62 P Sacrum neg nd polys. dis. dis. dis. nd nd nd nd nd nd
7b R Sacrum 2+ nd polys. monos. dis. monos. nd nd neg E/P E table
2
8 M 36 P Clivus neg nd dis. dis. dis. nd nd nd nd nd nd nd
9 M 52 R Coccyx 1+ 1+ monos. dis. dis. dis. nd nd neg E/P E table
2
10a F 41 P Spinal neg nd polys. dis. loss dis. nd nd nd nd nd nd
10b P Spinal neg nd polys. dis. loss monos. nd nd neg neg E/P table
2
10c R Spinal neg nd polys. dis. polys. nd nd nd nd nd nd nd
11 F 54 P Cervical 2+ nd polys. dis. dis. nd strong weak nd nd nd nd
12a M 55 P Sacrum 3+ neg l.l.amp. dis. dis. monos. nd nd neg nd nd nd
12b M 3+ 2+ h.l.
amp.
dis. polys. nd strong weak nd E/P E nd
13 M 80 R Coccyx 2+ nd polys. polys. polys. polys. interm weak neg nd nd table
2
14 F 60 R Sacrum 1+ nd dis. polys. dis. monos. nd nd neg E/P E table
2
15a F 73 P Spinal neg nd dis. dis. dis. monos. nd nd neg nd nd table
2
15b R Spinal neg nd polys. polys. polys. nd nd nd nd E E nd
16 M 84 R Sacrum 1+ neg dis. dis. dis. dis. nd nd neg nd nd table
2
17a F 58 P Sacrum 2+ 1+ polys. dis. dis. nd strong interm. neg nd nd table
2
17b R Sacrum 3+ neg polys. dis. dis. nd nd nd nd nd nd nd
18 F 57 P Sacrum 3+ neg polys. dis. dis. dis. strong weak nd nd nd nd
19 M 84 P Lumbal 1+ nd dis. monos. dis. nd nd nd nd nd nd nd
20 M 81 P Sacrum 3+ neg l.l.amp. dis. polys. nd strong weak nd nd nd nd
21 F 67 P Sacrum 1+ 1+ h.l.
amp.
dis. dis. nd interm weak nd nd nd nd
22 F 47 P Sacrum 1+ nd dis. dis. dis. nd weak weak nd nd nd nd
23 M 48 P Spinal nd nd dis. dis. dis. nd nd nd nd nd nd nd
24 F 60 R Clivus/
nc
3+ nd polys. polys. polys. polys. nd nd nd nd nd nd
25 F 60 R Sacrum neg nd monos. dis. nd nd nd nd nd nd nd nd
26 M 80 M nd nd polys. polys. polys. loss nd nd nd nd nd nd
27 M 48 P Sacrum 1+ nd dis. dis. nd nd nd nd nd nd nd nd
28 F 18 P Spinal nd nd dis. dis. nd nd nd nd nd nd nd nd
29 M 37 P Spinal 3+ neg dis. dis. nd nd nd nd nd nd nd nd
Dewaele et al. Clinical Sarcoma Research 2011, 1:4
/>Page 3 of 16
Array-CGH (aCGH) analysis
Array-CGH experiments were performed as previously
described on DNA extracted from 11 tumors (Table 2)
[19]. For genomic profiling that included the evaluation
of all 90 TK known in humans, the 4.3 K genomic DNA
tyrosine kinase array (TK-aCGH) was manufactured at
the Microarray Facility of the Flanders Interuniversity
Institute for Biotechnology, KULeuven [20]. In short,
the Sanger 1 Mb Clone Set containing 3527 BAC/PAC
clones was supplemented with 800 clones from 32 K
CHORI BAC/PAC library, which specifically covers all
known human TK, and these two clone sets were
spotted tog ether in duplicate on Code Linked Slides (AP
Biotech, US). The complete list of these clones is avail-
able upon request. The array-CGH data were statistically
analyzed with aCGH-smooth, software especially
designed for the analysis of heterogeneous samples [21].
Fluorescence In Situ Hybridization (FISH)
Dual-color in terphase FISH analysis was carried out on
4 μm paraffin e mbedded tissue sections of 42 tumor
biopsies. Sections were pretreated using the SPoT-Light
Tissue Pre-treatment Kit (Invitrogen, Life Technologies),
according to the instructions of the manufacturer. FISH
was performed as previously described [22]. Slides were
counterstained with 0.1 μM 4,6-diamidino-2-phenylin-
dole (DAPI) in an antifade solution for microscopy.
For ana lysis of EGFR family members, FISH was per-
formed using the locus specific identifier (LSI) EGFR-
SpectrumOrange(SO)/CEP7-SpectrumGreen(SG) and
PathVysion HER2-SO/CEP17-SG probes (Applied Bio-
systems/Ambion, Life Technologies, Carlsbad, CA,
USA). For evaluation of PDGFRB/CSF1R copy numbers
and PDGFRB/CSF1R integrity, the SG-labeled bacterial
artificial chromosome (BAC) RP11-21I20 (which maps
Table 2 Gains and losses in chordoma using whole-genome 4.3 K TK-CGH-array
Case 3 Case 4b Case 5 Case 7b Case 9 Case 10b Case 13 Case 14 Case 15a Case 16 Case
17a
Gains 1q11-qter
7
8q11.21-
qter
10pter-p11
20
5
7
2pter-p12 16q12.2-
q22.1
n.d. 7 13q31.2-
qter
1q11-qter
2
12pter-
q24.23
17q12.1-
qter
X
n.d. n.d. n.d.
Losses 3pter-p11.1
8pter-p12
9
14
16q23.2-
q24.3
1pter-p11
3
4
10
11pter-
11p11
13
14
18
22
Y
1pter-p11.2
3p24.1-p13
3q11.2-
q13.31
3q26.1-
26.31
3q28-qter
4p15.31-
q21.21
5pter-p15.2
9pter-p21.1
9q34.11-
qter
11q12.2-
q13.3
13q21.3-
q21.33
13q33.1-
qter
19
22
1pter-p13.1
3
4pter-p16.1
6p22.3-p21.1
9
10
13q12.11-
q12.13
16q12.1-
q12.2
16q22.3-
q24.3
17q12-
q21.33
19p13.3-
p13.11
19q13.31-
qter
2q21.1-qter
3q11.2-q28
5q35.2-qter
7pter-p22.1
8pter-
p11.21
11q12.2-
q13.3
16pter-
p12.1
17pter-
p11.2
18q11.2-
qter
20q11.21-
qter
22
1
3pter-p12.1
9pter-p21
10
19p13.3-
p13.2
22q12.2-
qter
X
3pter-
p14.2
9
14
3
9pter-p11
10
14
17pter-p12
19p13.3-
p13.2
1pter-p32.3
1p22.3-
p21.3
1p21.2-
p13.2
2pter-p11.2
2q31.2-qter
6pter-p21.1
9
10q11.23-
q24.2
18q11.2-q23
19
21
22
1pter-
p33.2
3pter-
p11.2
22q12.1-
qter
n.d.
n.d.: not detected.
Table 1 Pathologic description of chordoma cases and results summary (Continued)
30a M 42 P Coccyx neg neg monos. dis. nd nd nd nd nd nd nd nd
30b 58 R Sacrum 2+ neg monos. dis. nd nd nd nd nd nd nd nd
31a F 60 P Sacrum neg 1+ polys. dis. nd nd nd nd nd nd nd nd
31b R Ilium neg nd polys. dis. nd nd nd nd nd nd nd nd
TK Mut., Tyrosine Kinase Mutations; P, primary; R, recurrence; M, metastasis; nc, nasal cavity; neg, negative; l.l.amp., low level amplification; h.l.amp., high level
amplification;
polys., polysomy; dis., disomy; monos., monosomy; nd, not done; interm, intermediate; E, expressed; P, phosphorylated.
Dewaele et al. Clinical Sarcoma Research 2011, 1:4
/>Page 4 of 16
cent romeric to PDGFRB/5q33.1 and covers the adjacent
CSF1R gene) and the SO-labeled RP11-368O19 (which
maps telomeric to CSF1R and covers the PDGFRB gene)
DNA probes (both from Research Genetics, Huntsville,
AL, USA) were used. In addition, the PTEN copy num-
bers were investigated using dual-color LSI PTEN/
CEP10 probe (Applied Biosystems/Ambion).
Hybridization signals were visuali zed using an epi-
fluorescence microscope (Leica DMRB, Wetzlar, Ger-
many) equipped with a cooled CCD camera and run by
the ISIS digital image analysis system (MetaSystems,
Altlussheim, Germany). One hundred nuclei wer e evalu-
ated for the number of red and green signals in different
areas corresponding to tumor tissues.
FISH results were classified into five categories
acco rding to the percentage of tumor cells with a speci-
fic gene/CEP ratio and according to the gene copy num-
ber per nucleus: 1) monosomy (1 signal from the gene
paralleled by one chromo some centromere signal) or
loss (a gene/CEP ratio of <0.6) in >40% of cells; 2) dis-
omy (2 signal s from the gene/CEP probes); 3) polysomy
(defined as > 2 gene signals per nucleus paralleled by
similar increases in chromosome centromeric signals in
at least 10% of tumor cells); 4) low level gene amplifica-
tion (gene/CEP ratio of > 2 in 10%-40% of tumor cells)
or 5) high level gene amplification (presence of gene
cluster s or a gene/CEP rati o of > 2 in ≥40% of analyzed
cells).
Mutation analysis
Mutational analysis was performed on genomic DNA
extracted from frozen tumor tissues (n = 13). The
sequence coding for the juxtamembrane and/or kinase
domains of PDGFRA and PDGFRB (exons 12, 14 and
18), KIT (exons 9, 11 and 17), CSF1R (exons 10 to 20)
and EGFR (exons 18 to 21) genes, were a mplified by
polymerase chain reaction (PCR), using standard Taq
DNA polymerase (Roche Diagnostics, Basel, Switzerland)
and t he ABI PRISM 9700 (Applied Biosystems). Geno-
mic sequences were obtained from online databases
from the National Center for Biotechnology Information
(NCBI), and specific primers for amplified fragments
were designed using the Primer3 software [23] (http://
frodo.wi.mit.edu/cgi-bin/primer3/primer3_www_slow.
cgi). Primers sequences are available upon request. The
PCR products were purified (QIAquick PCR Purification
Kit, QIAGEN, Hilden, Germany) followed by direct bi-
directional cycle sequencing using the A BI PRISM 3130
XL Genetic Analyzer (Applied Biosystems, Foster City,
CA, USA).
Western immunoblotting
Celllysisoffrozentumors(n=9),SDS-PAGE,and
immunoblotting were carried out as previously
described [22]. In short, tumor lysate aliquots containing
30 μg of protein were electrophoresed and blotted to
PVDF membranes (GE Healthcare, UK). Membranes
were blocked in P BS containing 5% blocking reagent
(non-fat milk) and immunoblotted sequentially using
rabbit antibodies against phospho-EGFR(Tyr1068)
(Santa Cruz Biotechnology, Santa Cruz, CA, USA), total
EGFR (Santa Cruz Biotechnology), phospho-PDGFRB
(Y751) (mc; Cell Signaling, Beverly, MA, USA), total
PDGFRB (mc; Cell Signaling), phospho-KIT(Tyr703)
(mc; Invitrogen, Life Technologies), total KIT (pc;
DAKO), phospho-ERK1/2 (Cell Signaling), total ERK1/2
(Cell Signaling), phospho-AKT (Cell Signaling) and total
AKT (Cell Signaling), diluted in 5% blocking reagent.
Total b-actin (Sigma Aldrich, St. Louis, MO, USA) was
used as a protein-loading and transfer control. The
HRP-conjugated anti-rabbit IgG (DAKO) were used at a
dilution of 1:2000, and visualized with Enhanced Chemi-
luminescence (Thermo Scientific, Rockford, IL, USA).
Receptor tyrosine kinases (RTK) activation profiling using
antibody arrays
The activation of RTK and their downstream signaling
pathways were analyzed using the Proteome Profiler™
Array kits (ARY001 and ARY003, R&D Systems, Min-
neapolis, MN, USA) in 12 fresh frozen chordoma tumor
specimens. Assays were performed according to the
manufacturers’ protocol, and using 500 μgofprotein
lysate per arra y. The images were captured and the level
of RTK activation was visualized with the FUJI mini-
LAS3000-plus imaging system (FUJIFILM, Tokyo, Japan)
and densitometrically quantified with AIDA software
(Raytest isotopenmessgeräte GmbH, Straubenhardt, Ger-
many). The signal intensities of the probes and the local
background of the probes were log
2
transform ed in
order to obtain a more sy mmet ric distribution, and the
differencebetweenthesetworesultedinalog
2
trans-
formed ratio (further referred to as log
2
-intensity ratios).
For data normalization, within an array and within a
membrane the mean log
2
-intensity ratio was calculated
and then subtracted from the log
2
-intensity ratio of each
probe. Subsequently, the mean of the log
2
-intensity
ratiosforeachkinasewithinanarraywascalculated.In
the statistical analysis, a linear mixed model was used
instead of a one-sample t-test per probe since the arrays
or membranes used to measure the probe intensities
maydiffer.Thelinearmixedmodelhasthelog
2
-inten-
sity ratios as responses, the probes as fixed effects and
the membrane as random effect per array [24,25]. The
alpha level was set at 5%. As multiple testing correc-
tions, the p-values from the tests for the different probes
were adjusted to control the false discovery rate as
described by Benjamini and Hochberg [26]. The ranking
of the pro bes was based on the adjusted p-values. All
Dewaele et al. Clinical Sarcoma Research 2011, 1:4
/>Page 5 of 16
analyses were performed with the statistical package
SAS (version 9.2), using the procedure PROC MIXED
for the linear mixed model.
Results
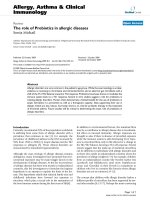
Histopathology and immunohistochemistry
All the chordomas in our cohort were reviewed and
classified as conventional chordomas by m eans of mor-
phology and immunohistochemistry (IHC). They show
prominent lobules separated by fibrous septa. The
tumor cells are arranged in cords or sheets or may be
floating singularly in the abundant myxoid matrix often
present. The histologic hallmark is characterized by
large tumor cells with abundant vacuolated cytoplasm,
referred to as physaliphorous cells [2]. The tumor cells
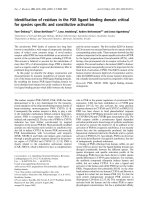
co-express keratin, EMA and S-100 protein. Of the 39
chordomas tested by IHC for EGFR expression, 19 were
primary and 20 were advanced lesions. The EGFR
immunopositivity was found in 26 out of 39 cases
(67%), showing different levels of reactivity (Figure 1,
Table 1). Thus, 11 tumors presented with an intense
and diffuse cytoplasm membrane positi vity in more than
10% of the cells (scored as “3+” ), six cases showed
intense positive staining but in less than 10% of the cells
(scored as “2+”), and nine o ther cases were considered
weakly and discontinuously stained in more than 10% of
the cells (scored as “1+” ). EGFR expression was more
frequently found in advanced tumors compared with
primary tumors (80% versus 58%, respectively). In detail:
15 out of 20 advanced cases stained positive for EGFR
versus 11 out of 19 primary cases. Additionally, when
comparing the primary and the advanced stage within
patients, in cases 2, 4, 7, 17 and 30: stronger EGFR
staining was observed in the advance d in comparison
with the primary stage. Case 12 showed intense and dif-
fuse (3+) staining in both the primary and the advanced
stage. Ca se 1 was the only exc eption, showing stronger
EGFR staining in the primary than in the advanced
stage. Cases 10, 15 and 31 stained negative for EGFR in
the primary stage an d stayed negative upon progress ion.
HER2 expression was tested in 16 cases, of which 11
were negative, four displayed low level of staini ng inten-
sity and one case showed intense positive staining, albeit
in less than 10% of the cel ls. HER2 expression was
almost as frequent in primary as in advanced tumors
(33% versus 29%, respectively). The HER2 immunoposi-
tivity was associated with EGFR co-expression in all but
one lesion, although the level of EGFR expression was
heterogeneous.
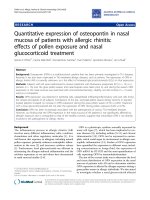
aCGH study
Using the whole genome 4.3 K TK-array, we studied
copy number aberrations (CNA) in eleven cases for
which frozen tissue was available. Ten out of the 11
tumors analyzed showed CNA by aCGH. CNA frequen-
cies were calculated on these ten cases with CNA.
Losses were more common than gains, supporting pre-
viousfindingsinchordoma[7].Therewasamedianof
one gain (range 0-5) and seven losses (range 0-14) per
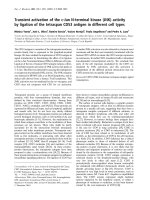
tumor. Genomic losses affecting five or more tumors (≥
50% of cases) were identified on chromosomes 1, 3, 9,
10,19and22(Table2and3,Figure2).Thesmallest
common region of chromosome 3 deletion, covering
bands 3p24.1-p14.2, was lost in eight cases. Three
regions located on the short arm of chromosome 1, i.e.
1pter -p33.2, 1p22.3-p21.3 and 1p21.2-p13.2, were recur-
rently lost in six, five and five cases, respectively. Whole
chromosome 9 loss was observed in four cases, and the
region 9q34.11-qter, involving among others the TSC1
tumor suppressor gene, was lost in one additional case.
Furthermore, the region 9pter-p21 was lost in three
extra cases of our cohort. Of note, ho mozygous deletion
of the chromosomal sub-band 9p21.3 (the r egion con-
taining the CDKN2A tumor suppressor gene) was found
in three of analyzes tumors. The entire chromosome 1 0
was lost in four cases and the region 10q11.23-q24.2,
encompassing the tumor suppressor PTEN, was lost in
another case. Losses that implicated chromosome 19,
with the commonly deleted region 19p13.3-p13.2, were
found in five cases. Total or partial chromosome 22
deletions, with the common region 22q12.2-qter, were
recorded in six chor domas. The most common gain was
the g ain of the entire chromosome 7, observed in three
chordoma cases (Table 2). Notably, the genes coding for
the EGFR, MET, LM TK2, EPHA1, EPHB4 and EPHB6
proteins are mapped on chromosome 7. No amplifica-
tions or rearrangements within the 90 known TK were
detected in our cohort of chordomas.
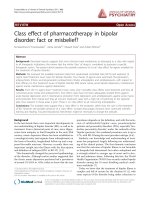
FISH analysis
ThegenecopynumbersoftheEGFR, HER2, CSF1R/
PDGFRB and PTEN were analyzed by FISH (Figure 3,
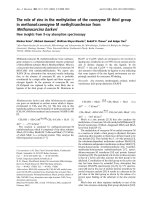
Table 1). Sixteen out of 42 tumors analyzed revealed
disomy for EGFR, while 16 (38%) cases displayed polyso-
mic cell clones. Two cases showed chromosome 7 polys-
omy. Only a small fraction of tumors (four cases)
presented with EGFR amplification, and only in two
cases at high level. Notably, four cases showed EGFR
loss. The gene copy number of HER2 was also analyzed
in all cases, and six specimens revealed polysomy of
HER2.ThreecasesshowedHER2 loss. Of note, half of
the HER2 gains were not detectable by aCGH, probably
due to a low number of neoplastic cells in these speci-
mens. Copy number gains of both, EGFR and HER2
genes, correlated well with HER2 immuno-positivity by
IHC. Of the 34 cases analyzed, 13 tumors wer e polyso-
mic for CSF1R/PDGFRB and two revealed loss of
CSF1R/PDGFRB; the remaining presented disomy for
Dewaele et al. Clinical Sarcoma Research 2011, 1:4
/>Page 6 of 16
AB
CD
EF
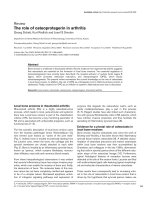
Figure 1 Histology and EGFR protein expression in chordomas. A and B/ Examples of histologic appearance of chordomas stained with
hematoxylin and eosin (H&E). C - F/ Illustration of chordoma cases with heterogeneous type of positive EGFR immunostaining. F/ The typical
physaliphorous cells with abundant vacuolated cytoplasm, showing EGFR membrane staining.
Dewaele et al. Clinical Sarcoma Research 2011, 1:4
/>Page 7 of 16
these genes. The tumor suppressor PTEN was lost in
seven out of 18 analyzed tumors.
Mutation analysis
No activating mutations of EGFR,CSF1R,PDGFRB,
PDGFRA or KIT in examined genes’ exons were found
in any of the 13 analyzed cases (Table 1).
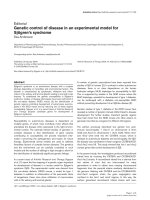
RTK phosphorylation profiling using phospho-RTK and
phospho-kinase antibody arrays
The results of the RTK- and kin ase-ana lysis of 12 and
10 chordoma samples respectively are shown in Table 4
and e xamples are depicted in Figure 4. The probes are
ranked according to their false discovery rate (fdr)
adjusted p-value. The column “Estimate” shows the esti-
mate mean log
2
-intensity ratio for ea ch RTK or kinase
over all experiments. The first three RTK-probes and
the first twelve kinase-probes in Table 4 have a log
2
-
intensity ratio significantly larger than zero at the alpha
level of 5%. Thus, the EPHB2, EGFR and macrophage-
stimulating protein receptor (MSPR) were found to be
significantly activated in chordoma. Although present in
some of the analyzed specimens, activation of the
PDGFRB, FGFR3, CSF1R and ERBB4 was not statisti-
cally significant in our study. Strikingly, there was no
detectable activation of KIT or VEGF receptors. By ana-
lyzing the signaling pathways (the profi les of 46 kinas es
and protein substrates), AKT, RSK1/2/3, TP53, MSK1/2,
YES, p38a , p70 S6K, CREB and SRC were the most fre-
quently and strongest p hosphorylated proteins in our
cohort. Interestingly, SRC family members, as SRC and
YES, were recurrently activated in chordoma. Further-
more, kinase-array revealed the activation of down-
stream effectors of both, the PI3K/AKT/mTOR and
RAS/RAF/MAPK pathways.
Western immunoblotting
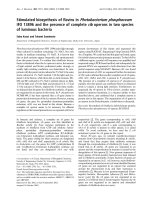
The consistent protein expression of EGFR and
PDGFRB and the recurrent activation of EGFR were
confirmed by Western blotting (Figure 5). The expres-
sion status of EGFR in all cases was in agreement with
the results obtained by IHC (Table 1 Figure 5). Briefly,
Table 3 Recurrent copy number losses in chordoma cases
by aCGH
Regions lost in ≥ five cases
Chordoma cases (#) Cytogenetic
location
Frequency Candidate
genes
4b, 5, 7b, 10b, 15a, 16 1pter-p33.2 0.60 RUNX3
4b, 5, 7b, 10b, 15a 1p22.3-p21.3 0.50
3, 4b, 5, 7b, 10b, 13,
14, 16
3p24.1-p14.2 0.80 RBM5, FHIT,
PTPRG
4b, 5, 7b, 9, 14 3q11.2-q13.31 0.50
4b, 5, 7b, 9, 14 3q26.1-26.31 0.50
3, 5, 7b,10b, 13, 14,
15a
9pter-p21 0.70 CDKN2A
3, 5, 7b, 13, 15a 9q34.11-qter 0.50 TSC1
4b, 7b, 10b, 14, 15a 10q11.23-q24.2 0.50 PTEN
5, 7b, 10b, 14, 15a 19p13.3-p13.2 0.50
4b, 5, 9, 10b, 15a, 16 22q12.2-qter 0.60 CHEK2
losses
gains
amplification
1pter-p33.2
3p24.1-p14.2
3q11.2-q13.31
9pter-p21
9q34.11-qter
19p13.3-p13.2
22q12.1-qter
+ 1q
+ 2p
+ 7
60%
40%
20%
0%
-20%
-40%
-60%
-80%
-100%
1 3 5 7 9 11 13 15 17 19 21
2 4 6 8 10 12 14 16 18 20 22
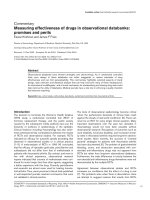
Figure 2 Frequency (%) of gained and lost regions detected by 4.3K TK aCGH in chordomas. Gains are shown in grey, losses in blue and
amplification in black. Important recurrent gains and losses are circled in red. No rearrangements or high level amplification of genes encoding
TK were detected.
Dewaele et al. Clinical Sarcoma Research 2011, 1:4
/>Page 8 of 16
cases 15b and 10b showing only faint EGFR staining on
the Western blot were scored negative by immunostain-
ing. All other cases, presenting clear or intense EGFR
expression by Western, were immune-scored accord-
ingly as “ 1+” , “2+” or “3+” .Twospecimenswereana-
lyzed in parallel by Western immunoblotting and RTK
antibody array. The strong EGFR activation of case 12b
detected by Western was co nfirmed by RTK a ntibody
array. I n case 4b, EGFR was expressed but not activated
by Western. However, intermediate activation of EGFR
was disclosed for this lesion by RTK antibody array.
This apparent differen ce could be ascribed to the fact
that the antibody used for Western blot detects the
phosphorylation status of just one EGFR tyrosine resi-
due(Y1068),whiletheantibodyarraydetectsthephos-
phorylation o f all tyrosine residues on the EGFR
protein. Furthermore, different pieces of the tumor were
used as starting material for both experiments, which
may bring about differences, as chordomas are proven
to be heterogeneous lesions. By Western immunoblot,
PDGFRB was found to be expressed in all chordomas
analyzed, although only one case (#10b) also presented
activated PDGFRB. KIT protein expression and low
level activation was found in three and two cases
respectively.
Discussion
Recent reports suggest that RTK might be essential for
the survival or proliferation of chordoma tumor cells.
Therefore, targeting RTK may o ffer new therapeutic
options for ch ordoma treatment. Nevertheless, there are
important discrepancies between the reported results,
which are most likely due to differences in the relative
sensi tivities of the methods used or heterogeneity of the
A B
C
D
Figure 3 Representative examples of dual-color interphase FISH images on paraffin sections in chordomas.Detectedbytheco-
hybridization of SpectrumOrange labeled EGFR DNA probe (red signals) and SpectrumGreen labeled chromosome 7 CEP probe (green signals).
(A) Case 1a, showing EGFR disomy. (B) Case 10a reveals EGFR polysomy. (C) Case 20 shows low level amplification in < 10% of nuclei. Of note,
this amplification is not detected by aCGH. (D) Case 12b, showing high level amplification of EGFR in > 40% of nuclei.
Dewaele et al. Clinical Sarcoma Research 2011, 1:4
/>Page 9 of 16
material analyzed. Moreover, the characterization o f
chordoma in most studies is rarely based on parallel
multiple techniques. Our objective was to characterize
this rare entity in se arch for relevan t therapeutic targets
using a wide range of methodological approaches.
Whole genome 4.3 K TK-array CGH revealed moder-
ately complex CNA across the genome in all but one
examined cases, with losses more common than gains.
The CNA found in our cohort were in accordance with
previously recognized imbalances in chordomas
[3,4,7,27- 29]. No deletions or gains common to all sam-
ples were found, confirmi ng that chor domas are geneti-
cally heterogeneous tumors.
Importantly, we did not identify any amplifications or
rearrangements involving genes coding for TK.
Interestinglythough,themostrecurrentcopynumber
gain, found in three out of ten cases, involved the entire
chromosome 7. Gain of chromosome 7 is fr equently
reported in chordomas, and multiple genes that encode
TK are located on chromosome 7, including the EGFR
[3,4,7,27-29]. Accordingly, copy number gains involving
the EGFR locus, were found by FISH in 22/42 (52%) of
our cases. Polysomy of the EGFR/ERBB1 gene was pre-
viously reported in a subset of chordomas, and the
EGFR is an interesting target for therapy in chordoma
based on the availability of targeted molecular inhibitors
[8,16]. Additionally, the status of the gene encoding
HER2, a close family member and important dimeriza-
tion partner of EGFR, was investigat ed. Copy number
gains of HER 2 were identified in 6/42 (14%) of case s.
Table 4 Significantly phosphorylated RTK and kinase sites in chordoma using Proteome Profiler arrays, ranked based
on p-value
Probe name Estimate Standard Error t-value Raw p-value fdr adjusted p-value
Phospho-RTK
EPHB2 0.1285 0.0263 4.9 6.6931E-07 2.8111E-05
EGFR 0.6762 0.1694 3.99 3.8547E-05 0.0008
MSPR 0.1241 0.0426 2.91 0.0019 0.0266
PDGFRB 0.0848 0.0334 2.54 0.0057 0.0600
FGFR3 0.1022 0.0484 2.11 0.0177 0.1487
CSF1R 0.0887 0.0445 1.99 0.0236 0.1652
ERBB4 0.0160 0.0289 1.78 0.0379 0.2272
Phosphorylated kinase site
AKT (T308) 0.3117 0.0313 9.95 3.1253E-21 1.5001E-19
RSK 1/2/3 (S380) 0.1747 0.0212 8.25 1.2388E-15 2.9731E-14
TP53 (S46) 0.2394 0.0336 7.14 2.3075E-12 3.6920E-11
MSK 1/2 (S376/S360) 0.1557 0.0256 6.09 1.3564E-09 1.6277E-08
YES (Y426) 0.1639 0.0288 5.69 1.2512E-08 1.2012E-07
TP53 (S15) 0.2533 0.0469 5.41 5.5176E-08 4.4141E-07
p38a (T180/Y182) 0.2858 0.0625 4.57 3.2798E-06 2.2490E-05
p70 S6K (T421/S424) 0.1086 0.0242 4.49 4.6993E-06 2.8196E-05
CREB (S133) 0.3273 0.1018 3.21 0.0007 0.0038
RSK 1/2 (S221) 0.0707 0.0246 2.87 0.0022 0.0104
SRC (Y419) 0.0934 0.0349 2.68 0.0038 0.0158
TP53 (S392) 0.1237 0.0464 2.67 0.004 0.0158
TOR (S2448) 0.2407 0.1258 1.91 0.0284 0.105
JUN (S63) 0.0863 0.0533 1.62 0.053 0.1818
HSP27 (S78/S82) 0.1048 0.0691 1.52 0.0647 0.2016
eNOS (S1177) 0.2002 0.1331 1.50 0.0672 0.2016
STAT1 (Y701) 0.0465 0.0318 1.46 0.0725 0.2048
STAT5b (Y699) 0.0380 0.0286 1.33 0.0921 0.2457
LYN (Y397) 0.0351 0.0283 1.24 0.1079 0.2725
STAT6 (Y641) 0.0309 0.0284 1.09 0.1382 0.3317
STAT5A (Y699) 0.0656 0.0715 0.92 0.1791 0.4093
FYN (Y420) 0.0587 0.0768 0.76 0.2239 0.4884
STAT5A/B (Y699) 0.0168 0.0366 0.46 0.3229 0.6739
ERK1/2 (T202/Y204. T185/Y187) 0.0284 0.0708 0.40 0.3447 0.6894
* The probes written in bold have a log2-intensity ratio significantly larger than zero at the a-level of 5%.
Dewaele et al. Clinical Sarcoma Research 2011, 1:4
/>Page 10 of 16
Noteworthy, copy n umber gains of HER2 were exclu-
sively found in recurrent or metastatic cases in our
cohort, further suggesting its possible association with
poor clinical outcome.
Losses of large chromosomal regions are typically
found in chordoma. In this study, losses revealed by
aCGH predominantly involved chromosome 3; the smal-
lest overlapping region of deletion, 3p24.1-p14.2, was
lost in eight out of ten analyzed cases. This regio n con-
tains multiple genes, including RBM5, FHIT and
PTPRG, but their involvement in chordoma pathogen-
esis has yet to be determined. Loss of the 9pter-p21
region, another frequent featu re revea led by aCGH ana-
lysis, was found in seven out of ten tumors. Importantly,
in three cases the region was homozygous lost. The
losses encompassed the tumor suppressor genes
CDKN2A and CDKN2B, which are frequently deleted in
many tumo r types [30,31]. Correspondingly, Hallor and
co-workers observed loss of the CDKN2A locus with an
incidence of 70 % in chordoma, and with an even higher
frequency considering just metastasizing lesions [7].
Accordi ngly, loss of expression of the CDKN2A protein
in chordoma was also previously shown by immunos-
taining [32]. Other recurrent losses, observed in the pre-
sent study by aCGH, involved regions carrying the
tumor suppressors PTEN/10q23.31, CHEK2/22q12.1 and
the t ranscription factor RUNX3/1p36.11, all previously
described in chordomas [7].
In order to characterize the compendium of co-acti-
vated RTK in chordoma, we used an antibody array that
allows the simultaneous characterization of the phos-
phorylation status of 42 di fferent RTK. Most impor-
tan tly, the EGFR kinase was consistent ly activated in all
12 investigated cases. Furthe rmore, statistical analysis
showed that EGFR activation was significant for chordo-
mas, based on the analysis of our coho rt. The activation
of EGFR in chordoma was previously shown by other
groups, although the reported frequencies of the EGFR
activation in chor doma vary significan tly [8,16]. By RTK
antibody array Tamborini and co-workers reported
EGFR, HER2 and HER4 activation in 6/7 (86%), 5/7
(71%) and 3/7 (43%) of cases, respectively [8]. Howev er,
Case 18
Case 17a
Case 20
Case 21
1
2
1
3
6
4
5
1
6
1
6
13
9 10
12
11
12
11
9 10
9
12
14
9
10
12
16
11
10
11
17
15
7
8
Figure 4 Representative images from phospho-RTK (left panel) and phospho-kinase (right panel) arrays from chordoma cases 18, 17b,
20 and 21. The EGFR and EPHB2 TK are frequently activated and downstream RTK signaling intermediates are activated consistently in
chordomas. Each kinase is spotted in duplicate. The pairs of dots in each corner are positive controls. Each pair of the most positive kinase dots
is denoted by a numeral, with the identity of the corresponding kinases listed as follows: 1) EGFR, 2) CSF1R, 3) MSPR, 4) PDGFRB, 5) FGFR3, 6)
EPHB2, 7) HER2, 8) TOR, 9) AKT, 10) TP53, 11) RSK1/2/3, 12) S6K, 13) CREB, 14) YES, 15) MSK1/2, 16) RSK1/2, 17) eNOS.
Dewaele et al. Clinical Sarcoma Research 2011, 1:4
/>Page 11 of 16
using immunoprecipitation assay, EGFR and HER2 were
phosphorylated in respectively 17/22 (77% ) and 6 /14
(43%) of their cases [8]. Using the same RTK antibody
array, Shalaby and colleagues recently showed activation
of HER2, MSPR, EPHB2 and MER for the U-CH1 chor-
doma cell line and the three tested chordoma cases [16].
In our study, we found significant activation of EGFR,
HER2 and HER4 in respectively 12, one a nd one out of
12 cases, using the same antibody arrays. Interestingly,
the frequent activation of PDGFRB in chordomas [21/22
(95%) of cases] was described in the study by Tamborini
and collabor ators [8]. In contrast, we found activation of
PDGFRB only in five out of 12 (42%) chord omas, using
thesameantibodyRTKarraysandusingthevalueof
the mean plus the standard deviation with in an array as
the c ut-off. However as indicated by statistical analysis,
PDGFRB activation was not significant in o ur cohort.
This discrepancy might be attributable to the heteroge-
neity of chordoma tumors, the quality of the frozen
tumor tissue used for the analysis, modifications of the
technique and/or to subsequent dissimilar analysis of
the data. Thus, Tamborini and co-workers used high-
concentrated (e.g. 2 mg/array) protein lysate per array in
their study [8]. In contrast, we performed the experi-
ments according to the manufacturers’ recommenda-
tions which indicate 500 μg of total protein as the
maximum amount to be used for each array. In addi-
tion, we have performed an extensive statistical analysis
ofthedatabyusingalinearmixedmodel.Our
statisti cal analysis included a multiple testing correction.
The linear mixed model avoids the use of an arbitrarily
chosen cut-off that can lead to overestimation of the
activation of RTK and to uncertainty about the results.
Notably, statistical analysis was never described by
others in reports published so far in reference to RTK
proteome profiling kits, thus the statistical significance
of reported data is unknown. Importantly, we also found
two other RTK: EPHB2 and MSPR, to be significantly
activated in chordoma. The activation of EPHB2 was
recently described in one chordoma study [16]. The role
of EPHB2 in chordoma development and progression
needs to be further evaluated. In general, EPHB2 func-
tion depends on the tumor type and signaling context of
the neoplastic cell. The EPH B2 has a tumor suppressive
role in colon carcinoma; in contrast, EPHB2 promotes
cell proliferation in adenomas and normal intestinal
epithelium. Notably, it was recently shown in mice mod-
els that the intrinsic kinase activity of EPHB2 conveys
mitogenic signals [33]. It is of interest that imatinib
mesyl ate is as an inhibitor of EPHB mitogenic signaling.
TheMSPR/RONtyrosinekinaseisamemberofthe
MET family of RTK. MET expression was shown pre-
viously in chordomas by several other groups, but
MSPR expression and activation was only recently
reported in all three investigated chordomas by Shalaby
andco-workers[16].Asitisthecasewithitsbetter-
known family member, MET, several lines of evidence
suggest a role for RON in human cancer. Generally,
RON overexpression is associated with poor clinical out-
come and metastasis [34]. Foretinib, an oral multi-kinase
inhibitor of MET, RON, AXL and VEGFR, is currently
in phase I and II clinical testing [35].
The multiple RTK co-activation is n ot a distinctiv e
feature of chordomas, because similar patte rns were
reported in other tumor types, such as colon adenocar-
cinomas, intimal sarcomas, glioblastomas or osteosarco-
mas [36-38]. Importantly, the simultaneous activation of
multiple RTK provides the tumor cells with reduced
dependence on a single RTK for the maintena nce of cri-
tical downstream signaling, and thus renders such
tumors refractory to single-agent RTK inhibition.
The conflicting results on the frequency of EGFR,
HER2, PDGFRB expression and activation, and also
copy number alterations in chordoma, might be due to
differences in sensitivity of the te chniques used. In addi-
tion, even if usi ng the same technique, there are impor-
tant variations in methodology between different
laboratories, with man y confounding fa ctors contribut-
ing to the inconsistencies, e.g. the different type and
source of the antibodies used in the immunohi stochem-
ical studies. When immunostaining is considered, it is
well known that the way of tissue fixation influences
outcome [39]. Tumor specimens are frequently retrieved
Chordoma cases
15b 4b 9 2b 10b 5 7b
12b 14
p-PDGFRB (Y751)
p-EGFR (Y1068)
PDGFRB
EGFR
p_KIT (Y703)
KIT
190 kDa
190 kDa
175 kDa
175 kDa
145 kDa
125 kDa
145 kDa
125 kDa
42 kDa
Actin
Figure 5 Western immunoblot of nine chordoma cases.The
immunoblot confirms the frequent expression of EGFR and PDGFRB,
and frequent activation of EGFR, but not of PDGFRB and KIT
proteins. Equal amounts of total protein extracts from nine tumors
were separated on a gel, immunoblotted and then probed with the
indicated antibodies.
Dewaele et al. Clinical Sarcoma Research 2011, 1:4
/>Page 12 of 16
from archives, and in case they are not preserved well,
thismaygiverisetofalsenegativecases.Thelackof
sensitivity of IHC to identify low expression levels of
EGFR was comprehensively illustrated in colorect al can-
cer [40]. Similarly, chordoma immunostaining might
also show inconsistencies associated with these metho-
dological problems. Along this line, Weinberger and co-
workers found EGFR and HER2 expression in respec-
tively 12 (100%) and seven (58%) out of 12 chordomas,
using IHC on tissue micro-arrays (TMA), while Shalaby
and colleagues showed EGFR expression and activation
in respectively 69% (79/114) and 50% (56/115) of chor-
dom a cases by the same technique, and while Fasig and
co-authors reported EGFR activation in nine out of 21
(43%) cases [12,15,16]. By conventional immunostaining,
we have also found that EGFR and HER2 are expressed
in chordomas, albeit in a lower fraction of cases 26/39
(67%) and 5/16 (31%), respectively. In contrast to Wein-
berger and co-workers, however, we found more fre-
quent EGFR expres sion in advanced (15/20, 75%) rather
than in primary (11/19, 58%) lesions. Again in contrast
to Weinberger and co-workers, we did find a positive
correlation between HER2 expression and EGFR expres-
sion, which is in line with the HER2/EGFR heterodimers
formation in chordomas reported by other groups [8,12].
Moreover, we did not find a significant co rrelation
between EGFR and HER2 gene status an d their expres-
sion by immunostaining, this phenomenon was also
described in colorectal cancer [40,41].
The circuitry of intracellular signalling downstream of
RTK is an area of dynamic investigatio ns in many can-
cer types and advances in the characterization of this
signalling allows better selection of appropriate thera-
peutic agents. In the present study, we analyzed the acti-
vation of important effectors of signalling downstream
of RTK. Using kinase antibody arrays, AKT was the
most frequent (found in nine out of ten cases analyzed)
and highest phosphorylated in chordomas. Similarly,
Presneau and co-workers found AKT activation in 45
out of 49 (92%) chordomas analysed by TMA, and Tam-
borini and colleagues in 21 out of 22 chordomas (95%)
using Western blotting [8,42]. The AKT protein trans-
duces signals to several effector molecules, including
TSC1/2. More specifically, AKT inhibits TSC1/2 and
hereby relieves inhibition of mammalian target of rapa-
mycin (mTOR), which functions downstream of TSC1/
2. This occurs in part by phosphorylating two substrates,
p70S6 kin ase (S6K) and eukaryotic initiation factor 4E-
binding protein 1 (4E-BP1). Of note, p70S6K was acti-
vated in five and mTOR in three of our ten chordoma
cases analyzed by kinase antibody arrays. These data are
in accordance with previously published data [8,15,43].
The phenomenon that p70S6K was activated in p-
mTOR negative chordomas was found in multiple
studies [8,42]. The discrepancy in the prevalence of the
activated proteins between the reported results is most
likely due to differences in the relative sensitivity and
specificity of the methods. This is well illustrated in a
study b y Dobashi and co-workers, w ho found acti vated
mTOR in all five cases using immunohistochemistry,
but only in one case using Western immunoblotting
[44]. Nevertheless, the involvement of the AKT/mTOR
pathway in chordoma is clear. Importantly, efficient
inhibition of the human chordoma cell line UCH-1 by
PI-103, a dual PI3K and mTOR inhibitor, was recently
reported [43]. Notably, it was recently shown that AKT
activati on persists in the UCH- 1 chord oma cell l ine fol-
lowing treatment with the EGFR inhibitor tyrphostin
[16].
Further more, by kinase antibody arrays, we also found
effectors of RAS/ERK1/2 signaling to be significantly
activated in chordoma, like ribosomal S6 kinases (RSK)
1/2/3, the CREB transcription factor and the chromatin
associated kinase p38. More downstream are the mito-
gen- and stress-activated protein kinases, MSK1 and the
closely related isoform MSK2. These are nuclear kinases
that are activated by the ERK1/2 and p38 MAPK signal-
ing cascades [45]. Additionally, the SRC family mem-
bers, SRC an d YES, were also activated. These pathways
were not extensively analyzed in chordoma by other
groups, except for ERK1/2, which was described to be
consistently strongly phosphorylated in chordoma by
Tamborini and co-workers [8]. Nevertheless, these acti-
vated proteins a re all confou nding factors that might
offer the tumors redundancy, making them less respo n-
sive to upstream RTK and AKT pathway inhibition.
Oncogenes often cooperate with additional mutations
that disrupt tumor suppressor pathways. Phosphatase
and tensin h omologue deleted on chromosome ten
(PTEN), is an importan t negative regulator of the AKT/
mTOR pathway, which when not expressed contributes
to constitutive phosphorylation of AKT and activation
of downstream effectors. PTEN loss is also frequently
found in chordomas. We observed loss of PTEN in five
out of ten cases by aCGH, and in seven out of 18 (39%)
cases by FISH. Presneau and co-workers recently
revealed loss of PTEN protein expression in seven out
of 43 (16%) cases by IHC and semi-quantitative RT-PCR
[42]. Han and co-workers showed negative PTEN stain-
ing by IHC in six out of ten sporadic chordoma [46].
Just like in our cases, they did not find any correlation
between loss of PTEN and advanced disease. TSC1 is
another critical tumor suppressor, implicated down-
stream in the PI3K/AKT and RAS/ERK pathways. In
particular, upon growth factor activation, AKT, ERK and
p90 ribosomal S6 kina se 1 (RSK1) partic ipate in TSC
protein complex inhibition, hereby critically regulating
cell growth and proliferation. Chordomas are reported
Dewaele et al. Clinical Sarcoma Research 2011, 1:4
/>Page 13 of 16
in patients with tuberous sclerosis complex (TSC), an
autosomal dominant disorder typified by hamartomas in
several organs, epilepsy, mental retardation and beha-
vioural problems. TSC is caused by germline mutations
in the TSC1 or TSC2 genes and the loss of the corre-
sponding wild type allele. The chromosomal region
9q34.13, where the TSC1 gene is localized, is also fre-
quently lost in sporadic chordomas [7]. By aCGH, we
found loss of the region 9q34.11-qter, encompassing the
gene coding for TSC1, in five out of ten cases. Hallor
and co-workers showed loss of this region in about 25%
of 21 cases analyzed by aCGH. In contrast, Presneau
and co-workers found disomy for TSC1/2 by FISH in all
of their 28 cases [42]. Generally, the consistent activa-
tion of AKT, the frequent activation of p70S6K and of
mTOR, together with frequent loss of the TSC1 and
PTEN genes, all suggest an important role for the PI3K/
AKT pathway in chordoma.
Conclusions
In summary, we found that EGFR is the strongest and
most frequently activated RTK in chordo mas, and there-
fore becomes a possible target for therapy. Lack of signifi-
cant EGFR amplification and EGFR mutations suggest s
activation by autocrine/paracrine ligand stimulation.
PDGFRB is also activated in chordomas, but with a lower
frequency and/or to a lower level, which might not be
detectable by some current standard techniques. In the
light of these findings, chordoma patients may benefit
from treatment with multi-kinase inhibitors targeting both
EGFR and PDGFR. Furthermore, many other RTK are
activated in subsets of chordomas; these are likely to
increase treatment resistance in these tumors. These
results are currently only hypothesis-generating, and addi-
tional in vitro studies addressing the impact of inhibitors
of RTK and their downstream effectors on chordoma
tumor cells would be extremely useful in determining the
dominant and alternative RTKs in these tumors. As chor-
domas are bone tumors, with a rigid, mineralized extracel-
lular matrix, ex-vivo studies on primary neoplastic
chordoma cells will be difficult. Recent advances in com-
putational biology and network-based technologies gener-
ating predictive models might be more of use [47].
In conclusion, the consistent activation of AKT, the
recurrent activation of upstream EGFR and of down-
stream effectors like p 70S6K and mTOR, together with
frequent loss of TSC1 and PTEN gene loci, all indicate
that the PI3K/AKT pathway is an important mediator of
transformation in chordoma. Targeting this pathway is
likely to yield attractive dat a that will enlighten the
design of appropriate therapies. Individualized therapeu-
tic approaches depending on the genetic context of a
particular tumor are likely to be the most successful.
List of abbreviations
4EBP1: eukaryotic translation initiation factor E4-binding protein 1; BAC:
bacterial artificial chromosome; CNA: copy number alter ations; CSF1R:
colony-stimulating factor 1 receptor; DAPI: 4.6-diamidi no-2-phenylindole;
EGFR: epidermal growth factor receptor; ERK1/2: extracellular signal-regulated
kinase; fdr: false discovery rate; HER2: v-ERBB2 Avian erythroblastic leukemia
viral oncogene homolog 2; IHC: immunohistochemistry; IS: intimal sarcoma;
MEK: mitogen-activated kinase kinase kinase 1; mTOR: mammalian target of
rapamycin; NCBI: National Center for Biotechnology Information; PCR:
polymerase chain reaction; PDGFR: platelet derived growth factor receptor;
PI3K: phosphatidyl inositol 3 kinase; PKB or AKT: protein kinase B; RTK:
receptor tyrosine kinase; S6K: ribosomal protein S6 kinase; SG: spectrum
green; SO: spectrum orange; TK: tyrosine kinase; TKI: tyrosine kinase
inhibitors; TMA: tissue microarrays.
Acknowledgements
This work is supported by research grants from the EUROBONET consortium
(a network of excellence granted by the European Commission for studying
the pathology and genetics of bone tumors), from the Fonds voor
Wetenschappelijk Onderzoek Vlaanderen (G.0589.09, MD-R), and by a
Concerted Action Grant 2006/14 from the K.U.Leuven.
Author details
1
Department of Human Genetics, Catholic University of Leuven, University
Hospitals, Leuven, Belgium.
2
Department of Pathology, Catholic University of
Leuven, University Hospitals, Leuven, Belgium.
3
Laboratory of Experimental
Oncology, Department of General Medical Oncology, Catholic University of
Leuven, University Hospitals, Leuven, Belgium.
4
I-BioStat, Catholic University
of Leuven, Leuven, Belgium, and Hasselt University, Hasselt, Belg ium.
Authors’ contributions
BD carried out the mutation analysis, participated in the aCGH data
evaluation, Western immunoblotting analysis and antibody array analysis,
and drafted the manuscript. FM carried out the histopathological
experiments and analysis and participated in the draft of the manuscript. GF
participated in the antibody array experiments and analysis and
histopathological analysis. MA performed the statistical analysis of the
antibody arrays. VV carried out the FISH, aCGH, Western immunoblotting
and antibody array experiments. AW performed the aCGH analysis and
participated in the antibody array analysis. MDR participated in the design
and coordination of the study and helped to draft the manuscript. RS
contributed tumor samples for this study, participated in the design of the
study and critically revised the manuscript. All authors read and approved
the final manuscript.
Competing interests
The authors declare that they have no competing interests.
Received: 25 January 2011 Accepted: 25 July 2011
Published: 25 July 2011
References
1. Stacchiotti S, Casali PG, Lo VS, Mariani L, Palassini E, Mercuri M,
Alberghini M, Pilotti S, Zanella L, Gronchi A, Picci P: Chordoma of the
mobile spine and sacrum: a retrospective analysis of a series of patients
surgically treated at two referral centers. Ann Surg Oncol 2010,
17:211-219.
2. Ferraresi V, Nuzzo C, Zoccali C, Marandino F, Vidiri A, Salducca N, Zeuli M,
Giannarelli D, Cognetti F, Biagini R: Chordoma: clinical characteristics,
management and prognosis of a case series of 25 patients. BMC Cancer
2010, 10:22.
3. Mirra JM, Nelson SD, Della Rocca C, Mertens F: Chordoma. In World Health
Organization Classification of Tumours. Pathology and Genetics of Tumours of
Soft Tissue and Bone. Volume 5 1 edition. Edited by: Fletcher CD, Unni KK,
Mertens F. Lyon: IARC Press; 2002:315-317.
4. Scheil S, Bruderlein S, Liehr T, Starke H, Herms J, Schulte M, Möller P:
Genome-wide analysis of sixteen chordomas by comparative genomic
hybridization and cytogenetics of the first human chordoma cell line, U-
CH1. Genes Chromosomes Cancer 2001, 32:203-211.
5. Tallini G, Dorfman H, Brys P, Dal Cin P, De Wever I, Fletcher CD, Jonson K,
Mandahl N, Mertens F, Mitelman F, Rosai J, Rydholm A, Samson I, Sciot R,
Dewaele et al. Clinical Sarcoma Research 2011, 1:4
/>Page 14 of 16
Van den Berghe H, Vanni R, Willén H: Correlation between
clinicopathological features and karyotype in 100 cartilaginous and
chordoid tumours. A report from the Chromosomes and Morphology
(CHAMP) Collaborative Study Group. J Pathol 2002, 196:194-203.
6. Miozzo M, Dalpra L, Riva P, Volontà M, Macciardi F, Pericotti S, Tibiletti MG,
Cerati M, Rohde K, Larizza L, Fuhrman Conti AM: A tumor suppressor locus
in familial and sporadic chordoma maps to 1p36. Int J Cancer 2000,
87:68-72.
7. Hallor KH, Staaf J, Jönsson G, Heidenblad M, Vult von Steyern F, Bauer HC,
Ijszenga M, Hogendoorn PC, Mandahl N, Szuhai K, Mertens F: Frequent
deletion of the CDKN2A locus in chordoma: analysis of chromosomal
imbalances using array comparative genomic hybridisation. Br J Cancer
2008, 98:434-442.
8. Tamborini E, Virdis E, Negri T, Orsenigo M, Brich S, Conca E, Gronchi A,
Stacchiotti S, Manenti G, Casali PG, Pierotti MA, Pilotti S: Analysis of
receptor tyrosine kinases (RTKs) and downstream pathways in
chordoma. Neuro Oncol 2010, 12:776-89.
9. Hof H, Welzel T, Debus J: Effectiveness of cetuximab/gefitinib in the
therapy of a sacral chordoma. Onkologie 2006, 29:572-574.
10. Naka T, Iwamoto Y, Shinohara N, Ushijima M, Chuman H, Tsuneyoshi M:
Expression of c-met proto-oncogene product (c-MET) in benign and
malignant bone tumors. Mod Pathol 1997, 10:832-838.
11. Tamborini E, Miselli F, Negri T, Lagonigro MS, Staurengo S, Dagrada GP,
Stacchiotti S, Pastore E, Gronchi A, Perrone F, Carbone A, Pierotti MA,
Casali PG, Pilotti S: Molecular and biochemical analyses of platelet-
derived growth factor receptor (PDGFR) B, PDGFRA, and KIT receptors in
chordomas. Clin Cancer Res 2006, 12:6920-6928.
12. Weinberger PM, Yu Z, Kowalski D Joe J, Manger P, Psyrri A, Sasaki CT:
Differential expression of epidermal growth factor receptor, c-Met, and
HER2/neu in chordoma compared with 17 other malignancies. Arch
Otolaryngol Head Neck Surg 2005, 131:707-711.
13. Casali PG, Messina A, Stacchiotti S, Tamborini E, Crippa F, Gronchi A,
Orlandi R, Ripamonti C, Spreafico C, Bertieri R, Bertulli R, Colecchia M,
Fumagalli E, Greco A, Grosso F, Olmi P, Pierotti MA, Pilotti S: Imatinib
mesylate in chordoma. Cancer 2004, 101:2086-2097.
14. Deniz ML, Kilic T, Almaata I, Kurtkaya O, Sav A, Pamir MN: Expression of
growth factors and structural proteins in chordomas: basic fibroblast
growth factor, transforming growth factor alpha, and fibronectin are
correlated with recurrence. Neurosurgery 2002, 51:753-760.
15. Fasig JH, Dupont WD, LaFleur BJ, Olson SJ, Cates JM:
Immunohistochemical analysis of receptor tyrosine kinase signal
transduction activity in chordoma. Neuropathol Appl Neurobiol 2008,
34:95-104.
16. Shalaby A, Presneau N, Ye H, Halai D, Berisha F, Idowu B, Leithner A, Liegl B,
Briggs TRW, Bacsi K, Kindblom LG, Athanasou N, Amary MF,
Hogendoorn PCW, Tirabosco R, Flanagan AM: The role of epidermal
growth factor receptor in chordoma pathogenesis: a potential
therapeutic target. J Pathol 2011, 223:336-346.
17. Brand-Saberi B, Christ B: Evolution and development of distinct cell
lineages derived from somites. Curr Top Dev Biol 2000, 48:1-42.
18. Ostroumov E, Hunter CJ: Identifying mechanisms for therapeutic
intervention in chordoma: c-Met oncoprotein. Spine (Phila Pa 1976) 2008,
33:2774-2780.
19. Wozniak A, Sciot R, Guillou L, Pauwels P, Wasag B, Stul M, Vermeesch JR,
Vandenberghe P, Limon J, Debiec-Rychter M: Array CGH analysis in
primary gastrointestinal stromal tumors: cytogenetic profile correlates
with anatomic site and tumor aggressiveness, irrespective of mutational
status. Genes Chromosomes Cancer 2007, 46:261-276.
20. Lahortiga I, De Keersmaecker K, Van Vlierberghe P, Graux C, Cauwelier B,
Lambert F, Mentens N, Beverloo HB, Pieters R, Speleman F, Odero MD,
Bauters M, Froyen G, Marynen P, Vandenberghe P, Wlodarska I, Meijerink JP,
Cools J: Duplication of the MYB oncogene in T cell acute lymphoblastic
leukemia. Nat Genet 2007, 39:593-595.
21. VU Micro-Array Data Analysis. [ />22. Debiec-Rychter M, Wasag B, Stul M, De Wever I, Van Oosterom A,
Hagemeijer A, Sciot R: Gastrointestinal stromal tumours (GISTs) negative
for KIT (CD117 antigen) immunoreactivity. J Pathol 2004, 202:430-438.
23. Primer3: WWW primer tool. [ />primer3_www_slow.cgi].
24. Chu T, Weir B, Wolfinger R: A systematic statistical linear modeling
approach to oligonucleotide array experiments. Mathematical Biosciences
2002, 176:35-51.
25. Wolfinger R, Gibson G, Wolfinger E, Bennett L, Hamadeh H, Bushel P,
Afshari C, Paules R: Assessing Gene Significance from cDNA Microarray
Expression Data via Mixed Models. Journal of Computational Biology 2002,
8:625-637.
26. Benjamini Y, Hochberg Y: Controlling the False Discovery Rate: a Practical
and Powerful Approach to Multiple Testing. Journal of the RSS: Series B
(Statistical Methodology) 2010, 57:289-300.
27. Brandal P, Bjerkehagen B, Danielsen H, Heim S: Chromosome 7
abnormalities are common in chordomas. Cancer Genet Cytogenet 2005,
160:15-21.
28. Kuzniacka A, Mertens F, Strombeck B, Wiegant J, Mandahl N: Combined
binary ratio labeling fluorescence in situ hybridization analysis of
chordoma. Cancer Genet Cytogenet 2004, 151:178-181.
29. Sawyer JR, Husain M, Al-Mefty O: Identification of isochromosome 1q as a
recurring chromosome aberration in skull base chordomas: a new
marker for aggressive tumors? Neurosurg Focus 2001, 10:E6.
30. Li J, Rix U, Fang B, Bai Y, Edwards A, Colinge J, Bennett KL, Gao J, Song L,
Eschrich S, Superti-Furga G, Koomen J, Haura EB: A chemical and
phosphoproteomic characterization of dasatinib action in lung cancer.
Nat Chem Biol 2010, 6:291-299.
31. Olson LE, Soriano P: Increased PDGFRalpha activation disrupts connective
tissue development and drives systemic fibrosis. Dev Cell 2009,
16:303-313.
32. Naka T, Boltze C, Kuester D, Schulz TO, Schneider-Stock R, Kellner A,
Samii A, Herold C, Ostertag H, Roessner A: Alterations of G1-S checkpoint
in chordoma: the prognostic impact of p53 overexpression.
Cancer 2005,
104:1255-1263.
33. Genander M, Halford MM, Xu NJ, Eriksson M, Yu Z, Qiu Z, Martling A,
Greicius G, Thakar S, Catchpole T, Chumley MJ, Zdunek S, Wang C, Holm T,
Goff SP, Pettersson S, Pestell RG, Henkemeyer M, Frisén J: Dissociation of
EphB2 signaling pathways mediating progenitor cell proliferation and
tumor suppression. Cell 2009, 139:679-692.
34. Wagh PK, Peace BE, Waltz SE: Met-related receptor tyrosine kinase Ron in
tumor growth and metastasis. Adv Cancer Res 2008, 100:1-33.
35. Eder JP, Shapiro GI, Appleman L, Zhu AX, Miles D, Keer H, Cancilla B, Chu F,
Hitchcock-Bryan S, Sherman L, McCallum S, Heath EI, Boerner SA,
LoRusso PM: A phase I study of foretinib, a multi-targeted inhibitor of c-
Met and vascular endothelial growth factor receptor 2. Clin Cancer Res
2010, 16:3507-3516.
36. Stommel JM, Kimmelman AC, Ying H, Nabioullin R, Ponugoti AH,
Wiedemeyer R, Stegh AH, Bradner JE, Ligon KL, Brennan C, Chin L,
DePinho RA: Coactivation of receptor tyrosine kinases affects the
response of tumor cells to targeted therapies. Science 2007, 318:287-290.
37. Zhou Y, Li S, Hu YP, Wang J, Hauser J, Conway AN, Vinci MA, Humphrey L,
Zborowska E, Willson JK, Brattain MG: Blockade of EGFR and ErbB2 by the
novel dual EGFR and ErbB2 tyrosine kinase inhibitor GW572016
sensitizes human colon carcinoma GEO cells to apoptosis. Cancer Res
2006, 66:404-411.
38. Dewaele BM, Floris G, Finalet-Ferreiro J, Fletcher CD, Coindre JM, Guillou L,
Hogendoorn PC, Wozniak A, Vanspauwen V, Schöffski P, Marynen P,
Vandenberghe P, Sciot R, Debiec-Rychter M: Co-activated PDGFRA and
EGFR are potential therapeutic targets in intimal sarcoma. Cancer Res
2010, 70:7304-14.
39. Atkins D, Reiffen KA, Tegtmeier CL, Winther H, Bonato MS, Storkel S:
Immunohistochemical detection of EGFR in paraffin-embedded tumor
tissues: variation in staining intensity due to choice of fixative and
storage time of tissue sections. J Histochem Cytochem 2004, 52:893-901.
40. Chung KY, Shia J, Kemeny NE, Shah M, Schwartz GK, Tse A, Hamilton A,
Pan D, Schrag D, Schwartz L, Klimstra DS, Fridman D, Kelsen DP, Saltz LB:
Cetuximab shows activity in colorectal cancer patients with tumors that
do not express the epidermal growth factor receptor by
immunohistochemistry. J Clin Oncol 2005, 23:1803-1810.
41. Moroni M, Veronese S, Benvenuti S, Marrapese G, Sartore-Bianchi A, Di
Nicolantonio F, Gambacorta M, Siena S, Bardelli A: Gene copy number for
epidermal growth factor receptor (EGFR) and clinical response to
antiEGFR treatment in colorectal cancer: a cohort study. Lancet Oncol
2005, 6:279-286.
Dewaele et al. Clinical Sarcoma Research 2011, 1:4
/>Page 15 of 16
42. Presneau N, Shalaby A, Idowu B, Gikas P, Cannon SR, Gout I, Diss T,
Tirabosco R, Flanagan AM: Potential therapeutic targets for chordoma:
PI3K/AKT/TSC1/TSC2/mTOR pathway. Br J Cancer 2009, 100:1406-1414.
43. Schwab J, Antonescu C, Boland P, Healey J, Rosenberg A, Nielsen P,
Iafrate J, Delaney T, Yoon S, Choy E, Harmon D, Raskin K, Yang C, Mankin H,
Springfield D, Hornicek F, Duan Z: Combination of PI3K/mTOR inhibition
demonstrates efficacy in human chordoma. Anticancer Res 2009,
29:1867-1871.
44. Dobashi Y, Suzuki S, Sato E, Hamada Y, Yanagawa T, Ooi A: EGFR-
dependent and independent activation of Akt/mTOR cascade in bone
and soft tissue tumors. Mod Pathol 2009, 22:1328-1340.
45. Chiacchiera F, Simone C: Signal-dependent regulation of gene expression
as a target for cancer treatment: inhibiting p38alpha in colorectal
tumors. Cancer Lett 2008, 265:16-26.
46. Han S, Polizzano C, Nielsen GP, Hornicek FJ, Rosenberg AE, Ramesh V:
Aberrant hyperactivation of akt and Mammalian target of rapamycin
complex 1 signaling in sporadic chordomas. Clin Cancer Res 2009,
15:1940-1946.
47. Xu AM, Huang PH: Receptor tyrosine kinase coactivation networks in
cancer. Cancer Res 2010, 70:3857-3860.
doi:10.1186/2045-3329-1-4
Cite this article as: Dewaele et al.: Frequent activation of EGFR in
advanced chordomas. Clinical Sarcoma Research 2011 1:4.
Submit your next manuscript to BioMed Central
and take full advantage of:
• Convenient online submission
• Thorough peer review
• No space constraints or color figure charges
• Immediate publication on acceptance
• Inclusion in PubMed, CAS, Scopus and Google Scholar
• Research which is freely available for redistribution
Submit your manuscript at
www.biomedcentral.com/submit
Dewaele et al. Clinical Sarcoma Research 2011, 1:4
/>Page 16 of 16