Báo cáo y học: "A tumor cord model for Doxorubicin delivery and dose optimization in solid tumors Steffen Eikenberry" ppsx
Bạn đang xem bản rút gọn của tài liệu. Xem và tải ngay bản đầy đủ của tài liệu tại đây (705.42 KB, 20 trang )
BioMed Central
Page 1 of 20
(page number not for citation purposes)
Theoretical Biology and Medical
Modelling
Open Access
Research
A tumor cord model for Doxorubicin delivery and dose
optimization in solid tumors
Steffen Eikenberry
Address: Department of Mathematics and Statistics, Arizona State University, Tempe, AZ 85287, USA
Email: Steffen Eikenberry -
Abstract
Background: Doxorubicin is a common anticancer agent used in the treatment of a number of
neoplasms, with the lifetime dose limited due to the potential for cardiotoxocity. This has
motivated efforts to develop optimal dosage regimes that maximize anti-tumor activity while
minimizing cardiac toxicity, which is correlated with peak plasma concentration. Doxorubicin is
characterized by poor penetration from tumoral vessels into the tumor mass, due to the highly
irregular tumor vasculature. I model the delivery of a soluble drug from the vasculature to a solid
tumor using a tumor cord model and examine the penetration of doxorubicin under different
dosage regimes and tumor microenvironments.
Methods: A coupled ODE-PDE model is employed where drug is transported from the
vasculature into a tumor cord domain according to the principle of solute transport. Within the
tumor cord, extracellular drug diffuses and saturable pharmacokinetics govern uptake and efflux by
cancer cells. Cancer cell death is also determined as a function of peak intracellular drug
concentration.
Results: The model predicts that transport to the tumor cord from the vasculature is dominated
by diffusive transport of free drug during the initial plasma drug distribution phase. I characterize
the effect of all parameters describing the tumor microenvironment on drug delivery, and large
intercapillary distance is predicted to be a major barrier to drug delivery. Comparing continuous
drug infusion with bolus injection shows that the optimum infusion time depends upon the drug
dose, with bolus injection best for low-dose therapy but short infusions better for high doses.
Simulations of multiple treatments suggest that additional treatments have similar efficacy in terms
of cell mortality, but drug penetration is limited. Moreover, fractionating a single large dose into
several smaller doses slightly improves anti-tumor efficacy.
Conclusion: Drug infusion time has a significant effect on the spatial profile of cell mortality within
tumor cord systems. Therefore, extending infusion times (up to 2 hours) and fractionating large
doses are two strategies that may preserve or increase anti-tumor activity and reduce
cardiotoxicity by decreasing peak plasma concentration. However, even under optimal conditions,
doxorubicin may have limited delivery into advanced solid tumors.
Published: 9 August 2009
Theoretical Biology and Medical Modelling 2009, 6:16 doi:10.1186/1742-4682-6-16
Received: 22 January 2009
Accepted: 9 August 2009
This article is available from: />© 2009 Eikenberry; licensee BioMed Central Ltd.
This is an Open Access article distributed under the terms of the Creative Commons Attribution License ( />),
which permits unrestricted use, distribution, and reproduction in any medium, provided the original work is properly cited.
Theoretical Biology and Medical Modelling 2009, 6:16 />Page 2 of 20
(page number not for citation purposes)
Background
Doxorubicin (adriamycin) is a first line anti-neoplastic
agent used against a number of solid tumors, leukemias,
and lymphomas [1]. There are many proposed mecha-
nisms by which doxorubicin (DOX) may induce cellular
death, including DNA synthesis inhibition, DNA alkyla-
tion, and free radical generation. It is known to bind to
nuclear DNA and inhibit topoisomerase II, and this may
be the principle mechanism [2]. Cancer cell mortality has
been correlated with both dose and exposure time, and El-
Kareh and Secomb have argued that it is most strongly
correlated with peak intracellular exposure [3,4]; rapid
equilibrium between the intracellular (cytoplasmic) and
nuclear drug has been suggested as a possible mechanism
for this observation [4].
The usefulness of doxorubicin is limited by the potential
for severe myocardial damage and poor distribution in
solid tumors [1,5]. Cardiotoxicity limits the lifetime dose
of doxorubicin to less than 550 mg/m
2
[1,6] and has moti-
vated efforts to determine optimal dosage regimes. Deter-
mining optimal dosage is complicated by the disparity in
time-scales involved: doxorubicin clearance from the
plasma, extravasation into the extracellular space, and cel-
lular uptake all act over different time-scales. A mathemat-
ical model by El-Kareh and Secomb [3] took this into
account and explicitly modeled plasma, extracellular, and
intracellular drug concentrations. They compared the effi-
cacy of bolus injection, continuous infusion, and lipo-
somal delivery to tumors. They took peak intracellular
concentration as the predictor of toxicity and found con-
tinuous infusion in the range of 1 to 3 hours to be opti-
mal. However, this work considered a well-perfused
tumor with homogenous delivery to all tumor cells. Opti-
mization of doxorubicin treatment is further complicated
by its poor distribution in solid tumors and limited
extravasation from tumoral vessels into the tumor extra-
cellular space [5,7]. Thus, the spatial profile of doxoru-
bicin penetrating into a vascular tumor should also be
considered.
Most solid tumors are characterized by an irregular, leaky
vasculature and high interstitial pressure. In most tumors
capillaries are much further apart than in normal tissue.
This geometry severely limits the delivery of nutrients as
well as cytotoxic drugs [5]. There has been significant
interest in modeling fluid flow and delivery of macromol-
ecules within solid tumors [8-11]. Some modeling work
has considered spatially explicit drug delivery to solid
tumors [12-14], El-Kareh and Secomb considered the dif-
fusion of cisplatin into the peritoneal cavity [15], and dox-
orubicin has attracted significant theoretical attention
from other authors [16-18].
I propose a model for drug delivery to a solid tumor, con-
sidering intracellular and extracellular compartments,
using a tumor cord as the base geometry. Tumor cords are
one of the fundamental microarchitectures of solid
tumors, consisting of a microvessel nourishing nearby
tumor cells [13]. This simple architecture has been used
by several authors to represent the in vivo tumor microen-
vironment [13,19], and a whole solid tumor can be con-
sidered an aggregation of a number of tumor cords.
Plasma DOX concentration is determined by a published
3-compartment pharmacokinetics model [20], and the
model considers drug transport from the plasma to the
extracellular tumor space. The drug flux across the capil-
lary wall takes both diffusive and convective transport
into account, according to the principle of solute trans-
port [21]. The drug diffuses within this space and is taken
up according to the pharmacokinetics described in [3].
Doxorubicin binds extensively to plasma proteins [22],
and therefore both the bound and unbound populations
of plasma and extracellular drug are considered sepa-
rately.
Using this model, I predict drug distribution within the
tumor cord and peak intracellular concentrations over the
course of treatment by bolus and continuous infusion.
Cancer cell death as a function of peak intracellular con-
centration over the course of treatment by continuous
infusion is explicitly determined according to the in vitro
results reported in [23]. The roles of all parameters
describing DOX pharmacokinetics and the tumor micro-
environment are characterized through sensitivity analy-
sis.
The model is applied to predicting the efficacy of different
infusion times and fractionation regimes, as well as low
versus high dose chemotherapy. Continuous infusion is
compared to bolus injection, and I find that the continu-
ous infusions on the order of 1 hour or less can slightly
increase maximum intracellular doxorubicin concentra-
tion near the capillary wall and have similar overall cancer
cell mortality. Optimal infusion times depend upon the
dose, with rapid bolus more efficacious for small doses
(25–50 mg/mm
2
) and short infusions better for higher
doses (75–100 mg/mm
2
). Fractionating single large bolus
injections into several smaller doses can also slightly
increase efficacy. Cardiotoxicity is correlated with peak
plasma AUC [24], and even relatively brief continuous
infusions or divided dosages greatly reduce peak plasma
concentration. Therefore, such infusion schedules likely
preserve or even enhance anti-tumor activity while reduc-
ing cardiotoxicity.
I examine the efficacy of high dose versus low dose chem-
otherapy, finding that cytotoxicity at the tumor vessel wall
levels off with increasing doses, but overall mortality
Theoretical Biology and Medical Modelling 2009, 6:16 />Page 3 of 20
(page number not for citation purposes)
increases nearly linearly. However, when the tumor inter-
capillary distance, and hence tumor cord radius, is large,
even extremely high doses fail to cause significant mortal-
ity beyond 100
μ
m from the vessel wall. Multiple treat-
ments are also simulated, and drug penetration is limited
even after several treatments. Therefore, the model pre-
dicts that DOX delivery to advanced tumors may be lim-
ited.
Techniques to evaluate the penetration of drugs in vivo are
technically challenging [5], but traditional in vitro experi-
ments fail to give a complete understanding of drug activ-
ity in vivo [5,7]. Adapting experimental results concerning
the effects of intracellular drug concentration (as in [23])
and the tumor microenvironment on cell death to a theo-
retical framework that models an in vivo tumor is a prom-
ising avenue of investigation into the optimization of
drug dosage regimes.
Methods
Tumor cord model
I assume a tumor cord geometry with both axial and radial
symmetry. Therefore, the three-dimensional problem can
be considered with only one variable for the radius – r.
The capillary wall extends to R
C
, and the tumor cord
extends to a radius of R
T
. I also assume that cancer cell
density is uniform throughout the tumor cord and that all
cells are viable. I do not consider the effects of hypoxia or
necrotic areas distant from the capillary. This is a reasona-
ble approximation, as in a study of doxorubicin concen-
tration in solid tumors by Primeau et al. [7], drug
concentration decreased exponentially with distance from
blood vessels. Drug concentration was reduced by half at
40–50
μ
m from vessels, but the distance to hypoxic
regions was reported as 90–140
μ
m. A negligible amount
of drug reached the hypoxic region, while many viable
cells were unaffected. Therefore, in this study, it is not nec-
essary to consider the effects of hypoxia, and I only con-
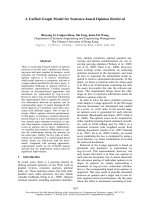
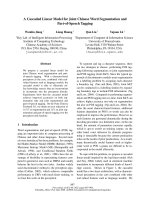
sider the viable part of the tumor cord. A schematic of the
circulation coupled to the tumor cord system as modeled
is shown in Figure 1.
The model considers plasma, free extracellular, albumin-
bound extracellular, and intracellular drug concentration
as four separate variables. Plasma drug concentration is
determined according to a 3-compartment pharmacoki-
netics model, based on the previously published model of
Robert et al. [20]. Transport of drug from plasma into the
tumor extracellular space occurs by passive diffusion and
convective transport across the capillary wall according to
the Staverman-Kedem-Katchalsky equation [21]. For
some general solute, S, the transcapillary flux is given as:
where S
V
is the solute concentration on the vascular side
of the capillary and S
E
is the concentration on the extracel-
lular side. The first term gives transport by diffusion, and
the second is transport by convection. P is the diffusional
permeability coefficient, A is the capillary surface area for
exchange,
σ
F
is the solvent-drag reflection coefficient, ΔS
lm
is the log-mean concentration difference, and J
F
is the
fluid flow as given by Starling's hypothesis:
Here, L
p
is the hydraulic conductivity, P
V
-P
E
is the hydro-
static pressure difference, Π
V-
Π
E
is the osmotic pressure
difference, and
σ
is the osmotic reflection coefficient. The
applications of these equations to this particular model
are given below.
Once extravasation into the extracellular space has
occurred, the drug diffuses by simple diffusion. Bound
and unbound drug are transported across the vessel wall
independently. Within the extracellular space, the two
populations diffuse at different rates, and drug rapidly
switches between the bound and unbound states.
JPASS J S
SVEFFlm
=−+−()()1
σ
Δ
(1)
ΔS
S
V
S
E
S
V
S
E
lm
=
−
ln( / )
(2)
JLAPP
Fp VE V E
=−−−[( ) ( )]
σ
ΠΠ
(3)
The modeled tumor systemFigure 1
The modeled tumor system. The systemic circulation is
connected to the primary tumor mass. The primary mass is
composed of a number of individual tumor cords. Doxoru-
bicin delivery is considered in one of these tumor cords.
Theoretical Biology and Medical Modelling 2009, 6:16 />Page 4 of 20
(page number not for citation purposes)
Changes in extra and intracellular drug concentrations are
governed by the pharmacokinetics model described in [3],
which assumes Michaelis-Menten kinetics for doxoru-
bicin uptake. Transport of doxorubicin across the cell
membrane is a saturable process [25], yet actual transport
across the membrane occurs by simple Fickian diffusion
[26]. This apparent paradox has been explained by the
ability of doxorubicin molecules to self-associate into
dimers that are impermeable to the lipid membrane, caus-
ing transport to mimic a carrier-mediated process [23,26].
A later model by El-Kareh and Secomb [4] additionally
considered non-saturable diffusive transport, but this
process is of less importance, and I disregard it in this
model.
I assume that over the course of a single treatment no
drug-induced cell death occurs, implying that cancer cell
density is constant in time. Cancer cell density is also
assumed to be (initially) homogenous throughout the
tumor cord. However, when considering multiple treat-
ments, the spatial profile of cancer cells is updated
between treatments, as is the fraction extracellular space.
The peak intracellular drug concentration over the course
of a treatment is tracked. At the end of this time, likely cell
death is determined according to the peak intracellular
drug concentration vs. surviving fraction for doxorubicin
given in [23]. The model variables are:
1. C(r) = Cancer cell density (cells/mm
3
)
2. S(t) = Plasma drug concentration (
μ
g/mm
3
)
3. F(r, t) = Free extracellular drug concentration (
μ
g/
mm
3
)
4. B(r, t) = Bound extracellular drug concentration
(
μ
g/mm
3
)
5. I(r, t) = Intracellular drug concentration (ng/10
5
cells)
Some care must be taken concerning the units for F and B,
which represent the concentration in
μ
g per mm
3
of space.
This space includes all tissue, not just the space that is
explicitly extracellular. The fraction of space that is extra-
cellular is represented by
ϕ
. Moreover, B refers strictly to
the concentration of bound doxorubicin in
μ
g/mm
3
, i.e.
the albumin component of the albumin:DOX complex is
not considered in the units of concentration, so 1
μ
g/mm
3
of free DOX corresponds directly to 1
μ
g/mm
3
of bound
DOX. However, the properties of the albumin:DOX com-
plex (MW, etc.) must still be taken into account in para-
metrization.
A number of 2- and 3-compartment pharmacokinetics
models for plasma doxorubicin concentration have been
proposed [20,22,24]. The plasma kinetics are largely
describable with a 2-compartment model. The initial dis-
tribution phase is characterized by a very short half-life
(5–15 min), while the half-life of elimination is on the
order of a day (18–35 hrs). However, some authors have
achieved a better fit to the data using a 3-compartment
model. Robert et al. [20] determined pharmacokinetic
parameter using a 3-compartment model for 12 patients
with unresectable breast cancer; Eksborg et al. [24] also
reported similar pharmacokinetic parameters for a 3-com-
partment model for 21 individual patients. Therefore, I
use the following 3-compartment model for plasma con-
centration that can be described using differential equa-
tions as
That is, total plasma concentration, S(t), is the sum of 3
compartments C
1
(t), C
2
(t), and C
3
(t). Here, D is the total
dose (
μ
m) injected and T is the infusion time (3 minutes
for a rapid bolus). The Heaviside term H(T-t) indicates
that infusion only occurs between t = 0 and t = T. This for-
mulation is useful for simulating multiple infusions of
drug when complete clearance between infusions has not
occurred. The plasma concentration for a single infusion
may also be given explicitly as
when t <T, and
when t ≥ T.
The PDE component of the model governs dynamics
within the spatial environment of the tumor cord as fol-
lows:
dC
dt
t
DA
T
HT t C
1
1
() ( )=−−
α
(4)
dC
dt
t
DB
T
HT t C
2
2
() ( )=−−
β
(5)
dC
dt
t
DC
T
HT t C
3
3
() ( )=−−
γ
(6)
St C C C()=++
123
(7)
St
D
t
A
e
B
e
C
e
TTT
() ( ) ( ) ( )=−+−+−
⎛
⎝
⎜
⎞
⎠
⎟
−−−
αβγ
αβγ
111
(8)
St
D
t
A
ee
B
ee
C
ee
Tt Tt Tt
() ( ) ( ) ( )=−+−+−
⎛
⎝
⎜
⎞
⎠
⎟
−−−
αβγ
αα ββγ γ
111
(9)
Theoretical Biology and Medical Modelling 2009, 6:16 />Page 5 of 20
(page number not for citation purposes)
Boundary conditions are used to account for an influx of
doxorubicin at the capillary wall:
No-flux boundary conditions are used for all variables at
the outer radius of the tumor cord. The drug fluxes per
unit area across the capillary wall are J
Free
and J
Bound
. In
each, the first term gives the rate of passive diffusion due
to concentration differences in the blood and extracellular
drug compartments. The second term represents drug
transported by convective forces. Blood concentration
and serum concentration are not identical; the blood con-
centration is
θ
S, where
θ
is the fraction of blood that is
plasma (0.6). Likewise, F is the concentration of free dox-
orubicin per mm
3
of tissue space, while F/
ϕ
is the concen-
tration in the extracellular space. The fraction of tissue
adjacent to the capillary wall that is extracellular space is
ϕ
, implying that the effective concentration of drug on the
tissue side of the capillary wall is
ϕ
× F/
ϕ
= F. Thus, the flux
of free drug is a function of
θ
(1-
δ
) S and F, where
δ
is the
fraction of plasma drug bound to albumin. The flux of
bound drug is similarly a function of
θδ
S and B. There are
two versions for all transport parameters, one for free
DOX (typically subscripted by F) and one for bound DOX
(subscripted by B). Note that the exception is the solvent-
drag reflection coefficient, which is generally given as
σ
F
,
so F and B are superscripted for this parameter.
The cellular uptake and efflux functions are
μ
and
υ
,
respectively. These are similar to those used in [3], and
V
max
gives the maximum rate of transport in terms of ng/
(10
5
cells hr). K
E
and K
I
are the Michaelis constants for
half-maximal transport. In the study by Kerr et al. [23],
from which these functions were determined, cells were
cultured in a medium that included foetal calf serum.
Therefore, significant albumin was likely present, imply-
ing that K
E
refers to the sum of both bound and unbound
drug. However, only unbound doxorubicin is likely to
cross the cell membrane. Thus,
μ
depends on both F and
B, but only free drug is actually transported, and
μ
and
υ
only appear in the equation for F.
Transport across cell membranes at a given spatial point
depends upon drug concentration per mm
3
of extracellu-
lar space and not general tissue space – the unit for F and
B. This causes the dependence upon
ϕ
, the fraction of
space that is extracellular, in the uptake function
μ
. The
simple scaling parameter
ρ
is also included to keep units
consistent.
Finally, the initial condition for all model variables is 0,
except cancer cells, which are initially set to density d
C
at
all points:
Tumor cell survival
It has previously been reported that survival in cancer cells
exposed to DOX is an exponential function of the extracel-
lular AUC [22]. However, El-Kareh and Secomb have
argued that peak intracellular concentration is a better
predictor of cell survival [3,4]. I estimate cancer cell mor-
tality using the in vitro data of Kerr et al. [23], who found
the relationship between intracellular DOX concentration
and log cell survival to be linear in non-small cell lung
cancer cells. The surviving cell fraction, S
F
, is determined
∂
∂
=∇− + − +
F
t
rt D F C C kF kB
Fad
(,)
2
ρμ ρυ
(10)
∂
∂
=∇+ −
B
t
rt D B kF kB
Bad
(,)
2
(11)
∂
∂
=−
I
t
rt(,)
μυ
(12)
μ
φ
υ
=
+
++
=
+
V
FB
FBK
E
V
I
IK
I
max
max
∂
∂
=
∂
∂
=
∂
∂
=
F
r
Rt J
B
r
Rt J
I
r
Rt
C
C
C
(,)
(,)
(,)
Free
Bound
0
JtP StFrtJ F
FCFF
F
lmFree
() ( ( )() ( , )) ( )=−− +−
θδ σ
11Δ
(13)
JtPStBrtJ B
BCFF
B
lmBound
() ( () ( ,)) ( )=−+−
θδ σ
1 Δ
(14)
ΔF
St Fr
C
t
St Fr
C
t
St F
lm
=
−−
−
−+
θδ
θδ
θδ
()()(,)
ln[ ( ) ( ) / ( , )]
()()1
1
1
((,)
() ( ,)
ln[ ( ) / ( , )]
() ( ,
r
C
t
B
St Br
C
t
St Br
C
t
St Br
C
lm
2
Δ=
−+
θδ
θδ
θδ
tt)
2
JLPP
FPVE V E
=−−−[( ) ( )]
σ
ΠΠ
S
Cr d
Fr
Br
Ir
C
()
()
(, )
(, )
(, )
00
00
00
00
=
=
=
=
=
Theoretical Biology and Medical Modelling 2009, 6:16 />Page 6 of 20
(page number not for citation purposes)
as an exponential function of peak intracellular DOX con-
centration:
where
ω
= 0.4938 gives the best fit to the data. Using the
pharmacokinetic model for DOX uptake together with
this fit gives good agreement for cell survival with a sepa-
rate data-set published in the same paper, where cells were
exposed to different concentrations of DOX for 1 hour.
However, this model overestimates mortality for a second
data-set where cells were exposed to 5
μ
m/ml of DOX for
shorter periods of time, suggesting that in reality both
exposure time and peak concentration are important in
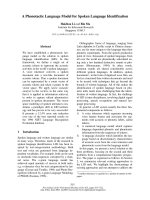
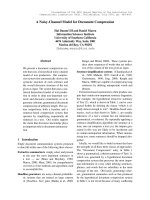
determining cytotoxicity. The fit and comparisons are
shown in Figure 2.
Because cell survival was assessed using a clonogenic
assay, cytotoxicity for an in vivo tumor may be overesti-
mated, as a much smaller fraction of cells in an advanced
tumor will be proliferating than in such an assay.
Parametrization
Values for all model parameters can be estimated from
empirical biological data and from previous models. I use
transport parameters for albumin for the bound doxoru-
bicin and directly determine these parameters for free dox-
orubicin. The plasma fraction of blood,
θ
, is assumed to
be 0.6, and a body surface area of 1.73 m
2
is assumed.
Tumor cord geometry parameters
Vessel and cord radii
Tumors can vary greatly in the level of perfusion and in
the regularity of their vasculature. Furthermore, there is
great heterogeneity within single tumors [27-29].
Tumoral vasculature is characterized by irregular branch-
ing patterns with capillaries arranged in irregular mesh-
works that were studied in [28]. The mean capillary
diameter was measured as 10.3 ± 1.4
μ
m, and the mean
capillary length was 66.8 ± 34.2
μ
m. Mean vessel diameter
for melanoma xenografts varied between 9.5 and 14.6
μ
m
in [29]. However, larger values have been reported, and
vessel diameter was 20.0 ± 6.2
μ
m for neoplastic tissue in
[30]. Furthermore, Hilmas et al. [31] found that vessel
diameter increased dramatically with tumor size, increas-
ing from about 10
μ
m to over 30
μ
m.
In [13], for various tumors, the blood vessel radius for
tumor cords was reported as 10–40
μ
m and the viable
tumor cord radius was 60–130
μ
m from the vessel wall.
The mean tumor cord radius for squamous cell carcino-
mas was measured as 104
μ
m in [32]. Primeau et al. [7]
measured the mean distance from vessels to hypoxic
regions as 90–140
μ
m.
Capillary surface area
Total capillary surface area varies greatly between tumor
types and individual tumors. Surface areas were measured
as 1.2–2.6 × 10
4
[31], 1.5–5.7 × 10
4
, and 0.5–2.0 × 10
4
mm
2
/g wet wt. [21] for mouse mammary carcinomas,
mouse mammary adenocarcinomas, and rat hepatomas.
Larger tumors typically have less vascular surface area
[21], although vascular volume may stay relatively con-
stant [31].
Fraction extracellular space
The fraction of extracellular space,
ϕ
, in tumors is much
greater than in normal tissue and may range from 0.2 to
0.6 [33]. Assuming that average tumor cell diameter
ranges between 10 and 20
μ
m, tumor cell density may
range from as little as 0.955 × 10
5
cells/mm
3
to as much as
1.53 × 10
6
cells/mm
3
(assuming
ϕ
between 0.2 and 0.6).
Transport parameters
Hydrostatic fluid pressures (P
V
, P
E
)
Tumor capillary fluid pressures (parameter P
V
) range
roughly from 10 to 30 mmHg, and interstitial fluid pres-
sure (IFP, parameter P
E
) within the tumor is often close to
or even greater than fluid pressure within the capillary
[21,29]. For example, Boucher and Jain [34] found rat
mammary adenocarcinoma microvessel pressures to
range from 7–31 mmHg (17.3 ± 6.1 mmHg) and tumor
IFP ranged 4.4–31.5 mmHg (18.4 ± 9.3 mmHg). The
greatest pressure drop was 7 mmHg, and the fluid pressure
in the vessel was usually greater than in the interstitium,
although in some cases the IFP was greater. The IFP in the
outer region is typically much lower than the central
region [34,35], and larger tumors have greater IFP every-
where [21].
Osmotic pressures (
Π
V
,
Π
E
)
In most species, the plasma osmotic pressure is about 20
mmHg [36]. Due to the leaky nature of tumor vessels,
many macromolecules are present in the interstitium, and
osmotic pressure in tumoral tissue is near that of the
plasma. In [36], Π
V
= 20.0 ± 1.6 mmHg, and Π
E
= 16.7 ±
3.0, 19.9 ± 1.9, 21.8 ± 2.8, and 24.2 ± 4.7 mmHg for colon
adenocarcinoma, squamous cell carcinoma, small cell
lung carcinoma, and rhabdomyosarcoma mouse
xenografts, respectively. Thus, while often ΔΠ ≈ 0, a rea-
sonable range is ΔΠ = -9.0 – 8.0 mmHg.
Osmotic reflection coefficient (σ)
It is assumed that macromolecules such as albumin are
the dominant contributors to the osmotic pressure gradi-
ent between the vessel and tumor tissue. The osmotic
reflection coefficient for albumin,
σ
, is between .8 and .9
in most tissues, and approaches 1 in skeletal muscle and
the brain [21].
SI
Fpeak
=−exp( )
ω
Theoretical Biology and Medical Modelling 2009, 6:16 />Page 7 of 20
(page number not for citation purposes)
Cell survival predicted as an exponential function of peak intracellular DOX concentration, using data from Kerr et al. [23]Figure 2
Cell survival predicted as an exponential function of peak intracellular DOX concentration, using data from
Kerr et al. [23]. Using this fit and the drug uptake model gives good agreement to a second data-set published in the same
paper, but a rather poor agreement with a third. (A) Cell survival as a function of intracellular drug concentration. (B) Pre-
dicted cell survival versus the actual cell survival for cells exposed to different concentrations of DOX for 1 hour. (C) Pre-
dicted cell survival versus the actual cell survival for cells exposed to 5
μ
m/ml of DOX for 15, 30, 45, and 60 minutes.
(a)
(b)
(c)
Theoretical Biology and Medical Modelling 2009, 6:16 />Page 8 of 20
(page number not for citation purposes)
Solvent-drag reflection coefficients ( , )
The solvent-drag reflection coefficient, , for albumin
was measured at .82 ± .08 in the perfused cat hindlimb
[37]. Osmotic reflection and solvent-drag reflection coef-
ficients were similar in [38], and
σ
F
Ӎ
σ
in dilute solutions
[21]. In [39],
σ
= .35 ± .16 for raffinose in dog lung
endothelium, and since the molecular weight of raffinose
(504) is similar to that of doxorubicin (544), I let =
.35.
Hydraulic conductivity (L
p
)
Sevick and Jain [40] measured the capillary filtration coef-
ficient (CFC), i.e. L
p
A where A = vascular surface area, for
mouse mammary adenocarcinomas, finding CFC ≈ 2.6 ±
.5 ml/. Using vascular surface areas for mouse mammary
tumors (A = 1.2 – 5.7 × 10
4
mm
2
/g wet wt) allows L
p
to be
estimated as .022–.16 mm
3
/hr/mmHg.
Diffusional permeability (P
F
, P
B
)
Estimating the vascular permeability coefficient, P, is com-
plicated by the fact that most estimates are of the "effective
permeability coefficient," P
Eff
, which subsumes both dif-
fusive and convective transport into a single parameter. In
tumoral tissue, this may be close to the actual permeabil-
ity coefficient if both osmotic and hydraulic pressures are
similar within plasma and the interstitium, which is typi-
cally the case [34]. Wu et al. [41] measured P
Eff
for albu-
min to be about three-fold higher in tumoral compared to
normal tissue, and Gerlowski and Jain [30] found P
Eff
to
be 8 times higher for 150 KDa dextran in tumor tissue.
Using published values for P
Eff
for molecules with MWs
similar to DOX and these ratios, I estimate that for free
DOX, P
Eff
= 2.916 – 13.306 mm/hr [41,42]. Ribba et al.
[17] used P = 10.8 mm/hr for DOX in a mathematical
model. Wu et al. [41] measured P
Eff
= .0281 ± .00432 mm/
hr for albumin (corresponding to albumin-bound DOX)
in tumor tissue, although the authors considered this to
be an underestimate. Such measurements for P
Eff
give a
high but not unrealistic estimate for the actual P, as con-
vective flux is considered to be minimal in most tumors
[34].
I note that capillary fenestration dramatically increases
permeability for small molecules, but does not appear to
significantly affect macromolecules [43]. Fenestration
may increase hydraulic conductivity 20-fold [43] and, for
molecules similar in size to free DOX, the effective perme-
ability coefficient may be 2 orders of magnitude higher
[21].
Diffusion coefficients (D
F
, D
B
)
Based on the relationship given in [44] (D = .0001778 ×
(MW)
75
), the diffusion coefficient for free extracellular
doxorubicin, D
F
, is calculated to be 0.568. However, it
may be significantly higher, as Nugent and Jain [33]
found that the diffusion coefficient for small molecules in
tumor tissue was nearly that predicted by the Einstein-
Stokes relation for free diffusion in water (D
0
). McLennon
et al. [45] estimated a molecular radius of 3 Å for dauno-
mycin, which implies D
0
= 4.03 mm
2
/hr. Assuming D/D
0
is at most 0.89 [33], D
F
may be as great as 3.587 mm
2
/hr.
Diffusion of macromolecules is significantly higher in
tumoral than in normal tissue [21,33]. The effective diffu-
sion coefficient for albumin in VX2 carcinoma was meas-
ured as .03276 mm
2
/hr [33], about twice that predicted by
the relation in [44] (.01537 mm
2
/hr). Using the FRAP
technique, Chary and Jain [46] estimated a diffusion coef-
ficient an order of magnitude higher at .2268 mm
2
/hr, but
stated that this technique likely measures diffusion in the
fluid phase of the interstitium, rather than the effective
diffusion coefficient. But, since tumors have a very large
fraction extracellular space, the effective diffusion coeffi-
cient may still be close to this value.
Pharmacokinetics parameters
Most doxorubicin is bound to plasma proteins. Greene et
al. [22] found 74–82% to be bound; the percentage
bound was independent of both doxorubicin and albu-
min concentration. Wiig et al. [47] found albumin con-
centration to be high in rat mammary tumor interstitial
fluid at 79.9% of the plasma concentration. Therefore, it
is likely that doxorubicin-albumin binding in the tumor
extracellular space is similar to that in plasma. I assume
that the on/off binding kinetics of free and bound DOX in
the are fast relative to the other processes in the model and
take k
d
/k
a
= (fraction free), with k
d
and k
a
large.
The pharmacokinetic parameters V
max
, K
E
, and K
I
, were
determined by El-Kareh and Secomb in [3] using data
given by Kerr et al. [23]. The cell mortality constant
ω
has
been determined using data from the same paper as
shown in Figure 2. Table 1 gives all parameters, values,
and references used.
Numerical methods
The coupled ODE-PDE system is solved numerically in
the tumor cord geometry using an explicit finite difference
method for the PDE portion. The ODE system is either
solved explicitly as in Equations 8 and 9, or solved numer-
ically using either first-order differencing in time. When
simulating multiple treatments, each treatment is run as a
separate simulation. The expected cell mortality at every
spatial point is then calculated, and this is used to deter-
mine a spatial profile of cell density, which is then given
σ
F
F
σ
F
B
σ
F
B
σ
F
F
Theoretical Biology and Medical Modelling 2009, 6:16 />Page 9 of 20
(page number not for citation purposes)
as the initial condition for C(r) for the simulation of the
next treatment.
Results and discussion
Basic model dynamics
For both rapid bolus and short infusions, the distribution
of DOX to tumor cells within the tumor cord occurs in
essentially two phases. The first phase roughly corre-
sponds to the plasma distribution (
α
) phase, and in this
phase a gradient of both intracellular and extracellular
drug is established. In the second phase, corresponding to
the plasma elimination (
γ
) phase, intracellular and extra-
cellular concentrations decrease and flatten in space. They
also remain nearly static in time, decreasing very slowly
compared to the time-scale of the first phase. Eventually,
the gradient inverts, and DOX slowly clears from the extra-
cellular space and back into the plasma. Within the tumor
cord, most drug is sequestered either in the intracellular
compartment or bound to proteins; only a small fraction
is free. The first phase is primarily responsible for cell kill
within 100
μ
m of the vessel wall, while the second phase
establishes a low, uniform level of mortality throughout
the tumor cord. Thus, the first phase is likely dominant in
drug delivery to the non-hypoxic portion of the tumor
cord, while the second dominates drug penetration
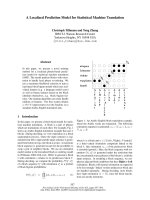
deeper within the cord. This pattern of DOX distribution
in the tumor cord as a function of time for a rapid bolus
is shown in Figure 3.
Different infusion times and doses
I compare the efficacy of doxorubicin treatment by bolus
injection versus continuous infusions. Following treat-
ment, the cell fraction killed at every point is predicted
from the peak intracellular concentration, and integrating
Table 1: All parameters and values.
Parameter Meaning Value Reference
A Compartment 1 parameter 15.7–-130.3 × 10
-9
mm
-3
(74.6 × 10
-9
)[20]
B Compartment 2 parameter .415–-6.58 × 10
-9
mm
-3
(2.49 × 10
-9
)[20]
C Compartment 3 parameter .277– 977 × 10
-9
mm
-3
(.552 × 10
-9
)[20]
α
Compartment 1 clearance rate 5.09–12.76/hr (9.68) [20]
β
Compartment 2 clearance rate .520–2.179/hr (1.02) [20]
γ
Compartment 3 clearance rate .0196–.0804/hr (.0423) [20]
V
max
Rate for transmembrane transport 16.8 ng/(10
5
cells hr) [3]
K
E
Michaelis constant 2.19 × 10
-4
μ
g/mm
3
[3]
K
I
Michaelis constant 1.37 ng/10
5
cells [3]
ρ
Scaling factor 10
-8
μ
g (10
5
cells)/(ng cell)
ϕ
Tumor fraction extracellular space 0.2–0.6 (0.4) [33]
d
C
Density of tumor cells 0.955–-15.3 × 10
5
cells/mm
3
(10
6
)see text
D
F
Free DOX diff. coeff. 0.568–3.587 mm
2
/hr (.568) [33,44,45]
D
B
Bound DOX diff. coeff. .03276–.2268 mm
2
/hr (.032) [33,46]
P
F
Diffusive permeability for free DOX 2.916–13.306 mm/hr (10.0) [41,42]
P
B
Diffusive permeability for bound DOX .02378–.03242 mm/hr (.032) [41]
P
V
Tumor capillary fluid pressure 4.4–31.5 mmHg (20.0) [34]
P
E
Tumor IFP 4.4–31.5 mmHg (15.0) [34]
L
p
Hydraulic conductivity .022–.16 mm
3
/hr/mmHg (0.1) [21,31,40]
σ
Osmotic reflection coefficient .8–1.0 (.85) [21]
Coupling coefficient for free DOX .19–.51 (.35) [21,38,39]
Coupling coefficient for bound DOX .74–.9 (.82) [37,38]
Π
V
Plasma colloid osmotic pressure 20 mmHg [36]
Π
E
Tumor colloid osmotic pressure 13.7–27.9 mmHg (20) [36]
A Total tumor vasculature surface area 0.5–5.7 × 10
4
mm
2
/g wet wt. [21]
R
C
Tumor capillary radius 5–20
μ
m (10) [13,30,31]
R
T
Viable tumor cord radius 50–150
μ
m (150) [7,13,28,32]
δ
Fraction of plasma DOX bound .74–.82 (.75) [22]
k
a
Free DOX-albumin binding rate 3000–4000/hr (3000) see text
k
d
DOX-albumin dissociation rate 1000/hr see text
ω Cell survival exponential constant 0.4938 [23], see text
The possible parameter range as determined in the text is given, and the default value used in simulations is in parentheses.
σ
F
F
σ
F
B
Theoretical Biology and Medical Modelling 2009, 6:16 />Page 10 of 20
(page number not for citation purposes)
over the tumor cord gives the total fraction of cancer cells
killed. I primarily use two metrics to measure efficacy: the
total fraction of cancer cells killed and the fraction of can-
cer cells killed at the vessel wall. As these metrics are based
upon peak intracellular concentration, the intracellular
AUC at each spatial point in the tumor cord is also
tracked. Overall cell mortality and mortality at the cell
wall are strongly, but not perfectly, correlated. Given that
in vivo greater proliferation and better oxygenation will be
seen near the vessel wall, predicted cell kill near the vessel
wall may be a better predictor of efficacy than overall cell
kill, as the model does not account for these complicating
factors. In general, the model predicts that short infusion
times (less than 1 hour) are best, and the optimal infusion
time depends on the dose. For smaller doses, a rapid bolus
is optimal, while for larger doses, infusion times up to
about 1 hour are as effective or better than bolus injection.
For infusions longer than 2 hours, there is a significant
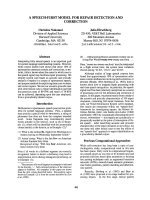
reduction in efficacy. The spatial profile of cell kill within
a tumor cord for a single dose of 75 mg/m
2
under different
infusion times is shown in Figure 4, and Figure 5 gives
overall cell mortality and mortality at the vessel wall as a
function of infusion time for several different doses.
I examine the efficacy of low-dose (LD) versus high-dose
(HD) chemotherapy delivered in a single infusion to a
tumor cord. With increasing dose, cell mortality at the ves-
sel wall increases semi-linearly, and total cell mortality
increases linearly. Profiles of cell mortality under different
doses are shown in Figure 6.
Treatment under different pharmacokinetic parameters
The pharmacokinetic parameters describing DOX plasma
dynamics are well-described by a 3-compartment model,
but the parameters vary significantly between patients.
Robert et al. [20] measured short-term response to DOX
treatment in 12 breast cancer patients and compared
pharmacokinetic parameters to response, finding that
Intracellular and extracellular doxorubicin distribution in the tumor cord following a 3 minute infusion (rapid bolus) of 105 mg/m
2
Figure 3
Intracellular and extracellular doxorubicin distribution in the tumor cord following a 3 minute infusion (rapid
bolus) of 105 mg/m
2
. Profiles are shown at (A) 3 mintues, (B) 10 minutes, (C) 1 hour, (D) 24 hours.
(a) (b)
(c) (d)
Theoretical Biology and Medical Modelling 2009, 6:16 />Page 11 of 20
(page number not for citation purposes)
plasma AUC was a poor predictor of response. Using the
reported pharmacokinetic parameters and dose for each
patient, I have run a simulated course of therapy in a
tumor cord for each patient (all other parameters are the
baseline values given in Table 1). The predicted tumor
fraction killed and mortality at the vessel wall both corre-
late well with the reported response following a single
treatment, indicating that the model has some utility in
predicting responses to DOX therapy.
I have performed a sensitivity analysis of the 6 plasma
pharmacokinetic parameters, A, B, C,
α
,
β
,
γ
, by varying
each over the parameter range in [20]. The model predicts
that A and
α
, which determine the kinetics of the initial
distribution phase, are the most important parameters in
determining both overall cell mortality and mortality at
the vessel wall. This is also in accord with the results of
Robert et al., who found a strong correlation between A
and the short-term tumor response, and a moderate corre-
lation between a and the short-term tumor response.
The fraction of DOX that is bound to plasma proteins is
also important in determining DOX delivery to the tumor
cord. As expected, increasing the fraction of plasma drug
that is free significantly improves delivery and cell kill.
Unexpectedly, however, this is not the case for free extra-
cellular DOX, and increasing the fraction bound actually
increases cell kill. Bound extracellular drug apparently acts
as a reservoir during the elimination phase and limits
clearance out of the tumor to the vasculature.
Treatment under different microenvironment parameters
To give a picture of how doxorubicin delivery varies in dif-
ferent microenvironments, a sensitivity analysis on all the
parameters that describe the tumor cord geometry and
transport to the cord has been performed.
Spatial profiles of predicted cancer cell mortality under different infusion timesFigure 4
Spatial profiles of predicted cancer cell mortality under different infusion times. The results for a rapid bolus (3
minute infusion) are compared to 30, 60, 120, and 240 minute infusions. (A) Rapid bolus vs. 30 minute infusion. (B) Rapid bolus
vs. 1 hour infusion. (C) Rapid bolus vs. 2 hour infusion. (D) Rapid bolus vs. 4 hour infusion.
(a) (b)
(c) (d)
Theoretical Biology and Medical Modelling 2009, 6:16 />Page 12 of 20
(page number not for citation purposes)
Metrics of treatment efficacy for a treatment of 75 mg/m
2
delivered for infusion times between 0 and 4 hours (0 hours ~3 minute bolus infusion)Figure 5
Metrics of treatment efficacy for a treatment of 75 mg/m
2
delivered for infusion times between 0 and 4 hours
(0 hours ~3 minute bolus infusion). (A) Tumor fraction killed vs. infusion time. (B) Tumor fraction killed at vessel wall vs.
infusion time.
(a)
(b)
Theoretical Biology and Medical Modelling 2009, 6:16 />Page 13 of 20
(page number not for citation purposes)
Profiles of cell mortality under rapid bolus and 1 hour infusion for different doses of DOX, ranging from 25 mg/m
2
to 150 mg/m
2
Figure 6
Profiles of cell mortality under rapid bolus and 1 hour infusion for different doses of DOX, ranging from 25 mg/
m
2
to 150 mg/m
2
. (A) Rapid bolus. (B) 1 hour infusion.
(a)
(b)
Theoretical Biology and Medical Modelling 2009, 6:16 />Page 14 of 20
(page number not for citation purposes)
Plasma to cord transport
The parameters determining convective flux, i.e. hydraulic
conductivity, L
p
and the hydrostatic and osmotic pressure
gradients, Δ
P
= P
V
-P
E
and ΔΠ = Π
E
-Π
V
, have only a small
effect on the transport of DOX to the tumor cord, at least
within what has been determined to be biologically real-
istic parameter space. Thus, the transport of DOX appears
to be dominated by diffusive rather than convective
forces, and elevated tumor IFP is only a minor barrier to
treatment by doxorubicin.
The diffusive permeability of free DOX, P
F
, is extremely
important in determining transport to the tumor cord,
and is likely the single most important parameter. The dif-
fusive flux of bound DOX is nearly negligible, and increas-
ing P
B
increases transport by an insignificant amount.
Thus, diffusive transport of free DOX is the dominant
mechanism by which the drug is delivered to the tumor
cord.
Extracellular diffusion
Altering the diffusion coefficients for free and bound
extracellular DOX have different effects on delivery.
Increasing diffusion for free DOX (D
F
) significantly
increases drug delivery. Increasing diffusion for bound
DOX (D
B
) actually inhibits delivery slightly and reduces
cell kill near the vessel wall. I interpret this to mean that
the dominant effect of high diffusion for free DOX is to
reduce the drug concentration near the vessel wall during
the plasma distribution phase and therefore aid transport
into the tumor cord. During the terminal phase the DOX
gradient inverts and drug begins clearing back into the
vasculature, and the dominant effect of high diffusion for
bound DOX is to aid in this clearance.
Cell packing
The baseline cell density (d
C
) and fraction extracellular
space (
ϕ
) significantly affect drug delivery. Examining
these parameters independently of each other suggests
that increases in cell density inhibit transport, yet a lower
fraction extracellular space aids transport. However, these
variables are related by the relationship
where V
C
is the volume of a single cancer cell. Examining
the effect of these two variables when constrained by this
relationship indicates that increasing the fraction extracel-
lular space (and thus reducing cell density) increases the
overall cell kill in the tumor cord, but reduces cell kill at
the vessel wall. Therefore, it can be concluded that tighter
cell packing increases drug sequestration and mortality
near the cell wall, but inhibits the transport of drug deeper
into the tumor cord. Looser cell packing results in a more
uniform profile of mortality with overall mortality
greater.
Vessel and cord radii
The tumor cord radius, R
T
, is a function of the intercapil-
lary distance in the tumor, and the reflecting boundary
condition at the outer edge of the tumor cord reflects the
effect of DOX diffusing from neighboring tissue. The
tumor cord radius dramatically affects DOX delivery to
the cord system, with smaller cords experiencing much
greater cell kill deeper within the cord. Interestingly, the
profile near the vessel wall is not greatly affected by R
T
.
Profiles of cell mortality following treatment for different
tumor cord radii are shown in Figure 7. Increasing the
tumor capillary radius, R
C
, results in improved drug deliv-
ery as measured by all metrics. The capillary radius also
affects the optimal infusion time. Larger radii increase the
efficacy of continuous infusions, while tumors with small
radii respond better to bolus injection. Since the abnor-
mal tumor vessels are typically dilated [48], this result
supports the use of continuous infusions in advanced
tumors.
Multiple treatments
I simulate the application of several subsequent treat-
ments. Each treatment is run as a separate simulation, and
following each treatment cell mortality everywhere in the
tumor cord is calculated. From this, a new, spatially
explicit profile of cancer cell density is calculated which is
used as the initial condition for C(r) for the next treat-
ment. Also, the fraction of tumor extracellular space,
ϕ
, is
recalculated at every point according to the relation
where V
C
is the volume of a single tumor cell. No cancer
regrowth between administration of subsequent treat-
ments is considered, nor is the effect of cell migration into
space freed by cell death, but these should be addressed in
the future. All treatments are equally efficacious in terms
of total cell mortality, although the relative cell mortality
at the vessel wall is generally greatest for the initial treat-
ment. The profiles of surviving cells after each treatment
for 5 bolus infusions of 105 mg/m
2
are shown in Figure 8.
Simulating the delivery of a total dose of 525 mg/m
2
as
either 10 doses (52.5 mg/m
2
), 7 doses (75 mg/m
2
), or 5
doses (105 mg/m
2
) suggests that greater fractionation
gives slightly better results. Furthermore, response to mul-
tiple treatments strongly depends upon the tumor cord
radius: delivering 525 mg/m
2
results in a 50% regression
in a tumor cord with a radius of 150
μ
m, 74% regression
for a radius of 100
μ
m, and nearly 100% regression for a
radius of 50
μ
m. This is comparable to breast tumor
regressions of between 10 and 95% (average 74%) follow-
φ
=−1 dV
CC
φ
() ()rCrV
C
=−1
Theoretical Biology and Medical Modelling 2009, 6:16 />Page 15 of 20
(page number not for citation purposes)
Profiles of tumor cell mortality for a single infusion of 75 mg/m
2
delivered as a rapid bolus in tumor cords with different radii (R
T
)Figure 7
Profiles of tumor cell mortality for a single infusion of 75 mg/m
2
delivered as a rapid bolus in tumor cords with
different radii (R
T
). (A) Spatial profiles of cell kill for different tumor cord radii. (B) Spatial profiles of cell kill for different
tumor cord radii superimposed in the same plot.
(a)
(b)
Theoretical Biology and Medical Modelling 2009, 6:16 />Page 16 of 20
(page number not for citation purposes)
ing 5 courses of doxorubicin (50 mg/m
2
each), vincristine,
and methotrexate combination therapy reported by Rob-
ert et al. [20]. For tumor cords with large radii (likely
advanced tumors), mortality beyond 100
μ
m from the
vessel wall is limited even after multiple treatments. How-
ever, if cell motility were to be taken into account, it is
possible that the surviving cancer cell population could
shift towards the vessel wall. This would likely increase
the efficacy of subsequent treatments. Because of their
increased activity at the vessel wall, short continuous infu-
sions would then, perhaps, be relatively more effective.
The space-filling effect of necrotic debris and clearance of
this matter into the circulation probably also plays a role.
Therefore, these results can only be viewed as preliminary.
Minimizing peak plasma concentration
Because peak plasma concentration of DOX is correlated
with cardiotoxicity and other side effects, there has been
interest in reducing cardiotoxicity either by increasing
infusion time or dividing single large infusions into mul-
tiple smaller infusions. For example, Greene et al. [22]
proposed that dividing a 15 minute infusion of 75 mg/m
2
into 5 infusions of 15 mg/m
2
lasting 120 minutes, peak
plasma concentration could be reduced 30-fold without
reducing plasma AUC. I examine the efficacy of such frac-
tionated regimes compared to single infusions.
Figure 9 shows how the peak plasma concentration
changes with infusion time, relative to a rapid bolus of 3
minutes. This depends upon an individual's plasma phar-
macokinetic parameters, and the range for the 12 patients
reported by Robert et al. [20] is displayed along with the
average. Peak plasma concentration changes linearly with
dose (D). In general, dividing a dose given by rapid bolus
into several smaller doses (that independently cause mor-
tality) slightly increases the efficacy of the treatment.
Thus, the previous result for fractionating a total dose of
525 mg/m
2
scales down. However, the efficacy of different
infusion times changes with dose size, with rapid bolus
better for smaller doses. Therefore, the two strategies for
reducing peak plasma concentration are "competing" to
some degree. For example, giving a 75 mg/m
2
dose as a 1
hour infusion reduces peak plasma concentration nearly
7-fold (see Figure 9); a 2 hour infusion reduces it 12-fold.
Dividing a 75 mg/m
2
bolus into five 15 mg/m
2
boluses
alone reduces peak concentration 5-fold. I have found
that for this dose size, 30 minute infusions preserve anti-
tumor activity, but overall, peak plasma concentration is
reduced 18-fold compared to a single bolus of 75 mg/m
2
.
Extending to a 1 hour infusion decreases efficacy some-
what, but peak plasma concentration is reduced over 30-
fold. Thus, fractionating doses and using brief infusions
(no longer than 1 hour) is likely a better strategy than
extended infusion times for a single dose. However, both
Spatial profiles of tumor cell density over the course of five treatments of 105 mg/m
2
by rapid bolusFigure 8
Spatial profiles of tumor cell density over the course of five treatments of 105 mg/m
2
by rapid bolus.
Theoretical Biology and Medical Modelling 2009, 6:16 />Page 17 of 20
(page number not for citation purposes)
are effective, and a single extended infusion may be more
practical clinically.
Conclusion
The essence of my model is the conceptual coupling of the
earlier doxorubicin uptake pharmacokinetics model of El-
Kareh and Secomb [3], the plasma pharmacokinetics
model of Robert et al. [20], and the well-known principle
of solute transport [21]. Applying this model to a tumor
cord geometry gives a relatively simple framework that
allows realistic modeling of drug delivery in an in vivo
tumor. This model allows quantification of the behavior
of doxorubicin within the spatial environment of the
tumor. Cell mortality can be predicted, and all parameters
can be estimated directly from empirical data and their
importance quantified.
Cardiotoxicity is widely believed to be related to peak
plasma concentration [6,22,24], and several clinical trials
have demonstrated that, in adults, long-term infusion
(24–96 hours) of doxorubicin has reduced cardiotoxicity
compared to bolus injection [6,49,50].
This leads to the most important and clinically relevant
result of the paper, which is that cardiotoxicity may be
reduced while maintaining anti-tumor efficacy through
two dose scheduling strategies: (1) Extend infusion time
(up to 2 hours) for the standard dose (50–75 mg/m
2
), (2)
Fractionate the standard dose into several smaller infu-
sions (15–25 mg/m
2
). The latter strategy has previously
been suggested by several groups [22,24]. For smaller
doses, infusion times less than 1 hour preserve anti-tumor
activity and further reduce peak plasma concentration.
Moreover, while peak plasma concentration is reduced
dramatically for short infusions, the reduction in peak
concentration decreases with increasing infusion time
(see Figure 9). Thus, combining the two strategies to
deliver several small doses infused for short times may be
optimal.
Results also suggest that DOX transport to tumor cords
can be characterized by two phases; the first phase prima-
rily determines cell mortality near the tumor cord's vessel
wall, and the second establishes a relatively uniform
"baseline" level of mortality. To maximize cell kill, it is
essential to maximize DOX delivery during the first phase.
For small doses of the drug, this is best accomplished by a
rapid bolus. For larger doses, continuous infusions are
slightly more efficacious. The importance of the first (dis-
tribution) phase is supported by sensitivity analysis of the
Peak plasma DOX concentration for different infusion times, relative to rapid bolus (3 minutes)Figure 9
Peak plasma DOX concentration for different infusion times, relative to rapid bolus (3 minutes). This curve
depends on pharmacokinetic parameters; the center curve is the average for the 12 parameter sets reported by Robert et al.
[20]. The minimum and maximum curves from this data-set are also shown.
Theoretical Biology and Medical Modelling 2009, 6:16 />Page 18 of 20
(page number not for citation purposes)
plasma pharmacokinetic parameters, which suggests that
A and
α
are the most important parameters in determin-
ing cell kill within the tumor cord. Robert et al. [20] also
found these parameters to be the most important in pre-
dicting tumor response.
Results indicate that the tumor microenvironment is
important in determining drug delivery into solid tumors,
and the diffusional permeability of free DOX, the effective
diffusion coefficient of free DOX, cell packing density, the
tumor capillary radius, and overall tumor cord radius are
all significant determinants of DOX delivery to the sys-
tem. Denser tumors display increased cell kill near the ves-
sel wall, while less dense tumors have more uniform
delivery that penetrates further into the tumor cord. Since
the effective diffusion coefficient is likely to increase with
the fraction extracellular space, less dense tumors may
respond better to chemotherapy.
Somewhat surprisingly, the tumor IFP is relatively unim-
portant, and lowering it increases treatment efficacy by
only a small amount. Thus, the model predicts that ele-
vated tumor IFP does not pose a significant barrier to
DOX treatment. This makes sense in light of the model's
other prediction: transport to the tumor cord is domi-
nated by diffusive transport free DOX.
Interestingly, binding to proteins affects DOX delivery dif-
ferently in the plasma and extracellular tumor space.
While increasing the fraction of bound DOX in the
plasma inhibits delivery to the tumor cord, increasing
binding to proteins in the extracellular space causes
bound DOX to act as a reservoir that increases cellular
exposure to DOX.
Increasing the vessel radius greatly increases the transport
of DOX into the tumor cord; this is expected, as doing so
increases the vascular area of exchange. Increasing the
tumor cord radius, and hence the intercapillary distance
within the larger tumor, dramatically decreases the effi-
cacy of DOX treatment.
For larger tumor cords (radius ≥ 150
μ
m), cell kill beyond
about 100
μ
m from the vessel wall is low, even for an infu-
sion of 150 mg/m
2
. Deep within the cord, cell kill
increases with additional treatments, but ultimately does
not exceed 50% even for a cumulative dose of 525 mg/m
2
.
Therefore, limited distribution due to large intercapillary
distances may represent a fundamental mechanism by
which advanced tumors resist chemotherapy, at least in
the case of doxorubicin. This mechanism has been sug-
gested by other authors as well [5,7,51]. However, for
small tumor cords (radius ≈ 50
μ
m) cell kill is much
greater throughout the tumor cord, and overall mortality
approaches 100% for a cumulative dose of 525 mg/m
2
.
There are several important limitations to the model.
While I have found that elevated IFP is not a major barrier
to transcapillary DOX transport, elevated tumor IFP can
cause fluid to flow out of the tumor and leads to washout
of cytotoxic drugs. This has not been taken into account in
this model, but has been studied previously with mathe-
matical models by Baxter and Jain [9-11]. There are also
several active metabolites of doxorubicin that have not
been modeled. They have less cytotoxic activity than DOX
[52], and total plasma exposure is less for the metabolites
than for DOX itself [22]. Therefore, disregarding the
metabolites of DOX is a reasonable first approximation,
but they may still play some role in determining optimal
infusions. The distribution of oxygen or other nutrients
from the tumor capillary and the role of these factors in
mediating cell density and regrowth following treatment
can and should be incorporated into the model, as in the
work by Bertuzzi et al. [13].
This model framework has potential for expansion. Dif-
ferent anti-tumor agents could easily be considered by
incorporating other existing pharmacokinetic models (see
[4,53]), and the efficacy of different combination treat-
ments could be easily evaluated. This tumor cord geome-
try can also be coupled to complex, multi-organ system
pharmacokinetic models, such as the model for doxoru-
bicin developed by Harris and Gross [54]. Finally, the
tumor cord microarchitecture could be used in a mode-
ling framework where a whole tumor is viewed as an
aggregation of tumor cords. Tumors are heterogeneous,
and the parameters describing these tumor cords are
expected to vary depending on location. Therefore, deliv-
ery to multiple cords described by different parameters
could be simulated and the results aggregated to predict
overall response to therapy.
Competing interests
The authors declare that they have no competing interests.
Acknowledgements
I would like to express my gratitude to the two anonymous reviewers,
whose many thoughtful suggestions and helpful criticisms greatly improved
this work. This research is partially supported by the NSF grant DMS-
0436341 and the grant DMS/NIGMS-0342388 jointly funded by NIH and
NSF.
References
1. Outomuro D, Grana DR, Azzato F, Milei J: Adriamycin-induced
myocardial toxicity: New solutions for an old problem? Int J
Cardiol 2007, 117:6-15.
2. Gewirtz DA: A critical evaluation of the mechanisms of action
proposed for the antitumor effects of the anthracycline anti-
biotics adriamycin and daunorubicin. Biochem Pharmacol 1999,
57:727-741.
3. El-Kareh AW, Secomb TW: A Mathematical Model for Compar-
ison of Bolus Injection, Continuous Infusion, and Liposomal
Delivery of Doxorubicin to Tumor Cells. Neoplasia 2000,
2:325-338.
Theoretical Biology and Medical Modelling 2009, 6:16 />Page 19 of 20
(page number not for citation purposes)
4. El-Kareh AW, Secomb TW: Two-mechanism peak concentra-
tion model for cellular pharmacodynamics of Doxorubicin.
Neoplasia 2005, 7:705-713.
5. Minchinton AI, Tannock IF: Drug penetration in solid tumours.
Nat Rev Cancer 2006, 6:583-592.
6. Legha SS, Benjamin RS, Mackay B, Ewer M, Wallace S, Valdivieso M,
Rasmussen SL, Blumenschein GR, Freireich EJ: Reduction of doxo-
rubicin cardiotoxicity by prolonged continuous intravenous
infusion. Ann Intern Med 1982, 96:133-139.
7. Primeau AJ, Rendon A, Hedley D, Lilge L, Tannock IF: The Distribu-
tion of the Anticancer Drug Doxorubicin in Relation to
Blood Vessels in Solid Tumors. Clin Cancer Res 2005,
11:8782-8788.
8. Pozrikidis C, Farrow DA: A model of fluid flow in solid tumors.
Ann Biomed Eng 2003, 31:181-94.
9. Baxter LT, Jain RK: Transport of fluid and macromolecules in
tumors. I. Role of interstitial pressure and convection. Micro-
vasc Res 1989, 37:77-104.
10. Baxter LT, Jain RK: Transport of fluid and macromolecules in
tumors. II. Role of heterogeneous perfusion and lymphatics.
Microvasc Res 1990, 40:246-63.
11. Baxter LT, Jain RK: Transport of fluid and macromolecules in
tumors. III. Role of binding and metabolism. Microvasc Res
1991, 41:5-23.
12. Wijeratne NS, Hoo KA: Understanding the role of the tumour
vasculature in the transport of drugs to solid cancer
tumours. Cell Prolif 2007, 40:283-301.
13. Bertuzzi A, D'Onofrio A, Fasano A, Gandolfi A: Regression and
Regrowth of Tumour Cords Following Single-Dose Antican-
cer Treatment. Bull Math Biol 2003, 65:903-931.
14. Jackson TL, Byrne HM: A mathematical model to study the
effects of drug resistance and vasculature on the response of
solid tumors to chemotherapy. Math Biosci 2000, 164:17-38.
15. El-Kareh AW, Secomb TW: A theoretical model for intraperito-
neal delivery of cisplatin and the effect of hyperthermia on
drug penetration distance. Neoplasia 2004, 6:117-127.
16. Jackson TL: Intracellular Accumulation and Mechanism of
Action of Doxorubicin in a Spatio-temporal Tumor Model. J
Theor Biol 2003, 220:201-213.
17. Ribba B, Marron K, Agur Z, Alarcón T, Maini PK: A mathematical
model of Doxorubicin treatment efficacy for non-Hodgkin's
lymphoma: investigation of the current protocol through
theoretical modelling results. Bull Math Biol 2005, 67:79-99.
18. Sinek JP, Sanga S, Zheng X, Frieboes HB, Ferrari M, Cristini V: Pre-
dicting drug pharmacokinetics and effect in vascularized
tumors using computer simulation. J Math Biol 2009,
58:485-510.
19. Thalhauser CJ, Sankar T, Preul MC, Kuang Y: Explicit separation of
growth and motility in a new tumor cord model. Bull Math Biol
2009, 71:585-601.
20. Robert J, Illiadis A, Hoerni B, Cano JP, Durand M, Lagarde C: Phar-
macokinetics of adriamycin in patients with breast cancer:
correlation between pharmacokinetic parameters and clini-
cal short-term response. Eur J Cancer Clin Oncol 1982, 18:739-45.
21. Jain RK: Transport of molecules across tumor vasculature.
Cancer Metastasis Rev 1987, 6:559-593.
22. Greene RF, Collins JM, Jenkins JF, Speyer JL, Myers CE: Plasma
pharmacokinetics of adriamycin and adriamycinol: implica-
tions for the design of in vitro experiments and treatment
protocols. Cancer Res 1983, 43:3417-21.
23. Kerr DJ, Kerr AM, Freshney IR, Kaye SB: Comparative intracellu-
lar uptake of adriamycin and 4'-deoxydoxorubicin by nons-
mall cell lung tumor cells in culture and its relationship to
cell survival. Biochem Pharmacol 1986, 35:2817-2823.
24. Eksborg S, Strandler HS, Edsmyr F, Näslund I, Tahvanainen P: Phar-
macokinetic study of i.v. infusions of adriamycin. Eur J Clin
Pharmacol 1985, 28:205-12.
25. Skovsgaard T:
Carrier-mediated transport of daunorubicin,
adriamycin, and rubidazone in Ehrlich ascites tumour cells.
Biochem Pharmacol 1978, 27:1221-1227.
26. Dalmark M, Storm HH: A Fickian diffusion transport process
with features of transport catalysis. Doxorubicin transport in
human red blood cells. J Gen Physiol 1981, 78:349-364.
27. Jain RK: Delivery of molecular and cellular medicine to solid
tumors. Adv Drug Deliv Rev 2001, 46:149-168.
28. Less JR, Skalak TC, Sevick EM, Jain RK: Microvascular Architec-
ture in a Mammary Carcinoma: Branching Patterns and Ves-
sel Dimensions. Cancer Res 1991, 51:265-273.
29. Tufto I, Rofstad EK: Interstitial Fluid Pressure and Capillary
Diameter Distribution in Human Melanoma Xenografts.
Microvasc Res 1999, 58:205-214.
30. Gerlowski LE, Jain RK: Microvascular permeability of normal
and neoplastic tissues. Microvasc Res 1986, 31:288-305.
31. Hilmas DE, Gillette EL: Morphometric analyses of the microvas-
culature of tumors during growth and after x-irradiation.
Cancer 1974, 33:103-10.
32. Moore JV, Hasleton PS, Buckley CH: Tumour cords in 52 human
bronchial and cervical squamous cell carcinomas: inferences
for their cellular kinetics and radiobiology. Br J Cancer 1985,
51:407-413.
33. Nugent LJ, Jain RK: Extravascular diffusion in normal and neo-
plastic tissues. Cancer Res 1984, 44:238-44.
34. Boucher Y, Jain RK: Microvascular pressure is the principal
driving force for interstitial hypertension in solid tumors:
implications for vascular collapse. Cancer Res 1992, 52:5110-4.
35. Wiig H, Tveit E, Hultborn R, Reed RK, Weiss L: Interstitial fluid
pressure in DMBA-induced rat mammary tumours. Scand J
Clin Lab Invest 1982, 42:159-164.
36. Stohrer M, Boucher Y, Stangassinger M, Jain RK:
Oncotic pressure
in solid tumors is elevated. Cancer Res 2000, 60:4251-5.
37. Wolf MB, Watson PD, Scott DR 2nd: Integral-mass balance
method for determination of solvent drag reflection coeffi-
cient. Am J Physiol 1987, 253:H194-204.
38. Parker JC, Parker RE, Granger DN, Taylor AE: Vascular permea-
bility and transvascular fluid and protein transport in the dog
lung. Circ Res 1981, 48:549-61.
39. Perl W, Chowdhury P, Chinard FP: Reflection coefficients of dog
lung endothelium to small hydrophilic solutes. Am J Physiol
1975, 228:797-809.
40. Sevick EM, Jain RK: Measurement of capillary filtration coeffi-
cient in a solid tumor. Cancer Res 1991, 51:1352-5.
41. Wu NZ, Klitzman B, Rosner G, Needham D, Dewhirst MW: Meas-
urement of material extravasation in microvascular net-
works using fluorescence video-microscopy. Microvasc Res
1993, 46:231-253.
42. Curry FE, Huxley VH, Adamson RH: Permeability of single capil-
laries to intermediate-sized colored solutes. Am J Physiol 1983,
245:H495-505.
43. Renkin EM: Multiple pathways of capillary permeability. Circ
Res 1977, 41:735-43.
44. Swabb EA, Wei J, Cullino PM: Diffusion and Convection in Nor-
mal and Neoplastic Tissues. Cancer Res 1974, 34:2814-2822.
45. McLennan IJ, Lenkinski RE, Yanuka Y: A nuclear magnetic reso-
nance study of the self-association of adriamycin and dauno-
mycin in aqueous solution. Can J Chem 1985, 63:1233-1238.
46. Chary SR, Jain RK: Direct measurement of interstitial convec-
tion and diffusion of albumin in normal and neoplastic tissues
by fluorescence photobleaching. Proc Natl Acad Sci USA 1989,
86:5385-9.
47. Wiig H, Gyenge CC, Tenstad O: The interstitial distribution of
macromolecules in rat tumours is influenced by the nega-
tively charged matrix components. J Physiol 2005, 567:557-67.
48. Jain RK: Normalization of Tumor Vasculature: An Emerging
Concept in Antiangiogenic Therapy. Science 2005, 307:58-62.
49. Casper ES, Gaynor JJ, Hajdu SI, Magill GB, Tan C, Friedrich C, Brennan
MF: A prospective randomized trial of adjuvant chemother-
apy with bolus versus continuous infusion of doxorubicin in
patients with high-grade extremity soft tissue sarcoma and
an analysis of prognostic factors. Cancer 1991, 68:1221-1229.
50. Hortobagyi GN, Frye D, Buzdar AU, Ewer MS, Fraschini G, Hug V,
Ames F, Montague E, Carrasco CH, Mackay B, Benjamin RS:
Decreased cardiac toxicity of doxorubicin administered by
continuous intravenous infusion in combination chemother-
apy for metastatic breast carcinoma. Cancer 1989, 63:37-45.
51. Tannock IF, Lee CM, Tunggal JK, Cowan DS, Egorin MJ: Limited
Penetration of Anticancer Drugs through Tumor Tissue: A
Potential Cause of Resistance of Solid Tumors to Chemo-
therapy. Clin Cancer Res 2002, 8:878-884.
52. Ozols RF, Willson JK, Weltz MD, Grotzinger KR, Myers CE, Young
RC: Inhibition of human ovarian cancer colony formation by
Publish with Bio Med Central and every
scientist can read your work free of charge
"BioMed Central will be the most significant development for
disseminating the results of biomedical research in our lifetime."
Sir Paul Nurse, Cancer Research UK
Your research papers will be:
available free of charge to the entire biomedical community
peer reviewed and published immediately upon acceptance
cited in PubMed and archived on PubMed Central
yours — you keep the copyright
Submit your manuscript here:
/>BioMedcentral
Theoretical Biology and Medical Modelling 2009, 6:16 />Page 20 of 20
(page number not for citation purposes)
adriamycin and its major metabolites. Cancer Res 1980,
40:4109-12.
53. El-Kareh AW, Secomb TW: A mathematical model for cisplatin
cellular pharmacodynamics. Neoplasia 2003, 5:161-169.
54. Harris PA, Gross JF: Preliminary pharmacokinetic model for
adriamycin (NSC-123127). Cancer Chemother Rep 1975,
59:819-25.