Báo cáo y học: "Pros and cons of estimating the reproduction number from early epidemic growth rate of influenza A (H1N1) 2009" potx
Bạn đang xem bản rút gọn của tài liệu. Xem và tải ngay bản đầy đủ của tài liệu tại đây (907.79 KB, 13 trang )
COMM E N T ARY Open Access
Pros and cons of estimating the reproduction
number from early epidemic growth rate of
influenza A (H1N1) 2009
Hiroshi Nishiura
1,2*
, Gerardo Chowell
3,4
, Muntaser Safan
5
, Carlos Castillo-Chavez
3,6
* Correspondence:
1
PRESTO, Japan Science and
Technology Agency, Honcho 4-1-8,
Kawaguchi, Saitama, 332-0012,
Japan
Abstract
Background: In many parts of the world, the exponential growth rate of infections
during the initial epidemic phase has been used to make statistical inferences on the
reproduction number, R, a summary measure of the transmission potential for the
novel influenza A (H1N1) 2009. The growth rate at the initial stage of the epidemic
in Japan led to estimates for R in the range 2.0 to 2.6, capturing the intensity of the
initial outbreak among school-age children in May 2009.
Methods: An updated estimate of R that takes into account the epidemic data from
29 May to 14 July is provided. An age-structured renewal process is employed to
capture the age-dependent transmission dynamics, jointly estimating the
reproduction number, the age-dependent susceptibility and the relative contribution
of imported cases to secondary transmission. Pitfalls in estimating epidemic growth
rates are identified and used for scrutinizing and re-assessing the results of our earlier
estimate of R.
Results: Maximum likelihood estimates of R using the data from 29 May to 14 July
ranged from 1.21 to 1.35. The next-generation matrix, based on our age-structured
model, predicts that only 17.5% of the population will experience infection by the
end of the first pandemic wave. Our earlier estimate of R did not fully capture the
population-wide epidemic in quantifying the next-generation matrix from the
estimated growth rate during the initial stage of the pandemic in Japan.
Conclusions: In order to quantify R from the growth rate of cases, it is essential that
the selected model captures the underlying transmi ssion dynamics embedded in the
data. Exploring additional epidemiological information will be useful for assessing the
temporal dynamics. Although the simple concept of R is more easily grasped by the
general public than that of the next-generation matrix, the matrix incorporating
detailed information (e.g., age-specificity) is essential for reducing the levels of
uncertainty in predictions and for assisting public health policymaking. Model-based
prediction and policymaking are best described by sharing fundamental notions of
heterogeneous risks of infection and death with non-experts to avoid potential
confusion and/or possible misuse of modelling results.
Background
The reproduction number, R, the average number of secondary cases generated by a
typical (or “average”) single primary case, of influenza A (H1N1) 2009 is a summary
measure of the transmission potential in the population of interest. It has been
Nishiura et al. Theoretical Biology and Medical Modelling 2010, 7:1
/>© 2010 Nishiura et al; licensee BioMed Central Ltd. This is an Open Access article distribute d under the terms of the Creative Commons
Attribution License ( which perm its unrestricted use, distribution, and reproduction in
any medium, provided the original work is properly cited.
estimated using the early epidemic growth data in d ifferent locations across the world
[1-12]. The estimations have been based primarily on models that include one or a
limited number of aspects of heterogeneous transmission. The scientific community
has been attracted to R because it provides a first aggregated measure of the overall
transmissibility of an emerging infection [13]. Further, the estimate of R,basedon
homogeneously or nearly homogeneously mixing population models that by design
ignore most individual differences, is not only used to assess the initial growth of an
epidemic but also the extent to which the population will ex perience infection by the
end of a first pandemic wave [14,15]. Except for a unique study estimating R using a
data set of int ernational sprea d [7], the exponential growth rate, r, of cases during the
initial epidemic phase has been investigated using a simple procedure that involves
translating r into R through the use of the estimator R =1/M(-r)whereM(-r)isthe
moment-generating function of the generation time distribution, given the growth rate
r [16]. N aturally, the higher the growth rate r of the number of cases, the larger the
estimate of R.
The majority of R estimates for this ongoing pandemic have ranged from 1.1-1.8 [17]
while our estimate of R in Japan was in the range of 2.0-2.6 under the assumption of a
mean generation time of 1.9 days through May 2009 [5]. The most plausible reason for
this estimate, as noted in our earlier study [5], involved the role of initial conditions as
the very early growth was driven by the high contact rates that are common to school
settings [17,18]. In addition to the p henomenological explanation, it is important to
assess whether or not the methodology used to estimate R was adequate. We do this
here using data that go beyond those used in our estimation of R for the earlier epi-
demic period of May 2009 in Japan. Here we provide an updated estimate of R for the
novel influenza A (H1 N1) 2009 in Japan, s ummarising the relevant methodological
issues in estimating R from the growth rate of cases and initiating a dialogue on how
estimates of the transmission potential should be shared with non-experts, including
the general public.
Discussion
The epidemic data in Japan
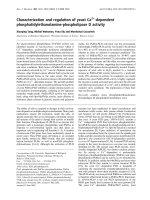
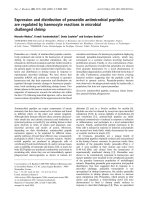
Figure 1 shows the epidemic curve of influenza A (H1N1) 2009 for Japan from May to
July 2009. Starting with the illness onset of an index case on 5 May, 4986 confirmed
cases, all diagnosed by means of RT-PCR, were reported to the government during this
period. On 22 July, the Ministry of Health, Labour and Welfare of Japan decided not to
mandate its local health sectors to notify all the confirmed cases, and thereafter the
local sectors gradually ceased counting all the cases. The first pandemic wave in Japan
continued to grow steadily thereafter hitting the first peak in November [19].
Since our original data indicate that the 97.5 percentile point of the reporting delay
distribution (i.e., the time from illness onset t o notification) is 8 days, we analyse a
total of 3480 cases that developed t he disease on or before 14 July. Figure 1A shows
the temporal distributio n stratified by age-group of all identified cases. Of the 3480
cases, 67.0% were among individuals 19 years of age or less. The population of those
aged from 20-39 years accounted for 24.2% of the total, and the remaining (older
adult) cases accounte d for only 8.8%. The contributions from imported cases to the
early epidemic growth in this island nation, in addition to the local (indigenous)
Nishiura et al. Theoretical Biology and Medical Modelling 2010, 7:1
/>Page 2 of 13
transmissions, are also critical (Figure 1B). Of the 3840 confirmed cases, 694 (19.9%)
had a history of o verseas travel within 10 days preceding the onset of illness, and we
refer to them as imported cases in the present study.
Growth rates of two different phases
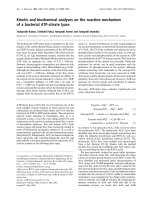
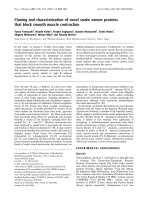
We proceed to compare two different growth rates (Figure 2) in order to explore the
patterns that led to our past R estimates for Japan in [5]. The growth rates of cases in
the very initial phase (i.e., from 5 to 17 May), which corresponds to the period exam-
ined in ou r earlier study [5], and those that followed the generation of secondary cases
caused by school clusters (i.e., from 29 May to 14 July) are compared. Over these peri-
ods we observe that the proportion of cases attributed to the 0-19 age grouping
decreased from 83.0% to 67.0%.
We model the expected value of the incidence of illness onset at calendar time t as E
(c(t)) = kexp(r(t-τ)) where k is a constant, r is the growth rate of the corresponding
period, and τ is the starting time point of exponential growth (assumed as 5 May and
29 May , res pe c t i ve l y ). Minimizing the sum of squares between the observed data and
expectation, r is estimated as 0.37 and 0.08 per day, respectively, for the former and latter
periods. The estimate for the former period is smaller than that reported in our earlier
study in May (i.e., 0.47 per day) [5], because of our use of refined dates of onset and the
use of a simpler statistical method in the present study. The estimates of the exponential
growth rates differ by almost a factor of five (i.e ., 0.37/0.08) in the two windows in time,
Figure 1 Temporal distribution of confirmed cases of influenza A (H1N1) 2009 virus infection in
Japan from May to July 2009 (n = 3,480). All the confirmed cases were diagnosed by RT-PCR. The
horizontal axis represents the date of onset. Cases are stratified by (A) age and (B) travel history. Here
“cases with travel history” are associated with overseas travel within 10 days preceding onset of illness and
those with such a history are referred to as imported cases in our analysis.
Nishiura et al. Theoretical Biology and Medical Modelling 2010, 7:1
/>Page 3 of 13
indicating that the cases in the former period experienced a 1.3 times greater daily growth
rate (i.e., exp(0.37)/exp(0.08)) than those in the latter period. A glance at the age-specific
data show that the disease spread from an initial cluster that mix primarily in an assorta-
tive manner into the “general” Japanese population is the most likely key to this dramatic
difference. Since the latter period reflects the early population-wide spread of H1N1 invol-
ving the entire Japanese community, R for this period is estimated using the following
methodology.
Modelling methods
We employ an age-structured model to derive an estimate for R since the transmission
of influenza A (H1N1) 2009 is known to differ greatly among age groups [1,3,5,9].
Spatial heterogeneity, s ocial heterogeneity (e.g. differing patterns of transmission
between household-, school- and workplace-settings), or potential changes in behaviour
are mostly ignored.
The square matrix with generic entry R
ij
, the average number of secondary cases in
age-group i generated by a single primary case in age-group j, is referred to as the next-
generation matrix [20]. The reproduction number R is defined as the dominant eigenva-
lue of the next-generation matrix [21]. Since the observed data come as daily reports, we
consider the incidence of indigenous, c
i, t
, and imported cases, b
i, t
, of age-gr oup i devel-
oping the disease on day t in discre te time. Using R
ij
, the multi-type renewal process,
yielding the conditional expectation of indigenous cases on day t, is written as
E( , , , , , , , )
(
,,, , ,, ,
,
cc c c bb b
Rc
it j j jt j j jt
ij j t
01 101 1−−
−
=
ssjtss
sj
bg+
−
=
∞
∑∑
,
)
1
(1)
where a is the relative contribut ion of import ed cases to secondary transmission as
compared to indigeno us cases (0 ≤ a ≤ 1) and g
s
is the discretized density function of
the generation time of length s days. We introduce the relative reduction a because
the physical movements of those with a history of overseas travel were partly restricted
during the early epidemic phase in Japan, reducing the number of secondary
Figure 2 Simple extrapolation of the exponential growth of cases. Two exponential fits are compared
with the observed number of confirmed cases. Exponential fit 1 employs the data set from 5 May to 17
May during which clusters of cases in a few high schools fuelled the epidemic. Exponential fit 2 draws the
best fit to the data from 29 May to 14 July representing the spread of influenza into the wider population.
The growth rates for fits 1 and 2 are estimated at 0.37 and 0.08 per day, respectively.
Nishiura et al. Theoretical Biology and Medical Modelling 2010, 7:1
/>Page 4 of 13
transmissions. Also, the imported cases most often developed the disease shortly before
or after entering Japan. The density of the generation time, g
s
, is calculated as follows:
gGsGs
s
=−−() ( )1
(2)
where G(s) is the cumulative distribution function of the generation time distribution,
which we assume to be known and to follow a gamma distributi on. In the early model-
ling studies, the mean generation time was estimated at 1.9 days [1], 2.6-3.2 days [3] and
2.5 days [4]. From contact tracing data in the Netherlands, the mean and standard devia-
tion (SD) were estimated at 2.7 and 1. 1 days, respectively [22]. We adopt 2.7 days as the
mean and fix the coefficient of variation to 40.7% as calculated from the Dutch study.
We partly address issues of uncertainty by measuring the sensitivity of R to differing
mean generation times ranging from 2.1 to 3.3 days.
R
ij
is modelled as
RRsm
ij i ij
=
(3)
where R is the reproduction number to be estimated (i.e., scalar quantity), s
i
measur es
the susceptibility of age-group i given a contact, and m
ij
is the frequency of contact
made by an individual in age-group j wi th that in i (which is assumed known and is
extracted from a contact survey in the Netherlands [23]); let S and M be square matrices.
S is the diagonal matrix in which the diagonal elements (i, i)ares
i
and the entries out-
side the main diagonal are all zero. The (i, j)elementofM is m
ij
with which we adopt
frequency-dependen t assumption, and we ignore more detailed contact including the
“type ” and “duration” [24]. We normalize the product SM (i.e., the dominant eigenvalue
of SM i s set to 1) so that R scales the next-generation matrix. We aggregate the popula-
tion into six discrete age groups (0-5, 6-12, 13-19, 20-39, 40-59 year s and 60 and older)
in order to be able to adhere to the precision of the contact survey [23]; consequently,
the next-generation matrix has dimensions 6 × 6 (36 elements).
We estimate eight parameters (i.e ., R, a and s
i
for six age-groups) using the renew al
equation (1). We assume that variations in secondary transmissions are appropriately
captured by a Poisson distribution [25]. The conditional likelihood of observing c
i, t
on
day t given the series of foregoing indigenous cases c
j, 0
, c
j, 1
, ,c
j, t-1
and of imported
cases b
j, 0
, b
j, 1
, , b
j, t-1
, respectively, for all age-groups j, is given by
Lc c c c b b b
c
it
c
i
it j j jt j j jt
( , , , , , , , )
E(
,
)
,,, , ,, ,01 101 1−−
=
,,
exp( E(
,
))
,
!
t
c
it
c
it
−
(4)
where E(c
i, t
) is the conditional expectation (i.e., the right-hand side of (1)) and c
i, t
is
the observed number of cases of age-group i on day t. Maximum likelihood estimates
of the parameters are obtained by minimizing the negative logarithm of (4) with the
95% confidence intervals (CI) derived from profile likelihood.
Modelling results
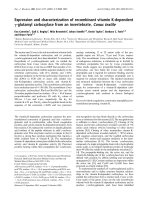
Figure 3 compares the observed and predicted numbers of confirmed cases. The condi-
tional expectation approximately captures the observed age-specific patterns of inci-
dence. The maximum likelihood estimate of the next-generation matrix, R
ij
,is
Nishiura et al. Theoretical Biology and Medical Modelling 2010, 7:1
/>Page 5 of 13
K =
051 009 005 010 005 003
011 095 011 012 007 004
008 015
1104 023 017 007
017 017 025 037 024 012
003 004 007 009 0
.
12 0 06
000 000 001 001 001 002
⎛
⎝
⎜
⎜
⎜
⎜
⎜
⎜
⎜
⎜
⎞
⎠
⎟
⎟
⎟
⎟
⎟
⎟
⎟
⎟
(5)
Those aged from 13-19 years appear to be able to maintain the transmission by them -
selves (i.e., meeting the definition of maintenance host, R
33
> 1 [26]). Nevertheless,
age groups 1 and 2, children aged from 0-12 years, appear incapable of maintaining
transmission (i.e., the dominant eigenvalue of the 2 × 2 matrix involving transmissions
among and between those aged from 0-5 and 6-12 years is less than 1). The maximum
likelihood estimate of R is 1.28 (95% CI: 1.23, 1.33). The relative contribution of
imported cases to secondary transmission, a, is estimated at 0.15 (standard error = 0.14).
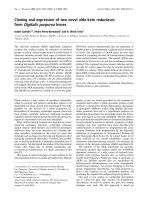
Figure 4A examines the sensitivity of R to different mean generation times. If we
adopt 2.1 days as the mean, R is estimated at 1.21 (95% CI: 1.16, 1.26). If we adopt 3.3
days, R is 1.35 (95% CI: 1.30, 1.41). Figure 4B captures relative susceptibilities, using
those aged from 20-39 years to define the susceptibility baseline. The age-groups 0-5,
6-12 and 13-19 years appear to be 2.77 (95% CI: 2.35, 3.24), 2.67 (95% CI: 2.41, 2.95)
and 2.76 (95% CI: 2.55, 2.98) times more susceptible than adults aged 20-39 years. On
the other hand, those aged from 40-59 years and 60 years and older are 0.56 (95% CI:
0.45, 0.68) and 0.17 (95% CI: 0.09, 0.28) times as susceptible than those aged 20-39
years. It should be noted that the qualitative pattern of age-dependent susceptibility
agrees well with the results of immunological studies [27,28] and a hypothesis about
its underlying mechanisms [29].
Limitation of the growth rate r
As expected from the greatly differing exponential growth rates between early May and
from 29 May to 14 July (Figure 2), the reproduction number for the latter period, ran-
ging from 1.21 to 1.35, is much smaller than our previously reported estimate for the
former time period when the transmission was mainly confined to school settings [5].
Figure 3 Model prediction. Observed (dots) and predicted (lines) age-specific numbers of confirmed
cases as a function of onset time are compared. The prediction on day t was conditioned on observations
from days 0 to (t-1).
Nishiura et al. Theoretical Biology and Medical Modelling 2010, 7:1
/>Page 6 of 13
The estimate in the latter period is consistent with the estimates of R in other coun-
tries [14,16]. The situation is not straightforward, however, as the estimation was car-
ried out using confirmed cases (which may be biased towards severe cases). Further, it
should be noted that various interventions, including reactive school closure and con-
tact tracing, were instituted during the whole period of observation, so the R value for
the latter period and espe cially the entries R
ij
involving school children might poten-
tially lead to underestimates for R in the present study.
Since the small outbreak in the former time period was restricted to a limited num-
ber of schools and the contacts made by t he students in Osaka and Kobe (and as
Japan was unique in successfully “containing” the local school-based outbreak before
actual pandemic overshoot), the depletion of susceptibles in May and undiagnosed
cases are unlikely to have played a significant role in our estimates of a smaller R for
the epidemic in the latter transmission period, which saw the pandemic takeover.
Rather, as we discussed above, the local networks of interactions (i.e., transmission
within networks that connect to other networks in time), and consequently the initi al
conditions (i.e., whic h network gets infected first), played a key role in our estimates
for the i nitial outbreak growth. The earlier estimates of R captured the initial role in
the generation of secondary cases from schools where the frequency of transmission
among school children greatly exceeded those of the community (and the “type” of
their contact is perhaps more dense (or close) than those in the community [24,30]).
Although the sensi tivity of R to differi ng mean generation times was examined within
a relatively narrow range, this aspect could not account for the high R estimates
obtained in Japan [5].
One important conclusion is drawn from the present study. The lessons learnt from
our estimat ion over the two wi ndows in time has forced us to revisit the ro le of using
summary statistics to characterize transmission potential from the data generated by
heterogeneous contact patterns. As a network expands, the structure of networks
involved in transmission changes, and consequently the summary statistics of cases,
also change in time [13]. The initial summary statistics therefore depend in a rather
critical way on the initial conditions (i.e., where and how the disease was introduced)
[31], which is not always captured well by homogeneous mixing models. Since the very
early stage of this epidemic alone involves primarily a few specific sub-groups of the
Figure 4 Parameter estimates and sensitivity analysis. Panel A examines the sensitivity of the
reproduction number to different mean lengths of the generation time ranging from 2.1 to 3.3 days. Panel
B shows the estimate of the age-specific relative susceptibility. The expected value of susceptibility for
those aged 20-39 years was taken as the reference. In both panels, the whiskers extend to the upper and
lower 95% confidence intervals based on the profile likelihood.
Nishiura et al. Theoretical Biology and Medical Modelling 2010, 7:1
/>Page 7 of 13
population, it is difficult to quantify the next-generation matrix fully and estimate a
reproduction number that adequately captures the transmission potential for the entire
population. Whereas the next-generation matrix includes representative levels of popu-
lation heterogeneity, the infected individuals during the very initial epidemic stage
were clearly not representative of the entire population of interest. The use of the
next-generation matrix involves the introduction of a “typical” infectious individual
into the population, but such an individual cannot be properly characterized if the
matrix involves unavoidable approximations (due to limited availability of structured
data) when an outbre ak happens to be mostly confined to a single cluster whose aver-
age individual is “atypical” of the entire population.
Thepreviouslyreportedexpectedvalue,R = 2.3, for the May outbreak might well
approximate the intensity of transmissions in schools (and indeed, is consistent with
the estimate in school settings in the USA [3]). This is another example of what is
often referred as core group effects in the epidemiological literature [32]. Naturally, the
use of the empirical data from school clusters does not provide sufficient information
to carry out precise estimation of the age-dependent next-generation matrix, so the
resulting dominant eigenvalue in the earlier study should not be regarded as R but
rather as a measure of transmissibility conditi oned on the initial conditions. The need
for the collection of a dditional data may be critical when age- specific transmission is
highly assortative and/or when age-specific susceptibility is highly heterogeneous (as is
the case for influenza A (H1N1) 2009). Summary statistics based on highly aggregated
populations are in general not helpful in identify ing the pr essure points of a heteroge-
neous network, which is essential in the identification and assessment of the most
effective (e.g., age-specific) intervention policies. In other words, the finer details of
epidemic data (i.e., epidemiolo gical informati on at a local level, e.g., ac tive surveillance
of cases) need to be taken into account in the modelling. Not only school outbreaks,
but also other social factors and settings (e.g. transportation, hospital settings and mass
gatherings) can play enhancing or reducing transmission roles.
In addition to the challenges posed by our need to average over different levels of het-
erogeneous mixing, quantification of the growth rates involves the additional challenges
that come from underreporting, notably ascertainment of cases and reporting bias.
Further, imputation of onset dates for missing data is sometimes required, and moreover,
the time-varying reporting frequency may even call for naïve adjustment of the growth
rate of confirmed cases by the growth rate of hospitalized (or other severe portions of)
cases [4]. The data set we examined in Japan involved contact tracing efforts at all local
levels, so the growth rate of confirmed symptomatic cases is thought to have captured
the actual increase in infecti on approp riately. Nevertheless, achieving precise estimation
of incidence for this mild disease remains an open question, particularly if the proportion
of asymptomatic infections among the total of infected individuals is high.
Is the epidemic growth rate useless?
Despite our earlier suggestion of the “biased” estimate of the next- generation matrix, it
should be noted that we do not argue that the early growth rate is no longer be used
but rather that the context of its use when appropriate should be clarified. The growth
rate of cases is, as with most inferences from statistical modelling, context dependent
(e.g., presence of initially infected cluster). Given the precise estimate of the generation
Nishiura et al. Theoretical Biology and Medical Modelling 2010, 7:1
/>Page 8 of 13
time distribution, the expon ential growth rate is appropriately translated to the repro-
duction number for a single population [16]. This is also the case, for example, for the
multi-type epidemic as outlined below. Discarding imported cases, the continuous-time
version of our renewal process (1) is written as
ct R ct g d
iijj
j
() ( ) ( ) .=−
∞
∫
∑
0
(6)
Equation (6) a ssumes that the generation time is shared among sub-populations. If
we further assume that the intrinsic growth rate r is identical among sub-populations
then the incidence c
i
(t) can be written as ([33]):
ct k rt
ii
( ) exp( )=
(7)
where k is constant and ω
i
is the leading eigenvector of the next-generation matrix.
Replacing the right-hand side of (7) in (6) leads to
iijj
j
Rrgd=−
∞
∫
∑
exp( ) ( ) .
0
(8)
That is,
=−
∞
∫
Rrgdexp( ) ( )
0
(9)
and thus the estimator of R is given by 1/M(-r) (see Background) [16]. Hence, and
not surprisingly, as long as the intrinsic growth rate and generation time are t he same
among sub-populations, the estimator of R for the multi-type epidemic model can be
identical to that of single-host epidemic model [34].
The incorporation of additional levels of detail into the basic model used to generate
growth esti mates depends on the model’s ability to capture the underlying transmission
dynamics in the data and the purposes of the research questions or public health policy-
making goals. These issues are particularly relevant when a clustering of cases is observed
[35,36]; as we saw in Japan, clusters of cases caused a delay in accurately estimating the
true population average of transmissibilit y. The epidemic growth rate remains a useful
quantity for estimating the transmission potential at the population level in the absence of
obvious clusters of cases and as long as the approximately modelled transmission suffi-
ciently captures the actual heterogeneity. We start from the premise that the use of hetero-
geneous mixing models is essential in the assessment of critical theoretical claims and
policymaking decisions. Hence, it is worth noticing that in this context, technical questions
remain regarding the use and applicability of the exponentia l growth rate. They include
(i) the development of methods for estimating the generation time distribution and (ii) the
determination of an appropriate length of the exponential growth period [37-39].
How should we communicate the estimate?
Without doubt R is the most widely used measurement of transmissibility and there
are many good reasons why this is so. It has a simple formula and it is the simplest
and most interpretable quantity to communicate to non-experts. Its limitations become
Nishiura et al. Theoretical Biology and Medical Modelling 2010, 7:1
/>Page 9 of 13
evident when specific decisions must be made including, for example, who should be
vaccinated first. Precise estimates of the next-generation matrix capture detailed epi-
demic dynamics that are key to answering questions like the one posed, but its estima-
tion requires age- and risk-group structured data and a clear identification of the
correct exponential growth time w indow. In the context of the pandemic from 2009,
gatherin g age-specific transmission dynamics information is of the utmost re levance to
prediction and policymaking. For instance, given that R = 1.28, one may predict the
final size of epidemic, z, the proportion of those who will experience infection by the
end of epidemic, by using the final size equation (based on a homogeneous mixing
model),
zzR=− −1
0
exp( ).
(10)
Iteratively solving (10 ), z is estimated to be 40.3%. Similarly, R =2.3forahomoge-
neously mixing population is translated to z = 86.2%. Nevertheless, if we have the
next-generation matrix, R
ij
, the final size z
i
of host i is written as ([40])
zzR
ijij
j
=− −
∑
1 exp( ).
(11)
Using our estimate in (5), the corresponding z
1
-z
6
are estimated at 16.2, 37.1, 47.7,
29.0, 8.7 and 1.0%, resp ectively. Using the age-specific population size N
i
, the final size
z for the entire population is calculated as the weighted average,
z
z
i
N
i
i
N
j
j
=
∑
∑
.
(12)
Extracting the age-specific population estimate in Japan [41], z is estimated at 17.5%,
not surprisingly much less than predicted by (10), a value that is indeed close to the
actual range of the i mpact of first pandemic wave in Northern Hemisphere countries
[17]. The “real” value of z may be even smaller if we account for additional levels of
heterogeneity in transmission. The repro duction number, R ,fortheentirepopulation
maybeusefulforobtainingaroughestimateofhowmuchvaccineweneed(e.g.,
deciding the total number of vaccines to be manufactured), while R
ij
is far more essen-
tial for structur ing the most effective strategy of vaccination and planning the optimal
prioritization schemes [42,43]. Given that R can also b e calculated from R
ij
, communi-
cating R
ij
rather than R to the general public would be the most informative strategy
of science communicati on for modelling results. When one explains the concept of R
ij
to non-experts, it’s ideal to mention the limitation due to its nature of approximation
because of limitations in structured data in any empirical observation.
The case fatality ratio (CFR), an epidemiological measurement of virulence, would
also benefit from the use of detailed (e.g., age-structured) information. Whereas the
confirmed CFR (cCFR) for the entire population conditioned on confirmed cases has
been estimated at approximately 0.5% during the very early stage of the pandemic
[1,44,45], the symptom atic CFR (sCFR), which is conditioned on symptomatic cases,
laterappearedtobe0.048%[46].TheCFRestimatefortheentirepopulationis
regarded as a summary measure of virulence, so the reduced order of virulence
Nishiura et al. Theoretical Biology and Medical Modelling 2010, 7:1
/>Page 10 of 13
(approximately by a factor of 10) provides not only more accurate information but a
more useful measure for assessing the impact of this pandemic. Nevertheless, knowl-
edge based on additional information would be even more useful. Ideally, we would
like to compare epidemiologically the virulence between different settings (e.g., com-
parison between age groups or countries) and to use this knowledge in the develop-
ment of relevant public health policy. Understanding the heterogeneous risks of death
by age- and risk-groups is critical in the effective design of intervention strategies. In
other words, apart from discussing the changing assessment of the CFR as a whole,
CFR
i
for age-group i is probably more informative than CFR for the entire population.
Conclusions
We analysed the temporal distribution of the influenza A (H 1N1) 2009 epidemic in
Japan from May-July 2009, estimating the reproduction number for the time period
from 29 May to 14 July – a follow-up to our earlier estimates d erived primarily from
data on school outbreaks in May. The updated estimate of R, an average over a wider
spectrum of the Japanese population, rangedfrom1.21to1.35.Ourhigherestimate
reported in [5] was based on a data set that was incapable of quantifying the next-gen-
eration matrix for the whole country from the growth rate of cases in a restricted
school setting alone. The upshot of this analysis is tied to the fact that in regions
where disease transmission is highly heterogeneous the initial conditions will have a
strong effect on the variation in estim ates of the rate of epidemic growth . To quantify
R and R
ij
appropriately from the growth rate of cases, it is essential that the model not
only captures the underlying transmission dynamics behind the empirical data but also
that we have sufficiently structured data for each sub-population to estimate the role
of variability in our estimates. In addition to extending the window in time for devel-
oping accurate population level measurements [39] , it may be useful to examine addi-
tional epidemiological information (e.g., active surveillance of local transmission
patterns and the severe portion of cases including hospital admissions).
Communicating R to non-experts is simpler than R
ij
, but R
ij
contains the information
that is most useful for the development of specific intervention efforts. Developing
sim ple interpretati ons and effective ways of communicating R
ij
(i.e., the average num-
ber of secondary cases in host i generatedbyasingleprimarycaseinhostj)mustbe
pursued. This retrospective study highlights the importance of inco rporating the con-
cept of heterogeneous risks of infection and death in the context of the assessment of
pandemic potential.
List of abbreviations
R: the reproduction number; RT-PCR: Reverse transcription polymerase chain reaction; CI: confidence intervals; SD:
standard deviation; CFR: case fatality ratio.
Acknowledgements
The work of H Nishiura was supported by the JST PRESTO program. The authors are grateful to the editor and the
three reviewers for their useful comments, advices and expediting public ation of this article.
Author details
1
PRESTO, Japan Science and Technology Agency, Honcho 4-1-8, Kawaguchi, Saitama, 332-0012, Japan.
2
Theoretical
Epidemiology, University of Utrecht, Yalelaan 7, Utrecht, 3584CL, The Netherlands.
3
Mathematical and Computational
Modeling Sciences Center, School of Human Evolution and Social Change, Arizona State University, Tempe, AZ, 85282,
USA.
4
Fogarty International Center, National Institutes of Health, Bethesda, MD, 20892, USA.
5
Department of
Mathematics, Faculty of Science, Mansoura University, Mansoura, 35516, Egypt.
6
Santa Fe Institute, Santa Fe, NM,
87501, USA.
Nishiura et al. Theoretical Biology and Medical Modelling 2010, 7:1
/>Page 11 of 13
Authors’ contributions
HN conceived of the study. HN developed methodological ideas, implemented statistical analyses and drafted the
manuscript. GC, MS and CCC revised the model and helped improve the manuscript. All authors read and approved
the final manuscript.
Competing interests
The authors declare that they have no competing interests.
Received: 15 December 2009
Accepted: 7 January 2010 Published: 7 January 2010
References
1. Fraser C, Donnelly CA, Cauchemez S, Hanage WP, Van Kerkhove MD, Hollingsworth TD, Griffin J, Baggaley RF,
Jenkins HE, Lyons EJ, Jombart T, Hinsley WR, Grassly NC, Balloux F, Ghani AC, Ferguson NM, Rambaut A, Pybus OG,
Lopez-Gatell H, Alpuche-Aranda CM, Chapela IB, Zavala EP, Guevara DM, Checchi F, Garcia E, Hugonnet S, Roth C, WHO
Rapid Pandemic Assessment Collaboration: Pandemic potential of a strain of influenza A (H1N1): early findings.
Science 2009, 324:1557-1561.
2. Boëlle PY, Bernillon P, Desenclos JC: A preliminary estimation of the reproduction ratio for new influenza A(H1N1)
from the outbreak in Mexico, March-April 2009. Euro Surveill 2009, 14(19), pii: 19205.
3. Yang Y, Sugimoto JD, Halloran ME, Basta NE, Chao DL, Matrajt L, Potter G, Kenah E, Longini IM Jr: The transmissibility
and control of pandemic influenza A (H1N1) virus. Science 2009, 326:729-733.
4. White LF, Wallinga J, Finelli L, Reed C, Riley S, Lipsitch M, Pagano M: Estimation of the reproductive number and the
serial interval in early phase of the 2009 influenza A/H1N1 pandemic in the USA. Influenza Other Respi Viruses 2009,
3:267-276.
5. Nishiura H, Castillo-Chavez C, Safan M, Chowell G: Transmission potential of the new influenza A(H1N1) virus and its
age-specificity in Japan. Euro Surveill 2009, 14(19), pii: 19205.
6. Nishiura H, Wilson N, Baker MG: Estimating the reproduction number of the novel influenza A virus (H1N1) in a
Southern Hemisphere setting: preliminary estimate in New Zealand. NZMedJ2009, 122:73-77.
7. Balcan D, Hu H, Goncalves B, Bajardi P, Poletto C, Ramasco JJ, Paolotti D, Perra N, Tizzoni M, Broeck Van den W,
Colizza V, Vespignani A: Seasonal transmission potential and activity peaks of the new influenza A(H1N1): a Monte
Carlo likelihood analysis based on human mobility. BMC Med 2009, 7:45.
8. Munayco CV, Gomez J, Laguna-Torres VA, Arrasco J, Kochel TJ, Fiestas V, Garcia J, Perez J, Torres I, Condori F, Nishiura H,
Chowell G: Epidemiological and transmissibility analysis of influenza A(H1N1)v in a southern hemisphere setting:
Peru. Euro Surveill 2009, 14(32), pii: 19299.
9. McBryde E, Bergeri I, van Gemert C, Rotty J, Headley E, Simpson K, Lester R, Hellard M, Fielding J: Early transmission
characteristics of influenza A(H1N1)v in Australia: Victorian state, 16 May - 3 June 2009. Euro Surveill 2009, 14, pii =
19363.
10. de Silva UC, Warachit J, Waicharoen S, Chittaganpitch M: A preliminary analysis of the epidemiology of influenza A
(H1N1)v virus infection in Thailand from early outbreak data, June-July 2009. Euro Surveill 2009, 14, pii = 19292.
11. Pourbohloul B, Ahued A, Davoudi B, Meza R, Meyers LA, Skowronski DM, Villaseñor I, Galván F, Cravioto P, Earn DJ,
Dushoff J, Fisman D, Edmunds WJ, Hupert N, Scarpino SV, Trujillo J, Lutzow M, Morales J, Contreras A, Chávez C,
Patrick DM, Brunham RC: Initial human transmission dynamics of the pandemic (H1N1) 2009 virus in North
America. Influenza Other Respi Viruses 2009, 3:215-222.
12. Tuite AR, Greer AL, Whelan M, Winter AL, Lee B, Yan P, Wu J, Moghadas S, Buckeridge D, Pourbohloul B, Fisman DN:
Estimated epidemiologic parameters and morbidity associated with pandemic H1N1 influenza. CMAJ 2009.
13. Busenberg S, Castillo-Chavez C: A general solution of the problem of mixing of subpopulations and its application
to risk- and age-structured epidemic models for the spread of AIDS. IMA J Math Appl Med Biol 1991, 8:1-29.
14. World Health Organization: Mathematical modelling of the pandemic H1N1 2009. Wkly Epidemiol Rec 2009, 84:341-
348.
15. Brauer F, Feng Z, Castillo-Chavez C: Discrete epidemic models.
Math Biosci Eng 2010, 7:1-15.
16. Wallinga J, Lipsitch M: How generation intervals shape the relationship between growth rates and reproductive
numbers. Proc R Soc Lond Ser B 2007, 274:599-604.
17. World Health Organization: Transmission dynamics and impact of pandemic influenza A (H1N1) 2009 virus. Wkly
Epidemiol Rec 2009, 84:481-484.
18. Mikolajczyk RT, Akmatov MK, Rastin S, Kretzschmar M: Social contacts of school children and the transmission of
respiratory-spread pathogens. Epidemiol Infect 2008, 136:813-822.
19. Ministry of Health, Labor and Welfare, Japan. Influenza A(H1N1). Tokyo: Ministry of Health, Labor and Welfarehttp://
www.mhlw.go.jp/english/topics/influenza_a/index.html, (accessed on 10 December 2009).
20. Diekmann O, Heesterbeek JAP: Mathematical Epidemiology of Infectious Diseases: Model Building, Analysis and
Interpretation Chichester: John Wiley and Son 2000.
21. Diekmann O, Heesterbeek JA, Metz JA: On the definition and the computation of the basic reproduction ratio R
0
in
models for infectious diseases in heterogeneous populations. J Math Biol 1990, 28:365-382.
22. Hahné S, Donker T, Meijer A, Timen A, van Steenbergen J, Osterhaus A, van der Sande M, Koopmans M, Wallinga J,
Coutinho R, Dutch New Influenza A(H1N1)v Investigation Team: Epidemiology and control of influenza A(H1N1)v in
the Netherlands: the first 115 cases. Euro Surveill 2009, 14(27), pii: 19267.
23. Wallinga J, Teunis P, Kretzschmar M: Using data on social contacts to estimate age-specific transmission parameters
for respiratory-spread infectious agents. Am J Epidemiol 2006, 164:936-944.
24. Smieszek T: A mechanistic model of infection: why duration and intensity of contacts should be included in
models of disease spread. Theor Biol Med Model 2009, 6:25.
25. Nishiura H: Time variations in the transmissibility of pandemic influenza in Prussia, Germany, from 1918-19. Theor
Biol Med Model 2007, 4:20.
Nishiura et al. Theoretical Biology and Medical Modelling 2010, 7:1
/>Page 12 of 13
26. Nishiura H, Hoye B, Klaassen M, Bauer S, Heesterbeek H: How to find natural reservoir hosts from endemic
prevalence in a multi-host population: A case study of influenza in waterfowl. Epidemics 2009, 1:118-128.
27. Centers for Disease Control and Prevention (CDC): Serum cross-reactive antibody response to a novel influenza A
(H1N1) virus after vaccination with seasonal influenza vaccine. Morb Mortal Wkly Rep 2009, 58:521-524.
28. Itoh Y, Shinya K, Kiso M, Watanabe T, Sakoda Y, Hatta M, Muramoto Y, Tamura D, Sakai-Tagawa Y, Noda T, Sakabe S,
Imai M, Hatta Y, Watanabe S, Li C, Yamada S, Fujii K, Murakami S, Imai H, Kakugawa S, Ito M, Takano R, Iwatsuki-
Horimoto K, Shimojima M, Horimoto T, Goto H, Takahashi K, Makino A, Ishigaki H, Nakayama M, Okamatsu M,
Takahashi K, Warshauer D, Shult PA, Saito R, Suzuki H, Furuta Y, Yamashita M, Mitamura K, Nakano K, Nakamura M,
Brockman-Schneider R, Mitamura H, Yamazaki M, Sugaya N, Suresh M, Ozawa M, Neumann G, Gern J, Kida H,
Ogasawara K, Kawaoka Y: In vitro and in vivo characterization of new swine-origin H1N1 influenza viruses. Nature
2009, 460:1021-1025.
29. Reichert T, Chowell G, Nishiura H, Christensen RA, McCullers JA: Does Glycosylation as a modifier of Original
Antigenic Sin explain the case age distribution and unusual toxicity in pandemic novel H1N1 influenza?. BMC
Infect Dis 2010, 10:5.
30. Britton T, Nordvik MK, Liljeros F: Modelling sexually transmitted infections: the effect of partnership activity and
number of partners on R0. Theor Popul Biol 2007, 72:389-399.
31. Newman MEJ: The structure and function of complex networks. SIAM Review 2003, 45:167-256.
32. Hethcote HW, Yorke JA: Gonorrhea Transmission Dynamics and Control (Lecture Notes in Biomathematics, 56) Berlin:
Springer-Verlag 1980.
33. Goldstein E, Apolloni A, Lewis B, Miller JC, Macauley M, Eubank S, Lipsitch M, Wallinga J: Distribution of vaccine/
antivirals and the ‘least spread line’ in a stratified population. J R Soc Interface 2009.
34. Nishiura H, Chowell G, Heesterbeek H, Wallinga J: The ideal reporting interval for an epidemic to objectively
interpret the epidemiological time course. J R Soc Interface 2010, 7:297-307.
35. Keeling M: The implications of network structure for epidemic dynamics. Theor Popul Biol 2005, 67:1-8.
36. Smieszek T, Fiebig L, Scholz RW: Models of epidemics: when contact repetition and clustering should be included.
Theor Biol Med Model 2009, 6:11.
37. Gurevich KG: Formal kinetics of H1N1 epidemic. Theor Biol Med Model 2009, 6:23.
38. Chowell G, Castillo-Chavez C: Worst-Case scenarios and epidemics. Bioterrorism: Mathematical and Modeling
Applications in Homeland Security, (Frontiers in Applied Mathematics 28) Philadelphia, PA: Society for Industrial
MathematicsBanks T, Castillo-Chavez C 2003.
39. Bettencourt LMA, Ribeiro RM, Chowell G, Lant T, Castillo-Chavez C: Towards Real Time Epidemiology: Data
Assimilation, Modeling and Anomaly Detection of Health Surveillance Data Streams. Intelligence and Security
Informatics: Biosurveillance (Lecture Notes in Computer Science, volume 4506) Berlin: Springer 2009.
40. Ball F, Clancy D: The final size and severity of a generalised stochastic multitype epidemic model. Adv Appl Prob
1993, 25:721-736.
41. Statistics Bureau, Ministry of Internal Affairs and Communications. Population estimates. Tokyo: Statistics Bureau
(in Japanese). (accessed on 10 December 2009).
42. Longini IM, Ackerman E, Elveback LR: An optimization model for influenza A epidemics. Math Biosci 1978, 38:141-157.
43. Britton T: On critical vaccination coverage in multitype epidemics. J Appl Prob 1998, 35:1003-1006.
44. Garske T, Legrand J, Donnelly CA, Ward H, Cauchemez S, Fraser C, Ferguson NM, Ghani AC: Assessing the severity of
the novel influenza A/H1N1 pandemic. BMJ 2009, 339:b2840.
45. Nishiura H, Klinkenberg D, Roberts M, Heesterbeek JA: Early epidemiological assessment of the virulence of
emerging infectious diseases: a case study of an influenza pandemic. PLoS ONE 2009, 4:e6852.
46. Presanis AM, De Angelis D, New York City Swine Flu Investigation Team, Hagy A, Reed C, Riley S, Cooper BS, Finelli L,
Biedrzycki P, Lipsitch M: The severity of pandemic H1N1 influenza in the United States, from April to July 2009: a
Bayesian analysis. PLoS Med 2009, 6:e1000207.
doi:10.1186/1742-4682-7-1
Cite this article as: Nishiura et al.: Pros and cons of estimating the reproduction number from early epidemic
growth rate of influenza A (H1N1) 2009. Theoretical Biology and Medical Modelling 2010 7:1.
Submit your next manuscript to BioMed Central
and take full advantage of:
• Convenient online submission
• Thorough peer review
• No space constraints or color figure charges
• Immediate publication on acceptance
• Inclusion in PubMed, CAS, Scopus and Google Scholar
• Research which is freely available for redistribution
Submit your manuscript at
www.biomedcentral.com/submit
Nishiura et al. Theoretical Biology and Medical Modelling 2010, 7:1
/>Page 13 of 13