Báo cáo y học: "A novel approach to modelling water transport and drug diffusion through the stratum corneum" pdf
Bạn đang xem bản rút gọn của tài liệu. Xem và tải ngay bản đầy đủ của tài liệu tại đây (2.32 MB, 25 trang )
Marquez-Lago et al. Theoretical Biology and Medical Modelling 2010, 7:33
/>
RESEARCH
Open Access
A novel approach to modelling water transport
and drug diffusion through the stratum corneum
Tatiana T Marquez-Lago1,2*, Diana M Allen3*, Jenifer Thewalt4
* Correspondence: tatiana.
;
1
Department of Biosystems Science
and Engineering, ETH Zurich,
Mattenstrasse 26, 4058 Basel,
Switzerland
3
Department of Earth Sciences,
Simon Fraser University, Burnaby,
BC, V5A 1S6, Canada
Abstract
Background: The potential of using skin as an alternative path for systemically
administering active drugs has attracted considerable interest, since the creation of
novel drugs capable of diffusing through the skin would provide a great step
towards easily applicable -and more humane- therapeutic solutions. However, for
drugs to be able to diffuse, they necessarily have to cross a permeability barrier: the
stratum corneum (SC), the uppermost set of skin layers. The precise mechanism by
which drugs penetrate the skin is generally thought to be diffusion of molecules
through this set of layers following a “tortuous pathway” around corneocytes, i.e.
impermeable dead cells.
Results: In this work, we simulate water transport and drug diffusion using a threedimensional porous media model. Our numerical simulations show that diffusion
takes place through the SC regardless of the direction and magnitude of the fluid
pressure gradient, while the magnitude of the concentrations calculated are
consistent with experimental studies.
Conclusions: Our results support the possibility for designing arbitrary drugs capable
of diffusing through the skin, the time-delivery of which is solely restricted by their
diffusion and solubility properties.
Introduction
Recently, the potential for using skin as an alternative path for administering systemically active drugs has attracted considerable interest [1]. Among some of the most
active topics of research is the study of the physical properties of the Stratum Corneum (SC), which constitutes the uppermost set of skin layers. The SC’s main function
is providing a barrier against the loss of physiologically essential substances, and to the
diffusion of potentially toxic chemicals from the external environment into the body. It
also constitutes a protection against mechanical insults and is the primary defence
against ultraviolet light; screening out more than 80 percent of incident irradiation.
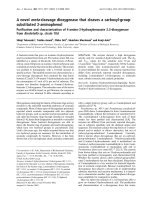
The SC is the uppermost layer of the epidermis (see Figure 1) and consists of a network of cells called corneocytes, embedded in a lipid matrix. This structure between
the cells of the SC is quite unique in mammalian membrane biology, and has been
long considered a “solid lipid crystal” [2]. Beneath the SC, the viable epidermis is
chiefly composed of specialized cells known as keratinocytes [3]. These keratinocytes
grow in size and remodel their cytoplasm, preparing to transform into corneocytes
through a process of terminal differentiation followed by programmed cell death. The
© 2010 Marquez-Lago et al; licensee BioMed Central Ltd. This is an Open Access article distributed under the terms of the Creative
Commons Attribution License ( which permits unrestricted use, distribution, and
reproduction in any medium, provided the original work is properly cited.
Marquez-Lago et al. Theoretical Biology and Medical Modelling 2010, 7:33
/>
Figure 1 Structure of the stratum corneum.
corneocytes, although devoid of a metabolism, confer most of the skin resistance to
chemical and physical attacks, and in their normally dehydrated state also provide
obstacles against water loss through the skin.
A diffusing molecule has to cross multiple bilayers before it either encounters viable
tissue, where it is required to act locally, or blood supply if it is to act systemically [4].
Hence, the precise mechanism by which drugs penetrate the skin is generally thought
to be the diffusion of molecules through the SC following a tortuous pathway around
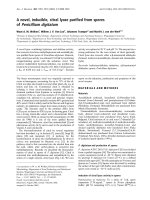
dead cells [4]. Namely, the SC is composed of stacked, polyhedral corneocytes surrounded by lipid membranes and, for the sake of simplicity, can be thought of as a
brick wall composed of dead cells (the “bricks”) and intercellular lamellar membranes
(the “mortar”), as depicted in Figure 2. Such geometry has been previously considered
Page 2 of 25
Marquez-Lago et al. Theoretical Biology and Medical Modelling 2010, 7:33
/>
Figure 2 Dimensions of the corneocytes and intercellular channels.
in simplified one-dimensional [5] or two-dimensional diffusion models [6-8], and
within studies linking permeability and solubility [6], SC geometry and permeability
[9], and the dependence of diffusivity and general SC barrier properties on permeability, corneocyte alignment and lipid content [6,9-11].
Skin has previously been considered a porous medium [12] but, to the best of our
knowledge, fluid flow models in generalized porous media had not been previously
applied to the SC. In this paper, we summarize our results in [13], where a simple
three-dimensional porous media model for water transport and drug diffusion in the
SC was presented, much as it is used for the conceptually similar problem of groundwater flow and contaminant transport. A simplified version of the general problem of
water flow through a porous medium is formulated. Also, the general problem of mass
transport within a porous medium is considered; the logical application being the analysis of drugs being applied to the stratum corneum (SC).
In our approach, the SC is considered to be composed of a periodic structure of cellular skeletons, separated by intercellular lipid channels. The specific biological data
that are used to define the parameters for the model and guide the simulations are
used in a simplified context. Variables that increase the complexity of the model, such
as temperature, or variables that arise from the introduction of chemical drugs that
would alter its physical structure are generally excluded.
It should be noted that the impermeability of corneocytes can be controversial, since
corneocytes can swell after prolonged soaking in excess water. However, swelling does
not hint to any permeability property, but simply means that corneocytes contain proteins that can bind water molecules. Moreover, corneocytes are surrounded by a tough
cellular envelope consisting of covalently bound proteins and lipids, vastly differing
from mammalian plasma membranes, which are quite permeable to water. Hence, corneocytes are largely considered to be impermeable, while lipids provide the major
transdermal route for water transport (cf. [14], and references therein).
Our approach for modelling the diffusion of water through skin layers involves the
concepts of flow through porous media as applied to groundwater flow modelling
[15,16]. Following such an approach, geologic materials -and in our case the SC- may
Page 3 of 25
Marquez-Lago et al. Theoretical Biology and Medical Modelling 2010, 7:33
/>
be considered “equivalent porous media”, which means that the pores (voids) and
grains comprising the matrix are treated as a continuum, and equivalent macroscopic
hydraulic properties are assigned to it. Mass transport in water occurs via the processes
of advection (including mechanical dispersion) and diffusion. Advection is mass transport due to water flow, in which the mass is dissolved; thus, mass will follow the fluid’s
streamlines. Dispersion causes a zone of mixing to develop between adjacent fluids of
different compositions, and thus, will spread mass beyond the region it normally would
occupy due to advection alone. In three dimensions, dispersion spreads mass in transverse horizontal and vertical directions, as well as longitudinally. Diffusion occurs
along a concentration gradient, and may transport mass in a direction opposite to the
fluid flow if concentration gradients are high enough or flow velocities are low. In such
cases, advection and diffusion are competing processes.
A final consideration is the boundary conditions for both water flow and mass transport. One serious obstacle for building an accurate model within the SC is the unreliability and general lack of experimental data; parameters such as pressure (for boundary
conditions) are either unknown or vaguely referenced. In our approach, the interpretation of the boundary conditions for water flow is quite straightforward, and involves
specifying the head or pressure along the boundary, a specified flux across the boundary, or a combination of the two, in which the flux rate is variable with the head difference across the boundary. In the case of mass transport, boundary conditions include a
specified concentration along the boundary, a concentration diffusive flux across the
boundary, or a combination of the two, which could represent a constant chemical
flux with a specified concentration or pulse-type loading with constant input fluxes, to
name a few.
As is the case in all predictive models, several simplifications and assumptions have
been made to describe the SC. However, no model exists without simplifications, and
modellers must find a balance between an adequate representation of the physical phenomena (which may vary, depending on the focus of the study) and the associated
computational costs to solve the model. In this sense, if a simple model predicts behaviour as demonstrated by a real system, the simplifying assumptions are duly justified.
Henceforth, a model can be tuned, and the importance of various factors can be better
estimated.
Our proposed model does not claim to be an all-encompassing view of the structure
and functionality of the SC, but aims to provide for a basic ground upon which refined
models in a variety of three-dimensional skin architectures and conditions could be
simulated. For instance, by extending to a porous media context new and previous
considerations on corneocytes size and arrangement [7,8,11], permeability changes
[6,9], and variation of intercellular lipids [10], to name a few. As such, a wide variety
of physiological and pathological conditions can be analyzed, in a more systematic and
practical way.
Theory
Geometry of the SC
The dimensions of both corneocytes and intercellular channels vary over a wide range,
depending on the hydration level, the part of the body, and the organism from where a
sample is extracted. Typical corneocyte dimensions can vary from 10 μm × 10 μm ×
Page 4 of 25
Marquez-Lago et al. Theoretical Biology and Medical Modelling 2010, 7:33
/>
0.5 μm to 40 μm × 40 μm × 1 μm; the “prototypical” one having dimensions of 20 μm
× 20 μm × (0.5-1.0) μm. Moreover, the width of the intercellular channels usually lies
in the range of 0.2-1.0 μm between adjacent corneocytes (N. Kitson, personal communication, and [17-20]).
The matrix that comprises the material present in the intercellular channels is composed of hydrophobic lipids arranged in multiple lamellar sheets, along with remnants
of intercellular attachment plaques [21]. The important feature of all these lipids is
that they structure themselves into fairly solid, ordered arrays [22]. Thus, the lamellar
membranes of the SC provide the barrier to systemic water loss and impede the uptake
of xenobiotics.
Stratum Corneum as a Porous Medium
The pathways for passive diffusion across mammalian epidermia are thought to be: (1)
between the cells of the SC (intercellular pathway), (2) through the cells of the SC, and
(3) through appendages such as hair follicles and sweat glands. Although the relative
importance of each is still not clear, there is a general consensus that the intercellular
pathway plays a major role in water and small molecule transport.
Since the SC is obviously a heterogeneous material, representing it by a porous medium model would, in the simplest case, divide the SC into two domains: the pore space
and the impermeable space, distinguished by their distinct conductive properties. Rigorously, the physical counterparts of both domains would also be heterogeneous. In
particular, the passive diffusion of molecules across the SC via the intercellular pathway can be described in terms of diffusion within a single lipid layer, diffusion perpendicular to the lipid lamellae, and interlamellar diffusion. So, for example, water
diffusion across an array of stacked lipid layers having coexistent liquid crystalline
(fluid) and crystalline regions, the membrane component of the diffusion path can
itself be imagined as a porous medium; the solid lipids being the impermeable space
and the fluid lipids composing the pore space.
For the sake of simplicity, we consider the intercellular channels to be homogeneous
and isotropic with a significantly higher permeability than the corneocytes. Thus, in
our simplified model, molecules should follow a tortuous path around corneocytes,
and their pathlines would depict a “direct” route going from higher to lower hydraulic
pressure, without explicitly taking into consideration the nano-scale tortuosity of the
lipid lamellae that form the intercellular channels. Nevertheless, this nano-scale tortuosity will be partially accounted for in the average characteristics of the ‘pore space’,
their effects not being altogether neglected. Alternatively, one could explicitly account
for anisotropies, at the expense of exceedingly large computation costs, a numerical
topic that lies outside the scope of this study.
Modelling flow in porous media
Following the methodology described in [15,16], we will develop the partial differential
equation describing flow in a porous medium, based on the law of conservation of
mass, particularly applied to a unit representative elementary volume (REV) with
dimensions Δx, Δy, Δz. This PDE refers to time variations in the hydraulic head,
expressed in units of height. The hydraulic head h = h(x, y, z, t) is equivalent to the
sum of the elevation head z and the pressure head (P/rωg) where P is the pressure,
Page 5 of 25
Marquez-Lago et al. Theoretical Biology and Medical Modelling 2010, 7:33
/>
rω is the density of the fluid, and g is the gravitational acceleration. In fluid dynamics,
head is a concept that relates the energy in an incompressible fluid to the height of an
equivalent static column of that fluid. From Bernoulli’s Principle, the total energy at a
given point in a fluid is the energy associated with the movement of the fluid, plus
energy from pressure in the fluid, plus energy from the height of the fluid relative to
an arbitrary datum. In a porous medium, the velocity is small enough that the energy
associated with movement of the fluid is negligible.
A macroscopic constitutive equation (referred to as Darcy’s law) relates the hydraulic
gradient to the mass (fluid) flux in three dimensions using constants of proportionality
(Kx, Ky, Kz). For instance, in one dimension the fluid flux is defined by:
fluid flux = K
dh
.
dx
The hydraulic conductivity, K, is a property of both the porous medium and the
fluid, and is defined by:
g
K =k w
where k is the intrinsic permeability of the porous medium (in units of squared
length) and μ is its viscosity. K can be anisotropic in each of the three coordinate
directions such that the principal directions of anisotropy are not equal (Kx ≠ Ky ≠ Kz
). As well, Kx , Ky , Kz are typically assumed to be collinear to the x, y, z axes. If it is
not possible to align the principal directions of anisotropy with a rectilinear coordinate
system, one should necessarily consider all the components of the tensor:
⎡ K xx
⎢
K = ⎢ K yx
⎢K
⎣ zx
K xy
K yy
K zy
K xz
K yz
K zz
⎤
⎥
⎥.
⎥
⎦
Considering the mass flux of fluid into an REV, and by further defining R* ΔxΔyΔz
to be the volumetric inflow rate (with R* > 0 referring to a source of water, and R* < 0
to a sink, the transient flow can be described
∂ ⎛
∂h ⎞ ∂ ⎛
∂h ⎞ ∂ ⎛
∂h ⎞
∂h
− R*
⎜ Ky
⎟+
⎜ Kx
⎟+
⎜ Kz
⎟ = Ss
∂x ⎝
∂x ⎠ ∂y ⎝
∂y ⎠ ∂z ⎝
∂z ⎠
∂t
where Ss is the specific storage, defined as the volume of water released from storage
per unit change in head h, per unit volume of saturated porous medium. The specific
storage of a porous medium can be described by:
(
S s = g p + n
)
where bp is the vertical compressibility of the porous medium, and bω is the fluid
compressibility. Hence, for isotropic conditions (Kx = K y = K z ), the equation that
describes flow in a saturated porous medium is:
Page 6 of 25
Marquez-Lago et al. Theoretical Biology and Medical Modelling 2010, 7:33
/>
∇ 2h =
g( p + n ) ∂h S s ∂h
⋅
=
K ∂t
K
∂t
and if one intends to model steady state flow, the steady-state Laplace equation is
obtained. If the porous medium is unsaturated, whereby the pore spaces are only partially filled with water, K becomes a function of the pressure head, and consequently,
of the hydraulic head. Hence, the steady-state non-linear unsaturated anisotropic flow
equation is defined as:
∂ ⎛
∂h
⎜ K xh
∂x ⎝
∂x
∂h
⎞ ∂ ⎛
⎜ K yh
⎟+
∂y ⎝
∂y
⎠
⎞ ∂ ⎛
∂h ⎞
⎟+
⎜ K zh
⎟ = 0.
∂z ⎝
∂z ⎠
⎠
Thus, to solve this equation for steady state flow conditions, information on the
hydraulic conductivity (permeability) of the different components of the SC and how
the pressure varies within each is needed. For transient flow simulations, information
on the rheological properties is needed, in order to define the specific storage coefficient. Finally, in this formulation, the density and viscosity of the fluid are assumed to
be constant, as well as its temperature.
Modelling mass transport: advection and dispersion
In order to simulate mass transport in water, one has to consider advection - the mass
following the fluid’s streamlines - along with dispersion or mixing effects, and simple
diffusion. In applications with significant fluid movement, scale-dependent mechanical
dispersion is usually the more important factor. In slow moving fluids or over long
time periods, diffusion can become more important.
The process of dispersion causes a zone of mixing to develop between fluids of distinct compositions, and will spread mass beyond the region it normally would occupy
due to advection alone. It should be noted that the concept of dispersion used here
differs from that of common Applied Mathematics usage, where dispersion is the
dependence of phase velocity on wavenumber. If dispersion is to be incorporated in
the advection-diffusion equation, it should be reflected in the velocity term.
In a simple non-porous system, Fick’s law describes the chemical mass flux to be
proportional to the gradient in concentration. For instance, in one dimension, this
results in:
Fx = − D d
dC
dx
where Fx is the mass flux (of the drug in this case) in the x-direction, C is the concentration, and Dd is the molecular diffusion coefficient. In the case of mass transport
in porous media, an effective diffusion coefficient is defined to take into account the
tortuosity and effective porosity of the porous media.
Advective transport occurs simply due to the moving fluid as defined by:
Fx = v x ⋅ n P ⋅ C
where υx is the average linear velocity vector along the x direction, and np is the
effective porosity of the porous medium (often lower than the total porosity). The
Page 7 of 25
Marquez-Lago et al. Theoretical Biology and Medical Modelling 2010, 7:33
/>
average linear velocity is then defined as the ratio of the fluid flux to the effective
porosity.
Dispersivity is a property of the porous media and has been shown to be scale
dependent. Mechanical dispersion can occur in the same direction as the flow, but also
in directions perpendicular to the flow (laterally and vertically). Dispersion in all directions, however, is dependent on the average linear velocity in the direction of fluid
flow. Therefore, dispersion is linked to the velocity via the dispersivity values in each
of the longitudinal (aL), transverse horizontal (aTH) and transverse vertical directions
(aTV) through a series of equations (see [15]).
By further considering a hydrodynamic dispersion coefficient D (that incorporates
the combined effects of diffusion and mechanical dispersion), and all three dimensions
of the problem, one can construct an appropriate advection-dispersion equation. If it is
the case that the dispersion coefficient is constant, this equation would simply be:
∂C
= D∇ 2C − ⋅ ∇C + C∇ ⋅
∂t
where C still denotes the concentration (for instance, of a drug or pollutant), D is the
hydrodynamic dispersion coefficient, and υ is the average linear velocity vector with
components υx, υy, υz. Under zero flow conditions, υ would become zero and only diffusion would be active. The justification for treating dispersion in this manner is purely
a practical one, and stems from the fact that the macroscopic outcome is the same for
both diffusion and mechanical dispersion. The actual physical processes, however, are
entirely different. For a more detailed derivation of the flow and advection-dispersion
equations, please refer to [13].
Pressure within Stratum Corneum
There is a lack of available data for defining pressure across the SC. Despite a thorough literature search, no specific measurements were found, and thus, many types of
pressure had to be considered. In the porous media context, capillary pressure is a
basic parameter for studying the behaviour of two or more immiscible fluid phases.
The height of capillary rise can be defined by:
hc =
Pw
g
where hc is the capillary rise and Pw is the capillary pressure between water and air
in the porous medium. Thus, we refer to “capillary head”, and the difference between
the head pressures at the top and bottom layers of corneocytes would define the
pressure gradient. Other types of pressure worth considering are: hydrostatic blood
pressure, hydrostatic capillary pressure [16], gauge pressure, vapour pressure, osmotic
pressure, and tissue (interstitial) hydrostatic pressure. In any case, the pressure gradient
within SC is thought to be outward-oriented.
In the case of skin as a whole, it has been shown that the spatial and temporal
profiles of pressure, stress and fluid velocity depend on the permeability, overall fluid
drainage and elasticity of the tissue [23]. Thus, tissue is considered to be a fluid-filled,
porous, elastic material. The fluid and solid phases are each inherently incompressible,
and tissue deformation is described as a change in the relative fluid volume. The two
Page 8 of 25
Marquez-Lago et al. Theoretical Biology and Medical Modelling 2010, 7:33
/>
Page 9 of 25
phases are assumed to exist in mechanical equilibrium, and a generalized Darcy’s law
characterizes interstitial fluid movement [23]. From here, it is viable to consider such
ideas to be applicable to the case of SC.
Permeability of the Stratum Corneum
Although many results have been reported for the permeability coefficients of the
lipids within the SC [24,25], for simplicity we consider the permeability coefficient
within the intercellular channels of mammalian SC to be in the order of 10-3 cm/sec
(or 10 μm/sec) [26], (corresponding to a temperature range of 25°C to 28°C), while
corneocytes are considered to be impermeable (N. Kitson, personal communication,
and [14]).
Rheological Properties of the Stratum Corneum
The elastic properties of the SC, measured by the elastic modulus, should be taken into
consideration if a transient simulation of the main equation of flow through a porous
medium is intended. First, the elastic modulus should be translated into the bulk modulus, which can be easily achieved through the use of Poisson’s ratio. This quantity has
been measured for a large number of materials. Unfortunately, no ratios were found
for the SC despite a thorough literature search, nor were the values found of volumetric stress and strain, from which the bulk modulus can be directly derived. This is
the main reason why transient fluid flow simulations are not performed in this work (a
steady pressure gradient was assumed). Explanations [13] of some of the rheological
properties of the SC should allow for future consideration, while it is worth noticing
simpler diffusion models (for instance [27]) have attempted to describe transient behaviour without pressure, nor elasticity.
Model Construction and Computational Method
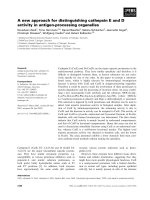
Physically, the corneocytes resemble three dimensional bodies with hexagons on the top
and bottom faces (Figure 3a). For simplicity, we consider them to be thin three-dimensional bodies with rectangles in both faces (Figure 3b). Such simplified corneocytes will
be ordered in stacked layers, resembling a “brick and mortar” structure.
Except for very simple systems, analytical solutions of the main equation of flow
through a porous medium are rarely possible. Thus, a numerical approach was
A
Keratinocytes
Intercellular channels
B
Figure 3 Brick and mortar structure of corenocytes. (a) View from above and (b) three-dimensional
lateral view.
Marquez-Lago et al. Theoretical Biology and Medical Modelling 2010, 7:33
/>
considered. Here, we shall denote the simulation domain by Ω, and its boundary by Γ
(where ΓT constitutes the top boundary of the SC, and ΓB the bottom boundary). Our
simulations will refer to the solution of two separate problems. The first is the flow
problem, denoted by:
∂ ⎛
∂h ⎞ ∂ ⎛
∂h ⎞ ∂ ⎛
∂h ⎞
⎜ Ky
⎟+
⎜ Kx
⎟+
⎜ Kz
⎟ = 0 in Ω,
∂x ⎝
∂x ⎠ ∂y ⎝
∂y ⎠ ∂z ⎝
∂z ⎠
∂h
= 0 in Γ \ {Γ T , Γ B},
∂n
h(Γ T ) = h 0 and h(Γ B ) = h1.
As h1 >h0, fluid flow is directed upward. The equation is solved for h = h(x, y, z)
under steady state conditions. Once a pressure profile has been obtained, the average
linear velocity vector υ is determined spatially throughout the domain, and is then
used to solve the drug transport problem, denoted by:
∂C
= D∇ 2C − υ ⋅ ∇C + C∇ ⋅ υ,
∂t
C(Γ T1) = C 0∀t ,
where ΓT1 denotes a maximal square source area surrounded by an area of zero concentration (see Mass transport simulations section), C = C(x, y, z, t) is the concentration of an arbitrary drug, and the coefficient D represents the hydrodynamic dispersion
coefficient (accounting for both the effective porosity and tortuosity of the porous
medium).
To solve problems using our modelled structure of the physical domain, we rely on
the use of numerical techniques. We assume that our problem solution can be considered to be periodic (cfr. Appendix), so we construct a three-dimensional computational
cell for which the steady state flow (without any additional sources of water) and transient solute transport (without chemical reaction) are to be calculated. The discretization of the equations for groundwater flow modelling is not trivial, largely due to the
fact that the SC is a heterogeneous medium. Thus, a precompiled software package,
Visual MODFLOW [28] with MT3D (Waterloo Hydrogeologic Inc., 2000), was used.
This software is commonly used for modelling groundwater flow and chemical transport through porous media, providing a solution for the fluid flow equation and the
advection-dispersion equation within a discretized domain using the method of finite
differences.
Grid Construction
In consideration of the “brick and mortar” structure, we discretized a basic computational cell composed of several layers of corneocytes (3 in our model), separated by
their corresponding intercellular channel layers. In principle, the basic computational
cell is regarded as representative of a periodic behaviour. Within the intercellular subdomain, the permeability is of the order of 10 μm/sec [24], while corneocytes are considered practically impermeable [20]. Plan views of model layers are depicted in (a)
and (b) in Figure 4. The first and third layers are represented by (a), whereas (b) represents the second (middle) layer. This basic cell is used for all simulations, and it is
worth noting that this is only one out of many possible periodic and symmetric
Page 10 of 25
Marquez-Lago et al. Theoretical Biology and Medical Modelling 2010, 7:33
/>
Figure 4 Layers of corneocytes. (a) plan view of first and third layers. (b) plan view of second layer. (c)
(d) and (e) Cross-sections corresponding to lines 3, 2 and 1, respectively as indicated on (a). Location of
concentration profiles and observation points for each depth indicated. Grid dimensions in metres for the
scaled domain (5 m = 5 μm).
configurations. Cross-sectional views for the section lines 1- 3 are shown in (c-e),
respectively.
For our basic computational cell, every corneocyte was considered to be a regular
three-dimensional box with dimensions 20 μm × 20 μm × 1 μm and each layer was
designed to contain at most four whole corneocytes in any horizontal plane and three
in a vertical plane. Intercellular channels similarly were assigned a thickness of 1 μm.
Because Visual MODFLOW can only process information in the dimensions of metres
or inches, it was necessary to scale all the dimensions and hydraulic properties of our
problem by a factor of 106, translating the model dimensions from micrometres to
Page 11 of 25
Marquez-Lago et al. Theoretical Biology and Medical Modelling 2010, 7:33
/>
metres. Thus, each corneocyte was assigned a size of 20 m × 20 m × 1 m and the
intercellular channels were 1 m thick, for a total model domain size of 42 m × 42 m ×
5 m (3 corneocytes separated by 2 intercellular channels). Nevertheless, the reader
should bear in mind that such scaling does not affect the solution, qualitatively nor
quantitatively, since all parameters were scaled accordingly.
To control the error, a uniform discretization was initially implemented using 168
rows and columns, and 20 layers dividing the vertical plane. Next, we used a “telescopic mesh refinement” technique, ending up with 24 rows and columns within each
intercellular channel region and 8 within each corneocyte region (preserving the number of layers).
Permeability, Porosity and Flow Boundary Conditions
As previously mentioned, the size of the corneocytes has been scaled in the model, and
to preserve qualitative and quantitative behaviour it is necessary to do the same for all
other parameters considered in the simulations. The permeability model for input to
MODFLOW consisted of a permeability of 10 μm/sec within the intercellular channels,
which was scaled to 10 m/sec in the model. The corneocytes were initially assigned a
permeability of 10-6 μm/sec (or 10-6 m/sec in the scaled model). It is worth noting,
however, that through a sensitivity analysis we determined that the pressure distribution remained the same regardless of whether a value of 10-6 m/sec or 10-4 m/sec was
used. Thus, a difference in permeability of at least four orders of magnitude is sufficient to reproduce the desired qualitative behaviour. Moreover, an effective porosity of
0.27 was assumed to represent the SC [29].
Zero flux boundary conditions were used for all lateral faces of the computational
cell, based on the fact that the behaviour in the horizontal direction is expected to be
periodic. As mentioned previously, exact measurements of the pressure gradient across
the SC are not reported in the literature. The top and bottom faces had to be set with
appropriate values in order to define the pressure gradient. In consideration of the
boundary conditions for the top and bottom faces, atmospheric pressure is equivalent
to 760 mmHg (or 101,325 N/m2) and the density of water is approximately 1.0018 ×
103 kg/m 3 at 20°C. Thus, the head pressure at the top of the SC is approximately
10.3137 × 106 μm, which we shall consider as 10 × 106 μm.
If we choose a pressure 0.33 mmHg higher than the atmospheric pressure to be
found at the bottom of the SC, this would translate into an approximate difference of
4,000 μm in head values, over roughly a 10 μm thickness (or, equivalently, 2,000 μm
over the model thickness of 5 μm). These would correspond to a specified head pressure boundary condition of 10 × 106 μm across the top layer and a specified head pressure boundary condition of 10.002 × 106 μm across the bottom layer. This gradient by
far dominates any possible baseline physiological fluctuations in pressure, and provides
an upper bound for our numerical simulations.
Now, due to the uncertainty in the estimates of pressure gradient, we undertook
simulations for two different pressure differences; one set at the values above (a total
difference of 2,000 μm), and a second set at a much lower pressure gradient (three
orders of magnitude lower, namely 2 μm difference in pressure). The lower pressure
difference corresponds to 10 × 103 m and 10.002 × 10³ m applied to the top and bottom boundaries, respectively. These two simulations were done in order to examine
Page 12 of 25
Marquez-Lago et al. Theoretical Biology and Medical Modelling 2010, 7:33
/>
the effect of pressure gradient on the results. For the simulations undertaken at the
higher pressure difference, we found that occasional numerical instabilities in the mass
transport simulation resulted due to the excessive high gradient (data not shown). This
is because a 2,000 m head difference was applied across a 5 m problem domain. Nonetheless, a set of solutions was obtained (see [13]), and the simulations presented here
were carried out with the lower pressure gradient, the results of which are further discussed in the results section.
Dispersivities, Diffusivity and Concentration Boundary Conditions
Longitudinal dispersivity was assigned a scaled value of 0.5 m, whereas horizontal
transverse and vertical transverse dispersivities were assigned scaled values of 0.05 and
0.005 m, respectively. Here, one should note that transverse dispersivities are significantly smaller than the longitudinal dispersivity for the skin [20].
Some experiments show that the average diffusion coefficient for water within the SC
is 3.8 ± 1.3 × 10⁻⁹ cm2/sec [29,30], a physiological saline infusion called FITC-conjugated dextran has a diffusion coefficient of 10 -7 cm 2 /sec within the SC [29], and
sodium dissolved in water diffuses at a rate of 13.3 × 10⁻⁶ cm2/sec in many materials
[16]. For the simulations, we consider an effective diffusion coefficient of 10-7 cm2/sec,
equivalent to 10 μm2/sec (or 10 m2/sec in the scaled model domain).
We simulated the application of a transdermal drug (source) to the skin over a long
or continuous time interval; a constant source concentration boundary condition was
applied to the model domain surface (i.e., the outer surface of the SC). This type of
boundary condition effectively holds the concentration at the model surface constant
in time. A specified concentration of 10 mg/L was used, and the condition was implemented over a square source area surrounded by a border of zero concentration on
the top surface particularly.
Mass Transport Simulations
Mass transport simulations were done using MT3D (Mass Transport in 3D), a separate
code that is contained within Visual MODFLOW, which solves the advection-dispersion (including diffusion) equation at either steady-state or as a function of time. All
model runs for mass transport were done in transient time, using the pre-determined
pressure field at steady-state. This software automatically implements the time step
that complies with its stability criteria, the related number of transport steps that
should be used for a simulation. The total simulation time was set to 1 sec with the
maximum number of time steps equal to 1000. These parameters were sufficient for
convergence of the solution. Simulation results were saved every 5 transport steps.
It should be noted that the reason behind considering a square source area surrounded by an area of zero concentration, ΓT1, is purely numerical. Namely, the package MT3D in Visual MODFLOW requires at least one boundary condition to be
specified, which we prescribed at the top layer, alongside initial conditions. However,
both conditions considering the full top layer could not be simultaneously accounted
for by the software. Hence, we did not consider the three first and last columns and
rows of the top layer as concentration sources for the calculation of concentration
profiles.
Page 13 of 25
Marquez-Lago et al. Theoretical Biology and Medical Modelling 2010, 7:33
/>
Concentration Observation Points
For the mass transport problem, multiple concentration observation points were introduced into the model; five depths at each of three profile locations as shown in Figure
4. Such points were chosen to be at locations where the ray that defines them passes
through at least one vertical layer of intercellular channel. The discrete locations used
for concentration measurements were at 0.5, 1.5, 2.5, 3.5 and 4.5 m depth, where the
origin of the model was the bottom left. The points are labelled 5 through 1, from the
top down at each profile location (see Figure 4).
Location #1 allows us to obtain the time evolution of concentration for observation
points within an intercellular channel, followed by a corneocyte, followed by a second
intercellular channel. Correspondingly, location #2 refers to points within a corneocyte,
followed by an intercellular channel, followed by a second corneocyte. Observation
points located in intercellular channels only are to be found at location #3.
The concentration of the chemical was reported as a function of time at each observation point. The resulting plot of concentration versus time is referred to as a “breakthrough curve”.
Solvers
We used the WHS (Waterloo Hydrogeologic Solver) solver for obtaining the flow solution in Visual MODFLOW. This solver uses a Bi-Conjugate Gradient Stabilized (BiCGSTAB) acceleration routine implemented with Stone incomplete decomposition for
preconditioning of the groundwater flow partial differential equations. The solver will
approach the solution iteratively, using the specified domain discretization.
To solve the advective component of transport within MT3D, we used the Modified
Method of Characteristics (MMOC), while the advection-dispersion equation was
solved using a modified incomplete Cholesky decomposition. Both the relative convergence criterion and the minimum saturated thickness as a fraction of cell thickness
were set as the code default values (10-4 and 10-2 units, respectively).
Results
Pressure Distribution
The permeability model results in channelized flow as anticipated. Pressure head distributions result in the fluid following a tortuous path through the intercellular channels
and around the corneocytes. Due to the latter, we focused in intercellular pressure distribution profiles. Numerical contours are shown in Figure 5, while scaled velocity vectors (which highlight the tortuosity of the flow) for each cross-section are illustrated in
Figure 6.
Given that pressure profiles are used subsequently in the mass transport simulations,
we benchmarked our pressure results with an analytical model (Figure 7), based on
Green’s functions and the method of images (for details please refer to the Appendix).
From these results, we can argue that both our scaling and Visual MODFLOW yield
solutions to the flow problem as would be theoretically expected.
Drug Diffusion Results
Following the simulations for fluid flow to establish the pressure field, a series of mass
transport simulations were carried out. As mentioned before, mass transport can result
Page 14 of 25
Marquez-Lago et al. Theoretical Biology and Medical Modelling 2010, 7:33
/>
Figure 5 Plan view of head (pressure) contours within a 42 μm × 42 μm layer composed of
intercellular channel lipids only, as obtained through MODFLOW simulation. Locations (L1, L2 and
L3) of monitoring profiles shown.
from both advective-dispersive and diffusive processes. In the case of the SC, the
assumed pressure gradient is directed outward (i.e., there is a higher fluid pressure at
the base of the SC than at the surface), and this naturally results in fluid flow in an
outward direction. As drugs are normally applied to the outer skin surface, source concentrations were placed at the top surface of the model (i.e., the skin surface). Therefore, in order for the drug to enter the skin, it must move against the direction of fluid
flow (i.e., by diffusion alone).
We observe that for a specified continuously applied concentration of 10 mg/L at the
top surface, the concentration increases at all observation points, and eventually levels
off. We opted for this kind of boundary conditions so that we could simulate a transient process without a change in the source. If the source is removed, the simulated
concentration would move as a pulse through the SC.
Figure 8 shows the results for observation points solely within an intercellular channel (location 3) for the case of a low pressure gradient between the bottom and top
surface of the SC. The concentration curves are of similar shape but, at any time point,
their magnitudes reduce alongside distance to the top boundary of the model (i.e.,
point 5 has the highest concentrations and point 1 has the lowest). This is a predictable behaviour of breakthrough curves for continuous source problems.
Page 15 of 25
Marquez-Lago et al. Theoretical Biology and Medical Modelling 2010, 7:33
/>
Figure 6 Velocity vectors for each 42 μm × 5 μm cross-section (1, 2, 3) around corneocytes and
through intercellular channels. Vectors are scaled. Section locations 1, 2, and 3 shown in Figure 4.
Page 16 of 25
Marquez-Lago et al. Theoretical Biology and Medical Modelling 2010, 7:33
/>
Page 17 of 25
Figure 7 Analytic solution of pressure distribution within a 42 μm × 42 μm layer composed of
intercellular channels, as obtained using Green’s functions and the method of images.
Time evolution of concentration at location #3.
Specified Constant Concentration (10 mg/l)
Low Outward Pressure Gradient
1.0E+03
Concentration (mg/l)
1.0E-02
1.0E-07
1.0E-12
1.0E-17
1.0E-22
1.0E-27
location3 p5
location3 p4
location3 p3
location3 p2
location3 p1
1.0E-32
1.0E-37
1.0E-42
0
0.2
0.4
0.6
Time (seconds)
0.8
1
Figure 8 Time evolution of concentration at location 3 for a specified constant concentration of 10
mg/l applied to the top surface of the model (low outward pressure gradient). Concentration is
plotted on a logarithmic scale. Location points are listed in the legend in their order of depth in the
model (5 at the top and 1 at the bottom).
Marquez-Lago et al. Theoretical Biology and Medical Modelling 2010, 7:33
/>
Page 18 of 25
The simulated concentrations for points within a corneocyte, followed by a wide
intercellular channel, followed by a second corneocyte (at location 2) are shown in
Figure 9. As illustrated in Figure 4, the location of observation point 5 is near the top
and within a corneocyte; observation points 4, 3 and 2 are within an intercellular channel; and observation point 1 is within a lower corneocyte. Concentrations are observed
to increase with time, although the maximum concentrations are considerably less
than those at location 3, corroborating that mass transport is lessened by the presence
of a corneocyte at the top of the model domain.
Figure 10 shows the results for observation points within an intercellular channel,
followed by a corneocyte, followed by a second intercellular channel (at location 1). In
this case, the concentrations attained at the top two points (5 and 4) are significantly
higher than that at point 3, which in turn is higher than both 1 and 2. Again, these
results suggest that the presence of an intercellular channel enhances mass transport,
while a corneocyte hinders it.
All together, our results show that the maximum rate of diffusion will be achieved
through intercellular channels, and that, consistent with the flow regimes shown in
Figure 6, transport will likely follow a tortuous pathway, selecting the route of maximum ease of transport. There is a direct correlation between lower permeability pathways within the material (i.e., corneocytes as opposed to intercellular channels) and a
lower rate of mass transport. Specifically, we observed that concentrations are higher
and breakthrough occurs at faster rates at locations dominated by intercellular channels. Mass transport is thus hindered by the presence of low permeability corneocytes.
The results are generally consistent with what would be predicted on the basis of diffusion-dominated mass transport in the presence of a low opposing pressure gradient.
Time evolution of concentration at location #2.
Specified Constant Concentration (10 mg/l)
Low Outward Pressure Gradient
1.0E+03
Concentration (mg/l)
1.0E-02
1.0E-07
1.0E-12
1.0E-17
1.0E-22
1.0E-27
location2 p5
location2 p4
location2 p3
location2 p2
location2 p1
1.0E-32
1.0E-37
1.0E-42
0
0.2
0.4
0.6
Time (seconds)
0.8
1
Figure 9 Time evolution of concentration at location 2 for a specified constant concentration of 10
mg/l applied to the top surface of the model (low outward pressure gradient). Concentration is
plotted on a logarithmic scale. Location points are listed in the legend in their order of depth in the
model (5 at the top and 1 at the bottom).
Marquez-Lago et al. Theoretical Biology and Medical Modelling 2010, 7:33
/>
Page 19 of 25
Time evolution of concentration at location #1.
Specified Constant Concentration (10 mg/l)
Low Outward Pressure Gradient
1.0E+03
Concentration (mg/l)
1.0E-02
1.0E-07
1.0E-12
1.0E-17
1.0E-22
1.0E-27
location1 p5
location1 p4
location1 p3
location1 p2
location1 p1
1.0E-32
1.0E-37
1.0E-42
0
0.2
0.4
0.6
Time (seconds)
0.8
1
Figure 10 Time evolution of concentration at location 1 for a specified constant concentration of
10 mg/l applied to the top surface of the model (low outward pressure gradient). Concentration is
plotted on a logarithmic scale. Location points are listed in the legend in their order of depth in the
model (5 at the top and 1 at the bottom).
As would be intuitively expected, increasing the pressure gradient (outward) has the
effect of reducing the amount of diffusion into the SC (results not shown). Concentration patterns under a high pressure gradient are similar to those described for the low
pressure gradient, but the absolute concentrations at each point reach their maximum,
albeit much lower values at earlier times. The largest difference is observed for location
3, which is situated within an intercellular channel, due to the higher upward flow of
fluid countering the downward diffusion of mass. In the absence of strong flow, diffusion is uninhibited and downward transport occurs readily.
Experimental results for the transport of a model-drug (ketorolac tromethamine) into
human skin in vivo [31] give a depth of penetration into the SC of approximately 10
μm (the SC-viable epidermal junction) within a one hour period. Drug transport was
facilitated by the use of both rigid and elastic vesicles, while depth profiles were measured using a tape-stripping method [32]. Their experimental design is likened to our
case for a constant concentration applied to the skin surface (long period of exposure).
In their experiment, roughly 2.4% (2.40 ± 0.69 μg) of the amount of the model-drug
applied to the skin surface (100 μg) cumulatively reached the middle SC layers (corresponding to the base of our model domain). Considering the graph for point 1 (base of
the model at 5 μm), location 3 (intercellular channel) (Figure 8), the line of best fit
(logarithmic) is C = 0.0035 log (time) - 0.0069. For an extrapolated time of 3600 sec (1
hour), the concentration is 0.02 mg/l (or 0.2% of the applied concentration).
Our simulations yield strikingly similar results as compared with the experimental
findings, where the relative amount of ketorolac found in middle SC layers fluctuated
between 0.1-0.3% (see Figure 4 of [31], tape-strips number 25-40). Given the uncertainty of some parameter values, such as exact pressure gradient, these results are
Marquez-Lago et al. Theoretical Biology and Medical Modelling 2010, 7:33
/>
Page 20 of 25
entirely satisfactory. Moreover, the experimental results in [31] also suggested that the
amount of model-drug in the deeper layers of the SC was found to be very little, as
compared to what could be found on the skin surface. This is entirely consistent with
our numerical results, which point to substantially reduced concentrations at depth
within the SC.
Another consideration is the possibility that osmotic pressure, the result of a water
gradient across the SC, is responsible for transport into and across the SC [33]. It has
been observed that the water content in the deepest layers of the SC is low in comparison with the water content in its superficial or central regions [22]. In consideration
of this possibility, one final simulation was conducted in which a low positive pressure
gradient (inward) was applied across the model. Pressure results suggest that flow is
directed downward along tortuous pathways around the corneocytes. Concentration
results for location 3 (intercellular channel) point to enhanced transport, with concentrations attaining maximum concentrations above those obtained for the low outward
pressure case (Figure 11). For comparison, concentrations at point 1 (5 μm depth) stabilize at 9.45 mg/l (94.5% of the applied concentration). These results are much higher
than the experimental results, which yielded 2.4% of the applied concentration at this
depth, as stated above.
Conclusions
Simulations undertaken in a standard porous medium fluid flow and transport model
proved to be very useful for describing fluid flow pathlines within the heterogeneous
skin structure as well as the behaviour of a solute placed at the top surface of the SC.
Fluid pressure and velocity profiles are consistent with the behaviour that might be
Time evolution of concentration at location #3.
Specified Constant Concentration (10 mg/l)
Low Inward Pressure Gradient
1.0E+03
Concentration (mg/l)
1.0E-02
1.0E-07
1.0E-12
1.0E-17
1.0E-22
1.0E-27
location3 p5
location3 p4
location3 p3
location3 p2
location3 p1
1.0E-32
1.0E-37
1.0E-42
0
0.2
0.4
0.6
Time (seconds)
0.8
1
Figure 11 Time evolution of concentration at location 3 for a specified constant concentration of
10 mg/l applied to the top surface of the model (low inward pressure gradient). Concentration is
plotted on a logarithmic scale. Location points are listed in the legend in their order of depth in the
model (5 at the top and 1 at the bottom).
Marquez-Lago et al. Theoretical Biology and Medical Modelling 2010, 7:33
/>
predicted based on permeability structure, regardless of the direction of the applied
pressure gradient, and provide a good representation of flow through SC from both
the physical and biological points of view. The fluid is shown to follow a tortuous path
through the intercellular channels as defined by the presence of corneocytes.
The concentrations calculated at observation points, which were placed at discrete
locations where the intercellular channels meet, demonstrate that drugs will theoretically penetrate the SC, regardless of whether the pressure gradient is directed outward
or inward, and regardless of the magnitude of the pressure gradient. Simulations were
initially conducted at a lower pressure gradient than those measured experimentally in
order to observe the differences in mass diffusion processes recorded spatially within
the SC. Increasing the magnitude of the pressure gradient to values determined experimentally has the effect of reducing the maximum concentrations attained at each
point, particularly within the intercellular channels. Similarly, reversing the gradient
such that there is an inward directed fluid flow results in enhanced transport. In all
cases, diffusion results in mass transport of a solute placed at a specified continuous
concentration at the top surface of the SC. The percentage of diffused drug within the
SC in our model is consistent within reasonable ranges of the experimental results.
As could be expected from any macroscopic model, our results do not attempt to
produce a full representation of molecular transport behaviour within the SC, as the
SC was treated as an equivalent porous medium. More appropriate cellular-based conceptual models may exist. Nevertheless, the research does provide a reasonable conceptual model that appears to reproduce the expected behaviour of drug transport, which
happens to be quite a physically reasonable and straightforward simple model.
Moreover, these simulation results scale adequately with the input data, which is
consistent with the behaviour of the obtained family of solutions (cf. Appendix). Thus,
it is expected that once the pressure gradient is accurately measured through experimentation, its input into the model would provide significant resemblance to the actual
physical behaviour. Moreover, the model can be adapted for the assessment of particular drugs, considering their specific lipophilicity, size and solubility properties.
Among many topics for future research related to this work, explicit consideration of
anisotropy within the intercellular channels should be examined, perhaps implying the
creation of a multi- scaled porous media solver. Additionally, further extensive biological experimentation is needed to obtain accurate input data (e.g. pressure gradient),
from which better estimates can be derived by using our proposed methodology.
Appendix
Here, we want to provide an analytical 3D solution of a simple model that allows the
comparison of cross-section head pressure contours with those obtained from our
numerical simulations. From this comparison, we are able to address the head pressure
contours as part of a family of solutions. Thus, quantitative arbitrary values of pressure
always result in the same qualitative features. This is particularly important, since there
is no known reference for the exact value of pressure within the SC.
If we consider a two-dimensional reduction of the flow problem, corresponding to a
horizontal cross-section of the original problem, it will contain a sink and a source in
the x-z plane, mimicking the scattered pattern of the keratinocytes. A point source and
a point sink are used to depict the limit where the intercellular channels are infinitely
Page 21 of 25
Marquez-Lago et al. Theoretical Biology and Medical Modelling 2010, 7:33
/>
small, which could be considered true in comparison to the dimension of the coneocytes. The two-dimensional reduction is illustrated in Figure 12. By symmetry, we can
consider an analogous solution for the y-z plane, and a solution to the original threedimensional problem would then consist of the superposition of both periodic solutions. In this way, we can obtain the pressure contours in the x-y plane once the value
of z is fixed.
Here, it should be noted that the usual way to describe a flow is through the expres
sion u = u( x , t), which indicates the flow velocity at any point x , at any time t. In
our case, since we are dealing with an incompressible and irrotational flow, the curl
and divergence of the velocity should be zero. This is the reason why in our simplified
case, constituted by a simply connected region, we can talk about a velocity potential
, defined as u = ∇ and a scalar stream function ψ( x , y) such that its level curves
are always parallel to the velocity. The latter automatically satisfies the incompressibility condition, and since (u ·∇)ψ = 0 is we can see that the function ψ is constant along
the fluid streamlines. We are able then to construct the so-called complex potential F
= + iψ which is an analytic function in the complex plane, as is generally handled in
elementary fluid dynamics’ books (such as [34]), where the imaginary part represents
the flow contours.
With this idea in mind, and since we first want to represent the qualitative behaviour
of the flow within our two-dimensional reduction in the y-z plane, let us consider the
following BVP:
∇ 2 = 0, with ∇ → 0 as x , y → ∞,
y ( x , y = 0) = f ( x ) = ( x − s), s ∈
for a source located at a point s in the x-z plane, representing a generalized flow problem such as that illustrated by Figure 12.
Considering an arbitrary forcing for our boundary condition, the system’s solution is
J( x , y) = −
1
∞
∞
−∞
y
∫ ∫
yf ( s)
dy ds
(( x − s) 2 + y 2 )
Figure 12 Source and sink problem, in the two-dimensional reduction corresponding to a
horizontal cross-section of the original flow problem.
Page 22 of 25
Marquez-Lago et al. Theoretical Biology and Medical Modelling 2010, 7:33
/>
where
G( x , y) =
y
(( x − s) 2 + y 2 )
is the Green’s function for the 2D Laplace problem with inhomogeneous Dirichlet
boundary conditions. Hence,
J( x , y) =
∫
∞
−∞
−
1
Ln(( x − s) 2 + y 2 ) f ( s) ds
2
which has a complex potential of Φ = − 21 Ln[( z − s) 2 ].
The difficulty now lies in setting the boundary conditions properly, at a predefined
position y = L For this purpose we will use the method of images (see [13] for derivation details), upon which we obtain
Φ=−
⎧ 2L
1
⎛ ( s − z) ⎞ ⎫
Ln ⎨ −
sinh ⎜
⎟ ⎬.
⎝ 2L ⎠ ⎭
⎩
This potential refers to the domain which contains a source as the ‘bottom’ boundary
condition, while the ‘top’ boundary condition is zero-flux. We now need to consider a
domain with a sink as a ‘top’ boundary condition, with a zero- flux as a ‘bottom’
boundary condition. In this way, we can superimpose the potentials, yielding that of
our reduced 2D problem. To do this, we only need to consider the following BVP
∇ 2 = 0, with ∇ → 0 as x , y → ∞,
y ( x , y = 0) = ( x − p), p ∈ .
from which it directly follows that the potential should be
Φ=
⎧ 2L
1
⎛ (p − z) ⎞ ⎫
Ln ⎨ −
sinh ⎜
⎟ ⎬.
⎝ 2L ⎠ ⎭
⎩
By symmetry, we can consider an analogous solution for the y-z plane, and a solution to the original 3D problem would consist of the superposition of both periodic
solutions. In this way, we can obtain the pressure contours in the x-y plane once the
value of z is fixed.
Through the addition of both x-z plane and y-z plane potentials on a periodic basis
we are able to obtain a three-dimensional solution that depicts the head pressure contours within a layer of intercellular lipids. Such contours will be logically affected by
the point sources and sinks along the horizontal boundary conditions, whereas the vertical boundary conditions are considered to be of the no-flux type, to represent the
symmetry of the linear flow. We are now able to plot a cross-section of the solution,
by fixing the value of z within the restrictions imposed by the dimensions of the intercellular channel.
We fixed the value of the height of the superimposed solutions to be at the middle
of the intercellular channels. The result shown in Figure 7 represents the pressure contours at such level, where z = i ·L/2.
Page 23 of 25
Marquez-Lago et al. Theoretical Biology and Medical Modelling 2010, 7:33
/>
Acknowledgements
The authors would like to thank colleagues who encouraged them to make the results in [13] summarized and
publicly available. The authors would like to thank Bob Russell and David Muraki for valuable comments. Also, the
authors would like to thank the anonymous reviewers for their valuable comments, including the suggestion to
incorporate references [5-11] and [27] in the text, unknown to us when this manuscript and reference [13] were
written. At the time when research was performed, TML was supported by CONACyT (Mexico, Consejo Nacional de
Ciencia y Tecnología, grant number 148724).
Author details
1
Department of Biosystems Science and Engineering, ETH Zurich, Mattenstrasse 26, 4058 Basel, Switzerland.
2
Department of Mathematics, Simon Fraser University, Burnaby, BC, V5A 1S6, Canada. 3Department of Earth Sciences,
Simon Fraser University, Burnaby, BC, V5A 1S6, Canada. 4Department of Molecular Biology & Biochemistry and
Department of Physics, Simon Fraser University, Burnaby, BC, V5A 1S6, Canada.
Authors’ contributions
All authors participated in designing the study, and analyzing results. TML performed numerical simulations. TML and
DA did the modelling. All authors read and approved the final manuscript.
Competing interests
The authors declare that they have no competing interests.
Received: 17 June 2010 Accepted: 17 August 2010 Published: 17 August 2010
References
1. Golden GM, et al: Stratum corneum lipid phase transitions and water barrier properties. Biochemistry 1987,
26(8):2382-8.
2. Singer SJ, Nicolson GL: The fluid mosaic model of the structure of cell membranes. Science 1972, 175(23):720-31.
3. Green H: Cultured cells for the treatment of disease. Sci Am 1991, 265(5):96-102.
4. Turner NG, Nonato LB: Visualization of the stratum corneum and transdermal permeation pathways, in Mechanisms
of Transdermal Drug Deliver.Edited by: Potts RO, Guy RH. Marcel Dekker Inc; 1997:1-40.
5. Mollee TR, Bracken AJ: A model of solute transport through stratum corneum using solute capture and release. Bull
Math Biol 2007, 69(6):1887-907.
6. Michaels AS, Chandrasekaran SC, Shaw JE: Drug permeation through human skin: Theory and in vitro experimental
measurement. AlChE Journal 1975, 21(5):985-996.
7. Cussler EL, Hughes SE, Ward III WJ, Aris R: Barrier membranes. J Memb Sci 1988, 38:161-174.
8. Frasch HF, Barbero AM: Steady-state flux and lag time in the stratum corneum lipid pathway: results from finite
element models. J Pharm Sci 2003, 92(11):2196-207.
9. Moghimi HR, Williams AC, Barry BW: A lamellar matrix model for stratum corneum intercellular lipids. II. Effect of
geometry of the stratum corneum on permeation of model drugs 5-fluorouracil and oestradiol. Int J Pharm 1996,
131:117-129.
10. Lange-Lieckfeldt R, Lee G: Use of a model lipid matrix to demonstrate the dependence of the stratum corneum’s
barrier properties on its internal geometry. J Controlled Release 1992, 20:183-194.
11. Heisig M, et al: Non steady-state descriptions of drug permeation through stratum corneum. I. The biphasic brickand-mortar model. Pharm Res 1996, 13(3):421-6.
12. Kitson N, Thewalt JL: Hypothesis: the epidermal permeability barrier is a porous medium. Acta Derm Venereol Suppl
(Stockholm) 2000, 208:12-15.
13. Marquez-Lago TT: A Numerical Study of a Porous Media Model for Water Transport and Drug Diffusion through
the Stratum Corneum. M.Sc. thesis Simon Fraser University, Department of Mathematics 2002.
14. White SH, Mirejovsky D, King GI: Structure of lamellar lipid domains and corneocyte envelopes of murine stratum
corneum. An X-ray diffraction study. Biochemistry 1988, 27(10):3725-32.
15. Anderson MP, Woessner WW: Applied Groundwater Modelling, Simulation of Flow and Advective Transport.
Academic Press 1992.
16. Domenico PA, Schwarz FW: Physical and Chemical Hydrogeology. Wiley 1990.
17. Charalambopoulou G: The combination of neutron scattering techniques for the study of hydration of porcine
straum corneum. Stratum Corneum III Basel 2001.
18. Richter T, et al: Investigation of the swelling of human skin cells in liquid media by tapping mode scanning force
microscopy. Appl Phys A 2001, 72(1):S125-S128.
19. Rougier A: In vivo relationship between absorption and transepidermal water loss, in Percutaneous Absorption:
Drugs-Cosmetics-Mechanisms-Methodology.Edited by: Bronaugh RL, Maibach HI. Marcel Drekker Inc; 1999:117-148.
20. Talreja P, et al: Visualization of the lipid barrier and measurement of lipid pathlength in human stratum corneum.
AAPS PharmSci 2001, 3(2):E13.
21. Elias PM, Williams MLK: Structure and function of the stratum corneum 2002 [ />StratumCorneum.htm].
22. Bouwstra JA, et al: Structure of the skin barrier and its modulation by vesicular formulations. Prog Lipid Res 2003,
42(1):1-36.
23. Swartz MA, et al: Mechanics of interstitial-lymphatic fluid transport: theoretical foundation and experimental
validation. J Biomech 1999, 32(12):1297-307.
24. van Kemenade PM: Water and Ion Transport Through Intact and Damaged Skin. Ph.D. thesis Eindhoven University of
Technology 1998.
25. Xiao P, Imhof RE: Water diffusion within stratum corneum. In Photoacoustic and Photothermal Phenomena: 10th
International Conference Edited by: Scudieri F, Bertolotti M 1999, 573-575.
Page 24 of 25
Marquez-Lago et al. Theoretical Biology and Medical Modelling 2010, 7:33
/>
26. Edsberg LE, Natiella JR, Baier RE, Earle J: Mechanical characteristics of human skin subjected to static versus cyclic
normal pressures. Journal of Rehabilitation Research and Development 1999, 36(2).
27. Perry D, Ward WJ, Cussler EL: Unsteady diffusion in barrier membranes. J Memb Sci 1989, 44:305-311.
28. Waterloo Hydrogeologic Inc: Visual MODFLOW v.2.8.2 user’s manual 2000.
29. Ho CK: A geoscience approach to modeling chemical transport through skin 2002 [ />html].
30. Marrink S, Berkowitz M: Water and Mmebranes, Permeability and Stability of Lipid Bilayers.Edited by: Disalvo EA,
Simon SA. CRC Press; 1995:.
31. Honeywell-Nguyen PL, Gooris GS, Bouwstra JA: Quantitative assessment of the transport of elastic and rigid vesicle
components and a model drug from these vesicle formulations into human skin in vivo. J Invest Dermatol 2004,
123(5):902-10.
32. Higo N, et al: Validation of reflectance infrared spectroscopy as a quantitative method to measure percutaneous
absorption in vivo. Pharm Res 1993, 10(10):1500-6.
33. Cevc G, Blume G: Lipid vesicles penetrate into intact skin owing to the transdermal osmotic gradients and
hydration force. Biochim Biophys Acta 1992, 1104(1):226-32.
34. Acheson DJ: Elementary fluid dynamics Oxford University Press, USA 1990.
doi:10.1186/1742-4682-7-33
Cite this article as: Marquez-Lago et al.: A novel approach to modelling water transport and drug diffusion
through the stratum corneum. Theoretical Biology and Medical Modelling 2010 7:33.
Submit your next manuscript to BioMed Central
and take full advantage of:
• Convenient online submission
• Thorough peer review
• No space constraints or color figure charges
• Immediate publication on acceptance
• Inclusion in PubMed, CAS, Scopus and Google Scholar
• Research which is freely available for redistribution
Submit your manuscript at
www.biomedcentral.com/submit
Page 25 of 25