Báo cáo y học: "Correction: Nitrogen washout/washin, helium dilution and computed tomography in the" pptx
Bạn đang xem bản rút gọn của tài liệu. Xem và tải ngay bản đầy đủ của tài liệu tại đây (471.74 KB, 4 trang )
Available online />Page 1 of 4
(page number not for citation purposes)
Following publication of our recent article [1], we noticed
several errors relating to the figures. The complete set of
correct figures follows below (Figure 1, 2, 3, 4 and 5).
The legend for Figure 5, ‘Comparison of end expiratory lung
volume (EELV) measured by the helium dilution technique
and the nitrogen washout/washin method’, was incorrect and
should read as follows:
Comparison of end expiratory lung volume (EELV) measured
by the helium dilution technique and the nitrogen washout/
washin method. (a) The EELV measured by the helium
dilution as a function of the EELV measured by nitrogen
washout/washin method (EELV helium dilution = -111.85 +
0.89 × EELV GE, r
2
= 0.82, p < 0.00001). (b) The Bland-
Altman plot of the EELV measured with the nitrogen
washout/washin technique and the EELV measured with the
helium dilution method. The x-axis shows the mean of the two
measurements and the y-axis shows the difference between
the EELV measured by then helium dilution method and the
nitrogen washout/washin method (average difference -229 ±
164 ml, limits of agreement -558 – 100 ml).
The values in graph (a) of Figures 1, 4 and 5 had been
plotted onto the incorrect axis.
The panels in Figure 3 had been switched. Graph (a) should
be the linear regression plot and graph (b) should be the
Bland-Altman plot.
Reference
1. Chiumello D, Cressoni M, Chierichetti M, Tallarini F, Botticelli M,
Berto V, Mietto C, Gattinoni L: Nitrogen washout/washin,
helium dilution and computed tomography in the assessment
of end expiratory lung volume Critical Care 2008, 12:R150.
Correction
Correction: Nitrogen washout/washin, helium dilution and
computed tomography in the assessment of end expiratory lung
volume
Davide Chiumello
1
, Massimo Cressoni
2
, Monica Chierichetti
2
, Federica Tallarini
2
, Marco Botticelli
2
,
Virna Berto
2
, Cristina Mietto
2
and Luciano Gattinoni
1,2
1
Dipartimento di Anestesia, Rianimazione (Intensiva e Subintensiva) e Terapia del Dolore, Fondazione IRCCS – “Ospedale Maggiore Policlinico
Mangiagalli Regina Elena”, via Francesco Sforza 35, 20122, Milano, Italy
2
Istituto di Anestesiologia e Rianimazione, Fondazione IRCCS – “Ospedale Maggiore Policlinico Mangiagalli Regina Elena” di Milano, Italy; Università
degli Studi di Milano, via Festa del Perdono 7, 20122, Milano, Italy
Corresponding author: Luciano Gattinoni,
See related research by Chiumello et al., />Published: 16 March 2009 Critical Care 2009, 13:405 (doi:10.1186/cc7743)
This article is online at />© 2009 BioMed Central Ltd
Critical Care Vol 13 No 2 Chiumello et al.
Page 2 of 4
(page number not for citation purposes)
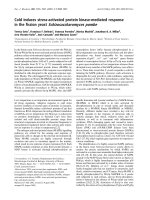
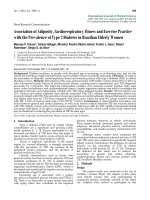
Figure 1
Comparison of end expiratory lung volume (EELV) measured by the Engstrom Carestation and the computed tomography (CT) scan.
(a)The EELV measured by the Engstrom Carestation as a function of the EELV measured by the computed tomography (CT) scan (EELV carestation
= 242 + 0.85 × EELV CT scan, r
2
= 0.89, p < 0.00001). (b) The Bland-Altman plot of the EELV measured with the CT scan and the EELV measured
with the Engstrom Carestation. The x axis shows the mean of the two measurement and the y axis shows the difference between the EELV mea-
sured by the Engstrom Carestation and the EELV measured by the CT scan (average difference 93 ± 143 ml, limits of agreement -50 – 236 ml).
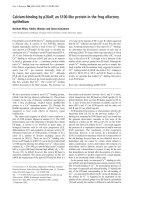
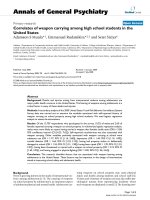
Figure 2
The relative error of the procedire performed by the Engstrom Carestation. This is expressed as (EELV
GE
– EELV
CT SCAN
)/EELV
CT SCAN
as a
function of the ratio between tidal volume and the end expiratory lung volume (EELV) measured by computed tomography (CT) scan ((EELV
GE
–
EELV
CT SCAN
)/EELV
CT SCAN
= 0.05 + 0.43 × (Tidal Volume/EELV
CT SCAN
, r
2
= 0.58, p < 0.0001).
Available online />Page 3 of 4
(page number not for citation purposes)
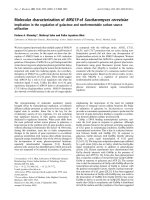
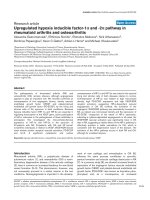
Figure 3
Accuracy of the nitrogen washin-washout technique. (a) The relation between the EELV measured by increasing the FiO
2
as a function of the
EELV obtained decreasing FiO
2
. The EELV obtained increasing the FiO
2
was -56 + 1.0078 multiplied by the EELV obtained decreasing the FiO
2
(r
2
= 0.84, p < 0.0001). (b) The Bland-Altman plot of the EELV measurement obtained increasing the FiO
2
and the EELV obtained decreasing the
FiO
2
. The x axis shows the mean of the two measurements and the difference between the EELV measured by increasing FiO
2
and the y axis
shows the EELV obtained decreasing FiO
2
(average difference 48 ± 165 ml, limits of agreement -117–213 ml).
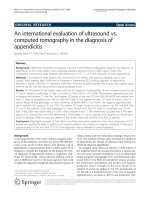
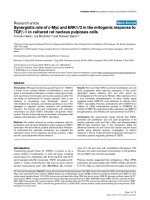
Figure 4
Comparison of end expiratory lung volume (EELV) measured by the helium dilution technique and the computed tomography (CT) scan.
(a) The EELV measured by the helium dilution technique as a function of the EELV measured by the CT scan (EELV helium dilution = 20 + 0.84 ×
EELV CT scan, r
2
= 0.91, p < 0.00001). (b) The Bland-Altman plot of the EELV measured with the CT scan and the EELV measured with the
helium dilution method. The x axis shows the mean of the two measurements and the y axis shows the difference between the EELV measured by
the helium dilution method and the EELV measured by the CT scan (average difference -136 ± 133 ml, limits of agreement -3 – 269 ml). The
difference between the EELV measured with the helium dilution method and the EELV measured with CT scan was significantly correlated with the
EELV, expressed as the average between the two measurements (Helium EELV - CT scan EELV = -15.52764 + -0.17034 × (helium EELV + CT
scan EELV)/2, r
2
= 0.21, p = 0.005838).
Critical Care Vol 13 No 2 Chiumello et al.
Page 4 of 4
(page number not for citation purposes)
Figure 5
Comparison of end expiratory lung volume (EELV) measured by the helium dilution technique and the nitrogen washout/washin method.
(a) The EELV measured by the helium dilution as a function of the EELV measured by nitrogen washout/washin method (EELV helium dilution =
-111.85 + 0.89 × EELV GE, r
2
= 0.82, p < 0.00001). (b) The Bland-Altman plot of the EELV measured with the nitrogen washout/washin
technique and the EELV measured with the helium dilution method. The x-axis shows the mean of the two measurements and the y-axis shows the
difference between the EELV measured by then helium dilution method and the nitrogen washout/washin method (average difference -229 ± 164
ml, limits of agreement -558 – 100 ml).