Báo cáo y học: "A simple intravenous glucose tolerance test for assessment of insulin sensitivity" pptx
Bạn đang xem bản rút gọn của tài liệu. Xem và tải ngay bản đầy đủ của tài liệu tại đây (751.78 KB, 10 trang )
RESEARCH Open Access
A simple intravenous glucose tolerance test for
assessment of insulin sensitivity
Robert G Hahn
1,2*
, Stefan Ljunggren
2,3
, Filip Larsen
4
and Thomas Nyström
3
* Correspondence: r.hahn@telia.
com
1
Section for Anesthesia, Faculty of
Health Sciences, Linköping
University, Linköping, Sweden
Full list of author information is
available at the end of the article
Abstract
Background: The aim of the study was to find a simple intravenous glucose
tolerance test (IVGTT) that can be used to estimate insulin sensitivity.
Methods: In 20 healthy volunteers aged between 18 and 51 years (mean, 28)
comparisons were made between kinetic parameters derived from a 12-sample, 75-
min IVGTT and the M
bw
(glucose uptake) obtained during a hyperinsulinemic
euglycemic glucose clamp. Plasma glucose was used to calculate the volume of
distribution (V
d
) and the clearance (CL) of the injected glucose bolus. The plasma
insulin response was quantified by the area under the curve (AUC
ins
). Uptake of
glucose during the clamp was corrected for body weight (M
bw
).
Results: There was a 7-fold variation in M
bw
. Algo rithms based on the slope of the
glucose-elimination curve (CL/V
d
) in combination with AUC
ins
obtained during the
IVGTT showed statistically significant correlations with M
bw
, the linearity being r
2
=
0.63-0.83. The best algorithms were associated with a 25-75
th
prediction error
ranging from -10% to +10%. Sampling could be shortened to 30-40 min without loss
of linearity or precision.
Conclusion: Simple measures of glucose and insulin kinetics during an IVGTT can
predict between 2/3 and 4/5 of the insulin sensitivity.
Introduction
The best esta blished methods of measuring insulin resistance are the hyperinsulinemic
euglycemic glucose clamp and the intravenous glucose tolerance test (IVGTT), of
which former is the “gold standard” [1-3]. These methods have a long history as inves-
tigative tools i n diabetes research but are too cumbersome to be used during surgery,
although insulin resistance develops in this setting [4,5].
The aim of this project is to evaluate a simplified IVGTT test that lasts for 30, 40 or
75 min. This test is less labour-intensive than both the glucose clamp and the conven-
tional IVGTT. Analysis of the data is based on a comparison between the “strength” of
the insulin response and the elimination kinetics of glucose. A commonly used expres-
sion for the “strength” of a physiological factor is the area under the curve (AUC),
which was applied here on insulin, while the slope of the elimination curve for glucose
served to quantify the “effect”.
The hypothesis was that the test could predict insulin resistance with the same or
higher precision than the “minimal model” (MINMOD) which is typically based on a
longer IVGTT and quite demanding mathematically [6,7]. We assessed this objective
Hahn et al. Theoretical Biology and Medical Modelling 2011, 8:12
/>© 2011 Hahn et al; licensee BioMed Central Ltd. This is an Ope n Access article distributed under the terms of the Creative Co mmons
Attribution License (http://creativecomm ons.org/licenses/by/2.0), which permits unrestricted use, distribution, and reproductio n in
any medium, provided the original work is prop erly cited.
by comparing the simplified IVGTT with the result of the glucose clamp in 20 healthy
volunteers.
Materials and methods
Twenty non-obese healthy volunteers, 8 females and 12 males, aged between 18 and 51
(mean, 28) years and with a body weight of 49-88 (mean, 68) kg, were studied. None of
them had any disease requiring medication, and routine blood chemistry confirmed the
absence of metabolic disease (Table 1, top). The study was approved by the Regional
Ethics Committee in Stockholm and complied with the Helsinki D eclaration. Each
volunteer gave his/her written consent to participate.
Euglycemic hyperinsulinemic clamp
The subjects reported at the laboratory between 7.30-8.00 AM. A superficial dorsal
hand vein was cannulated in retrograde direction with a small three-way needle and
kept patent by repeated flushing with saline solution. The hand and lower arm were
warmed by a heating pad for intermittent samp ling of arteri alized venous b lood for
glucose determination (Hemocue, Ängelholm, Sweden). In the opposite arm an intra-
venous catheter was inserted into t he left antecubital vein for insulin and glucose
infusion.
During the 120-min test, insulin 20 mU · BSA m
-2
·min
-1
(Human Actrapid, Novo-
Nordisk A/S, Bagsverd, Denmark) was infused along with 20% dextrose (Fresenius
Kabi, Uppsala, Sweden). Baseline blood samples were drawn and the euglycemic
Table 1 Baseline data and key results for the IVGTT and the glucose clamp.
Parameter Mean (SD), or median
(25
th
-75
th
percentiles)
Unit
Health status
Body mass index 23.4 (2.3) kg/m
2
HbA1c 44 (0.5) mmol/mol
Blood Hb concentration 126 (14) mmol/L;
Serum creatinine concentration 83 (3) μmol/L
Serum sodium and potassium concentrations 141 (2); 3.9 (0.3) mmol/L
IVGTT
Plasma glucose, baseline 4.8 (0.5) mmol L
-1
Plasma insulin, baseline 21 (12-24) pmol L
-1
Volume of distribution (V
d
) 14.0 (6.5) L
per kg body weight 0.20 (0.09) L kg
-1
Clearance (CL) 0.63 (0.26) L min
-1
per kilo body weight 9.3 (3.8) ml min
-1
kg
-1
Insulin sensitivity (S
I
) of MINMOD 16 (7-32) 10
-5
L pmol
-1
min
-1
Glucose effectiveness (S
G
) in MINMOD 13 (5-26) 10
-3
min
-1
Glucose clamp
Plasma glucose, baseline 5.0 (1.0) mmol L
-1
Plasma insulin, baseline 16 (7-30) pmol L
-1
Plasma glucose, mean 90-120 min 5.7 (0.3) mmol L
-1
Plasma insulin, mean 90-120 min 167 (34) pmol L
-1
Glucose metabolism, M, 90-120 min 3.1 (1.2) mmol min
-1
M
bw
= per kg body weight 45 (15) μmol min
-1
kg
-1
IVGTT = intravenous glucose tolerance test
Hahn et al. Theoretical Biology and Medical Modelling 2011, 8:12
/>Page 2 of 10
hype rinsulinemic clamp was initiated by infusion of a bolus dose of insulin for 4 min-
utes followed by a step-wise increas e in glucose for 10 min. The glucose infusion rate
wasadjustedtokeepthesubjects’ blood glucose level constant at 5 mmol/L on the
basis of arterialized samples withdrawn every 5 min from the dorsal hand vein catheter
[8]. The infusion rate during the last 30 min, after correction for body weight, was
taken to represent the metabolism of glucose (M
bw
) [1-3].
Intravenous glucose tolerance test
On the second occasion, 1-2 days apart from the clamp study and after 12 h of fasting,
a regular intravenous gluco se tolerance test (IVGTT) was performed to determine the
early insulin response phase (0-10 min), as well as the area-under-the-curve fo r insulin
(AUC
ins
being total insulin and ΔAUC
ins
above baseline) and C-peptide for up to 75
minutes. A bolus of glucose (300 mg/kg in a 30% solution) was given within 60 sec
into the antecubital vein. Blood was sample d from the contralateral antecubital vein at
0, 2, 4, 6, 8, 10, 20, 30, 40, 50, 60 and 75 min for assessment of the plasma glu cose,
insulin, and C-peptide concentrations. Plasma glucose was measured by the glucose
oxidase method used by the hospital’s routine laboratory. Plasma insulin and C-peptide
were measured using ELISA kits (Mercodia AB, Uppsala, Sweden).
Calculations
The pharmacokinetics of the glucose load was analysed using a one-compartment open
model [9]. Here, the plasma co ncentration (G)atanytime(t)resultingfrominfusing
glucose at the rate R
o
is calculated from the following differential equation:
d(G − G
b
)
dt
=
R
o
V
d
−
CL
V
d
∗ (G(t) − G
b
)
where G
b
is the baseline glucose, V
d
is the volume of distribution, CL the clearance
and CL/V
d
the slope of the glucose elimination curve. The half-life (T
1/2
)oftheexo-
genous glucose load was obtained as (ln 2 V
d
/CL).TheAUCforplasmainsulinwas
calculated by using the linear trapezoid method.
The glucose and insulin data were also analyzed by applying the “minimal model”
(MINMOD) of Bergman et al. [6,7]. The kinetic system consists of two differential
equations:
dG
dt
= −G(t) ∗
S
G
+ X(t)
+ G
b
∗ S
G
dX
dt
= −p
2
∗ X(t)+p
3
∗ F(t), S
I
=
p
3
p
2
where S
I
= glucose sensitivity, S
G
= glucose effectiveness, X(t) is insulin action in the
interstitia l fluid space, and F(t) a function for the elevation of plasma insulin above the
basal l evel. p
2
is the removal rate of insulin from the interstitial fluid space while p
3
describes the movement of circulating insulin to the interstitial space.
The best estimates for the unknown parameters in these models were estimated for
each of the 20 experiments individually by nonlinear least-squares regression. No
weights were used. The mathematical software was Matlab R2010a (MathWorks,
Natick, MA, USA).
Hahn et al. Theoretical Biology and Medical Modelling 2011, 8:12
/>Page 3 of 10
The insulin sensitivity was also quantified by “Quicki”, which is the inverse of the
logarithm of the product of plasma glucose and plasma insulin at baseline [10]. Finally,
we tested the recently proposed equation by Tura et al. [11] for short IVGTTs:
CS
1
= 0.276
K
G
AUC
ins
/
T
where CS
1
a surrogate measure for insulin sensitivity, K
G
is the slope of the glucose
elimination curve (same as CL/V
d
) and T is the time after 10 min.
Statistics
The results were presented as mean and stand ard deviation (SD) and, when there was
a skewed distribution, as the median (25
th
-75
th
percentile range). Simple or multiple
linear regression analysis, in which r
2
is the coefficient of determination, was used to
express “linearity” when studying the relationship between the M
bw
of the glucose
clamp (control) and various a lgorithms for insulin sensitivity derived from data col-
lectedduringtheIVGTT.TheerrorinthepredictionofM
bw
associated with each
regression analysis was obtained as [100% (fitted-measured)/measured]. The change in
prediction error obtained by restricting the analysis period from 75 to 40 and 30 min
was tested by Friedman’s test. All reported correlatio ns were statistically significant by
P < 0.05.
Results
Clamp
M
bw
of the glucose clamp varied 7-fold (Table 1, middle). Between 2/3 and 4/5 of thi s
variability could be predicted by linear regression based on indices of glucose and insu-
lin turnover obtained from the data collected during the IVGTT.
IVGTT
All 20 experiments could be analysed with the proposed equations for plasma glucose
and insulin kinetics (Figure 1; Table 1, bottom). However, the glucose kinetics of 3
experiments were studied only up to 40 min due to rapid elimination followed by mild
hypoglycemia, which otherwise distorted the elimination slope.
First key algorithm
One useful algorithm contained the
10
log of the product of T
1/2
for the exogenous glu-
cose load and AUC for p lasma insulin. Various modifications of the algorithm corre-
lated with M
bw
with a linearity of r
2
= 0.63-0.68 (Figure 2A, Table 2).
Consistently weaker correlations were obtained on correcting M
bw
for the steady
state plasma glucose and insulin concentrations (data not shown, r
2
≈0.40-0.50).
This key algorithm has the same construction as “Quicki” which uses only the baseline
values of plasma glucose and insulin. The original “Quicki” equation correlated with M
bw
with a linearity of only r
2
= 0.41 (Figure 2B) which was still slightly stronger than for other
similar expressions, such as HOMA-IR (r
2
= 0.35) and the G/I ratio (r
2
= 0.39) [2].
MINMOD and Tura’s equation
Weaker correlations were also obtained when comparing M
bw
with the insulin sensitiv-
ity as obtained by “minimal model analysis” (MINMOD) of the IVGTT data (r
2
= 0.34,
Hahn et al. Theoretical Biology and Medical Modelling 2011, 8:12
/>Page 4 of 10
Figure 2C). Plots of X(t) obtained by MINMOD indicated that the insulin conc entra-
tion at the effect site was highest at 18 min (13-33) min.
The recently publish ed equation by Tura et al. [11] correlated with M
bw
with a line-
arity of r
2
=0.54fortheperiod0-40min.Logarithm-transformation of Tura’ssurro-
gate measure for insulin sensitivity increased r
2
to 0.65.
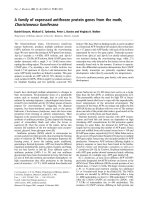
Figure 1 Plasma concentrations during the IVGTT. Plasma glucose above baseline (A) and the plasma
insulin (B) and C-peptide concentrations (C) during 20 intravenous glucose tolerance tests (IVGTTs). The
thin lines represent one experiment. The thick line in A is the modelled average curve, based on the
kinetic data shown in Table 1, while B and C are the mean for each point in time.
Hahn et al. Theoretical Biology and Medical Modelling 2011, 8:12
/>Page 5 of 10
Second key algorithm
Another equation applied the parameters of the glucose kinetics directly and might
therefore be easier to handle (Table 3, Figure 3A).
A promising modification of this second key algorithm inserted the parameters of the
glucose kinetics a nd the AUC for plasma insulin in a multiple regression equation,
which yielded a maximum linearity of r
2
= 0.83 for the relationship between the
IVGTT and M
bw
(Table 3, Figure 3B).
Slight strengthening of the linearity was always obtained by using AUC
ins
without
correction for the baseline plasma insulin level (Tables 2 and 3).
Exploratory analyses
Replacing AUC
ins
by the sum of th e plasma insulin concentrations for vario us periods
of time did not greatly impair linearity or the prediction error (Table 3, Figure 3C).
The overall linear correlation between the AUC for C-peptide and insulin was r
2
=
0.66. However, replacing AUC
ins
by AUC for C-pept ide in the equations proposed
above greatly reduce their linearity with M
bw
(r
2
≈ 0.20).
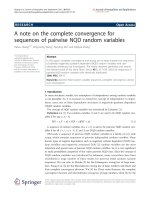
Figure 2 Insulin resistance as given by the glucose cl amp and a short IVGTT.(A) The relationship
between M
bw
of the hyperinsulinemic euglycemic clamp and a surrogate expression for insulin sensitivity
based on the half-life of glucose and the area under the curve (AUC) for plasma insulin during a 75-min
IVGTT in 20 volunteers. (B) Same equation but using only baseline plasma glucose and insulin
concentrations. (C)M
bw
versus insulin sensitivity obtained by “minimal model” (MINMOD) analysis.
Table 2 Linear correlations between the IVGTT and the glucose clamp.
Y X Equation Time
period
r
2
25
th-
75
th
percentiles
of prediction error
M
bw
1
10
log(T
1
/
2
• AUC
ins
)
Y = -172 + 1040 X 75 min 0.63 -10% +16%
Y = -201 + 1179 X 40 min 0.63 -8% +20%
Y = -219 + 1256 X 30 min 0.62 -12% +26%
Same equation, but using total insulin AUC Y = -220 + 1310 X 75 min 0.68 -11% +9%
Y = -218 + 1287 X 40 min 0.63 -8% +12%
Y = -248 + 1419 X 30 min 0.66 -8% +20%
M
bw
1
10
log(glucose
o
*Ins
o
)
Y = -19 +124 X Baseline
“Quicki”
0.41 -14% +11%
M
bw
S
I
of MINMOD 10
-5
Y = 36 + 0.38 X 75 min 0.34 -16% +24%
Equations compare the cellular uptake of glucose obtained by the glucose clamp (M
bw,;
μmol min
-1
kg
-1
) and indices of
glucose kinetics and plasma insulin obtained during an intravenous glucose tolerance test (IVGTT) in 20 non-obese
volunteers.
T
1/2
= half-life of exogenous glucose (units: min)
Glucose
o
, Ins
o
= plasma concentrations of glucose and insulin at baseline (units: mmol L
-1
and pmol L
-1
)
AUC
ins
= area under the curve for plasma insulin over time (unit: pmol min L
-1
)
MINMOD = “minimal model analysis” according to Bergman et al.[6]
Hahn et al. Theoretical Biology and Medical Modelling 2011, 8:12
/>Page 6 of 10
Discussion
IVGTT versus the glucose clamp
The present study searched for an approach to estimate insulin sensitivity that requires
only minimum of resources. The results are presented as a number of regression equa-
tions that compare M
bw
of the glucose clamp (control) with minor mathematical varia-
tions of two key algorithms based on data derived from a short IVGTT. Any of them
may be used as substitutes for a glucose clamp in healthy v olunteers, although some
offer stronger linearity and a smaller prediction error than others.
Thefirstofthekeyalgorithms,shownontop of Table 2, is constructed in a way
similar to t he “Quicki” [10]. However, the linearity was much stronger when based on
the IVGTT as compared to the baseline data used in the “Quicki” (Figure 2A, B).
Various modifications of the second key algorithm, presented in Table 3, were also
tested. A promising change was to consider the sum of the slope of the glucose
Table 3 Further linear correlations between the IVGTT and the glucose clamp.
Y X Equation Time
period
r
2
25
th-
75
th
percentiles
of prediction error
M
bw
10
log
CL ∗ 10
6
V
d
• AUC
ins
Y = -2.5 + 45.4 X 75 min 0.64 -10% +16%
Y = -8.6 + 51.5 X 40 min 0.64 -8% +21%
Y = -13.8 + 54.9 X 30 min 0.64 -12% +25%
Same equation, but using total
insulin AUC
Y = -2.8 + 53.4 X 75 min 0.68 -10% +9%
Y = -6.1 + 54.0 X 40 min 0.64 -8% +13%
Y = -14.5 + 60.0 X 30 min 0.67 -8% +20%
M
bw
10
lo
g
[AUC
ins
]
Y = 206 - 49.0 X + 340 CL/V
d
75 min 0.70 -11% +16%
Y = 224 - 56.4 X + 480 CL/V
d
40 min 0.74 -10% +20%
Y = 223 - 57.9 X + 580 CL/V
d
30 min 0.70 -10% +23%
Same equation, but using total
insulin AUC
Y = 265 - 63.6 X + 383 CL/V
d
75 min 0.83 -9% +11%
Y = 262 - 65.4 X + 488 CL/V
d
40 min 0.82 -10% +11%
Y = 260 - 67.1 X + 602 CL/V
d
30 min 0.79 -8% +14%
M
bw
10
log
CL ∗ 10
6
V
d
• Ins
mean
Y = -99 + 54.0 X 75 min 0.63 -10% +16%
Y = -9 + 51.5 X 10-40 min 0.64 -8% +21%
Y = -14 + 54.9 X 10⁻³⁰ min 0.64 -12% +26%
V
d
, CL = volume of distribution and clearance of glucose for the IVGTT (units: L and L min
-1
, respectively).
Ins
mean,
= mean value plasma of insulin (units: pmol L
-1
)
AUC
ins
= area under the curve for plasma insulin over time (unit: pmol min L
-1
)
Figure 3 Insulin resistance by the glucose clamp and a short IVGTT. The relationship between M
bw
and various combinations of the clearance (CL) and volume of distribution (V
d
) of glucose and (A, B) the
area under the curve for plasma insulin (AUC
ins
) during the 75-min IVGTT, or (C) using the mean plasma
insulin level measured at 10, 20, 30, and 40 min.
Hahn et al. Theoretical Biology and Medical Modelling 2011, 8:12
/>Page 7 of 10
elimination curve, CL/V
d
,andtheinsulin“pressure”,AUC
ins
, in a multiple regression
equation. This approac h could explain up to 83% of the inter-individual variability in
M
bw
(Figure 3).
Reducing the sampling time from 75 min to 40 min, or even 30 min, had only small
undue effects on our quality measures, i.e. the linearity and the prediction error.
Corrections for baseline concentrations
The relationship between plasma insulin and glucose is not a simple one. The dose-
response curve is hyperbolic (saturation kinetics) [2,3] and the CL of glucose is related
to the
10
log of the insulin level [3,12].
The saturation kinetics makes it questionable to correct M
bw
for the steady state
insulin level in plasma to yield the M
bw
/I ratio, alth ough this is often done. The high
concentration of insulin at the effect site at the end of a glucose clamp probably
changes CL very little for a large increment in plasma insulin. Correcting M
bw
for
steady state plasma insulin also resulted in poorer correlations vis-à-vis the IVGTT.
Likewise, one may question whether baseline insulin should be subtracted from
AUC
ins
when estimating M
bw
from an IVGTT test. Althoug h being a logical and com-
monly used c orrection, disregarding the baseline strengthened the correlations in the
present study. Inhibition of the endogenous glucose production taking place early dur-
ing the IVGTT is likely to make the insuli n concentration below baseline govern the
disposition o f both the exogenous and the endogenous glucose later during the test.
Differences in the mathematical correlations between the glucose clamp and the
IVGTT were fairly small, however, and we therefore conclude that correcting for base-
line insulin can be done, but is not essential.
Comparison with other methods
The precision by which our 12-sample IVGTT could predict insulin sensitivity sta nds
out favourably in comparison with other and more complex approaches, as presented
in a review by Borai et al. [1].
A previous study of MINMOD based on a seri es of 25 blood samples showed a line-
arity to the glucose clamp that was quite similar to the r
2
= 0.34 found here [13]. The
new algorithms thus offered far better linearity than MINMOD in the present setti ng.
MINMOD contains four unknown parameters that become gradually more difficult to
estimate with good precision the fewer samples there are available. Moreover, MIN-
MOD is not well suited for short sampling times. In c ontrast, the new algorithms
included least-square regressio n estimation of o nly two parameters, CL and V
d
,which
makes them less sensitive for a reduction of sampling time and/or sampl ing intensity.
With 12 samples, CL and V
d
were estimated with the standard errors that averaged
less than 10% (data not shown).
Tura et al. [11] recently compared the ratio of the glucose disappearance rate and
AUC
ins
with S
I
and M
bw
in a retrospective analysis of studies comprising both volun-
teers and diabeti c and postoperative patients who had undergone a frequently sampled
50-min IVGTT and a conventional 2-hour glucose clamp. G ood correlations between
these ind ices of insulin sensitivity were claimed for all subgro ups. The basic equat ion
used is quite s imilar to the one we propose on the top of Table 3. However, they did
not use the
10
log of AUC
ins
and corrected this area for the group average S
I
value.
Hahn et al. Theoretical Biology and Medical Modelling 2011, 8:12
/>Page 8 of 10
They also divided the expression by the sampling time, which we find questionable
since plasma insulin but not K
G
decreases with time. This fact must be handled by
using a unique equation for each sampling time, as in Tables 2 and 3.
Limitations during surgery
The present study suggests two key algorithms, together with various modifications
thereof, that may be used to estimate insulin sensitivity based on data derived from a
short IVGTT performed in healthy volunteers. In a subsequent study, these algorithms
will be validated in the pre- and postoperative settings. Our interest in this topic stems
from a wish to study insulin resistance during surgery. Virtually all non-diabetic
patients develop transient type 2 diabetes as a part of the stress r esponse to surgery
[4,5]. Too little research has been performed to investigate the reasons and conse-
quences of this insulin resistance, w hich is probably due to the demanding and com-
plex nature of both the glucose clamp and the IVGTT. In this setting, it is important
that the bl ood sampling and the time and resources required for the test are kept low.
Moreover, the test should impose only a slight burden on the body’s physiology.
Conclusion
The ratio of the slope of the glucose elimination curve and the AUC for plasma insulin
during a sho rt IVGTT showed a strong linear correlation (r
2
= 0.63-0.83) with the
insulin sensitivity as obtained by the glucose clamp technique in healthy volunteers.
Abbreviations
AUC: area under the curve; CL: clearance; IVGTT: intravenous glucose tolerance test; MINMOD: minimal model analysis;
V
d
: volume of distribution; T
1/2
: half-life.
Acknowledgements and Funding
Tobias Gebäck, Chalmers School of Technology, Gothenburg, Sweden, programmed the MINMOD in the Matlab
environment. Financial support was received from the Stockholm County Council (Grant number 2009-0433), Olle
Engkvist Byggmästare Foundation, Karolinska institute, Swedish Society for Medical Research, and the Swedish Society
of Medicine. The work was performed at The Metabolic Laboratory of the Endocrinology Department at
Södersjukhuset, Stockholm, Sweden.
Author details
1
Section for Anesthesia, Faculty of Health Sciences, Linköping University, Linköping, Sweden.
2
Research Unit, Södertälje
Hospital, Södertälje, Sweden.
3
Karolinska Institutet, Department of Clinical Science and Educat ion, Södersjukhuset,
Section of Internal Medicine, Södersjukhuset, Sweden.
4
Karolinska institutet, Department of Physiology and
Pharmacology, Stockholm, Sweden.
Authors’ contributions
RH provided the study idea, made the calculations, and wrote the manuscript. SL and FL assisted during the
experiments. TN wrote the ethics application and arranged for the experiments.
Competing interests
The authors declare that they have no competing interests.
Received: 14 April 2011 Accepted: 2 May 2011 Published: 2 May 2011
References
1. A Borai, C Livingstone, GAA Ferns, The biochemical assessment of insulin resistance. Ann Clin Biochem. 44, 324–342
(2007). doi:10.1258/000456307780945778
2. R Muniyappa, S Lee, H Chen, MJ Quon, Current approaches for assessing insulin sensitivity and resistance in vivo:
advantages, limitations, and appropriate usage. Am J Physiol Endocrinol Metab. 294, E15–26 (2008)
3. E Ferrannini, A Mari, How to measure insulin sensitivity. J Hypertens. 16, 895–906 (1998). doi:10.1097/00004872-
199816070-00001
4. LS Brandi, M Frediani, M Oleggini, F Mosca, M Cerri, C Boni, N Pecori, G Buzzigoli, E Ferrannini, Insulin resistance after
surgery: normalization by insulin treatment. Clin Sci. 79, 443–450 (1990)
5. O Ljungqvist, A Thorell, M Gutniak, T Häggmark, S Efendic, Glucose infusion instead of preoperative fasting reduces
postoperative insulin resistance. J Am Coll Surg. 178, 329–336 (1994)
Hahn et al. Theoretical Biology and Medical Modelling 2011, 8:12
/>Page 9 of 10
6. RN Bergman, YZ Ider, CR Bowden, C Cobelli, Quantitative estimation of insulin sensitivity. Am J Physiol. 236, 667–677
(1979)
7. A Nittala, S Ghosh, D Stefanovski, R Bergman, X Wang, Dimensional analysis if MINMOD leads to definition of the
disposition index of glucose regulation and improved simulation algorithm. Biomed Engineering OnLine. 5,44–57
(2006). doi:10.1186/1475-925X-5-44
8. RA deFronzo, JD Tobin, R Andres, Glucose clamp technique: a method for quantifying insulin secretion and resistance.
Am J Physiol. 273, E214–23 (1979)
9. F Sjöstrand, RG Hahn, Validation of volume kinetic analysis of glucose 2.5% solution given by intravenous infusion. Br J
Anaesth. 90, 600–607 (2003). doi:10.1093/bja/aeg102
10. A Katz, SS Nambi, K Mather, AD Baron, G Sullivan, MJ Quon, Quantitative insulin sensitivity check index: a simple,
accurate method for assessing insulin sensitivity in humans. J Endocrinol Metab. 85, 2402–2410 (2000). doi:10.1210/
jc.85.7.2402
11. A Tura, S Sbrignadello, E Succurro, L Groop, G Sesti, G Pacini, An empirical index of insulin sensitivity from short IVGTT:
validation against the minimal model and glucose clamp indices in patients with different clinical characteristics.
Diabetologia. 53, 144–152 (2010). doi:10.1007/s00125-009-1547-9
12. D Berndtson, J Olsson, RG Hahn, Hypovolaemia after glucose-insulin infusions in volunteers. Clin Sci. 115, 371–378
(2008). doi:10.1042/CS20080032
13. JC Beard, RN Bergman, WK Ward, D Porte, The insulin sensitivity index in non-diabetic man: correlation between clamp-
derived and IVGTT-derived values. Diabetes. 35, 362–369 (1986). doi:10.2337/diabetes.35.3.362
doi:10.1186/1742-4682-8-12
Cite this article as: Hahn et al.: A simple intravenous glucose tolerance test for assessment of insulin sensitivity.
Theoretical Biology and Medical Modelling 2011 8:12.
Submit your next manuscript to BioMed Central
and take full advantage of:
• Convenient online submission
• Thorough peer review
• No space constraints or color figure charges
• Immediate publication on acceptance
• Inclusion in PubMed, CAS, Scopus and Google Scholar
• Research which is freely available for redistribution
Submit your manuscript at
www.biomedcentral.com/submit
Hahn et al. Theoretical Biology and Medical Modelling 2011, 8:12
/>Page 10 of 10